Abstract
Objective(s):
For determining the mechanism of anti-asthmatic effect of thymoquinone, this investigation evaluated the effect of thymoquinone in the presence of selective A2A and A2B adenosine receptor antagonists (ZM241385 and MRS1706, respectively).
Materials and Methods:
Seventy guinea pigs were randomly divided to 7 groups; control (C), sensitized with ovalbumin (S), sensitized groups pretreated with thymoquinone (S+TQ), ZM241385 (S+Anta A2A), MRS1706 (S+Anta A2B), thymoquinone and antagonists (S+Anta A2A+TQ and S+Anta A2B+TQ). Thymoquinone and each of these antagonists with 3 mg/kg dose were injected i.p. on 10th day of sensitization protocol. Tracheal responsiveness (TR) to methacholine and ovalbumin (OA), and total and differential cell count in lung lavage fluid (LLF) in different groups were measured.
Results:
Increased EC50 and LLF neutrophil count and decreased TR to methacholine and OA, LLF eosinophil and basophil counts were observed in S+TQ group compared to S group (P<0.001 to P<0.05). Significant decrease in EC50 (P<0.01), LLF neutrophil, lymphocyte and monocyte count (P<0.001 for all) and significant increase in TR to OA (P<0.01), LLF total WBC (P<0.01) and eosinophil count (P<0.001) were observed in S+A2A group compared to S+TQ group. There was significant increase in LLF eosinophil and monocyte counts in S+Anta A2B group compared with S+TQ group (P<0.001 for both). In S+TQ+Anta A2A group, there was significant increase in LLF eosinophil (P<0.001) and significant decrease in LLF neutrophil (P<0.01) and monocyte (P<0.001) counts compared with S+TQ group.
Conclusion:
Thymoquinone affects adenosine receptors, which suggest that some of its anti-inflammatory effects may be mediated by these receptors.
Keywords: Asthma, Adenosine receptor, MRS1706, Thymoquinone, ZM241385
Introduction
Asthma is a chronic disease characterized by a variety of features including increased airway responsiveness and reversible airways obstruction and inflammation (1). Studies on animals and humans have shown that bronchoconstriction is most likely due to the release of inflammatory mediators from different cells (2). Many drugs were used for treatment of this disease. Although these drugs are effective, but there are many side effects. Therefore, the physicians try to find the new drugs that have fewer side effects. Scientists are trying to find out new and valid therapies, traditional or folk medicines in parallel with modern medicine (3). Nigella sativa L., and its oils have been used traditionally for the treatment of many inflammatory diseases such as asthma (4, 5). Thymoquinone is an active ingredient isolated from N. sativa, and previous in vitro and in vivo studies demonstrated its beneficial effects (6). Therapeutic effects of thymoquinone on patients with allergic diseases (including allergic rhinitis, bronchial asthma, and atopic eczema) were also demonstrated (7). It has a potent antihistaminic effect on airways of asthmatic patients (8). Thymoquinone is more potent inhibitor of asthmatic inflammatory changes. This constituent attenuates allergic airway inflammation by inhibiting Th2 cytokines and eosinophil infiltration into the airways; thus demonstrates its potential anti-inflammatory role during the allergic response in the lung (9).
Evidence has increasingly implicated adenosine, the breakdown product of ATP, in the pathophysiology of asthma (10). Elevated levels of adenosine have been found in blood, bronchoalveolar lavage and exhaled breath condensate of asthmatic patients (11). A number of evidences suggest that adenosine modulates the function of different cells involved in airway inflammation (2). Biological functions of adenosine are mediated by four distinct subtypes of receptors (A1, A2A, A2B, and A3). Although adenosine receptors are ubiquitously expressed throughout the body, but the relative expression of adenosine receptor sub types is little known. Some studies in healthy peripheral lung tissue have suggested that A2 receptor subtypes are much more abundant than the A1 and A3 receptor subtypes (12).
The exact mechanism of thymoquinone on asthma has not been cleared yet and adenosine effect in pathophysiology of this disease has been shown before. So in this investigation, the effect of thymoquinone in the presence of selective A2A and A2B adenosine receptor antagonists (ZM241385 and MRS1706 respectively) were examined on tracheal responsiveness to methacholine and ovalbumin (OA), and total and differential cell count in lung lavage fluid of sensitized guinea pigs.
Materials and Methods
Animal sensitization and animal groups
Seventy adult Dunkin-Hartley guinea pigs (400 to 700 g, male sex) were used throughout the study. The animals were group-housed in individual cages in climate-controlled animal quarters with water and food ad libitum and a12-hr on/12-hr off light cycle.
After ten days, for adapting to the new situation, animals were randomly divided into seven groups; control group (C), OA sensitized group (S), sensitized groups pretreated with thymoquinone (S+TQ), sensitized groups pretreated with selective A2A antagonist (ZM241385) and selective A2B antagonist (MRS1706) (S+Anta A2A and S+Anta A2B), sensitized groups pretreated with selective A2A antagonist and thymoquinone (S+Anta A2A+TQ) and selective A2B antagonist and thymoquinone (S+Anta A2B+TQ). Thymoquinone and each of these antagonists (Tocris bioscience Ltd., UK) with 3 mg/kg dose were injected intraperitoneally on 10th day of sensitization protocol.
Sensitization of animals to OA was performed according to our previous study (13). Briefly, guinea pigs were sensitized to OA (Grade II Sigma Chemical Ltd., UK) dissolved in saline by injecting 100 mg IP and 100 mg SC on 1st day and a further 10 mg IP on 8th day. From 14th day, sensitized animals were exposed to an aerosol of 4% OA for 18±1 days, 4 min daily. The aerosol was administered in a closed chamber, dimensions 30×20×20 cm. Control animals were treated similarly but saline was used instead of OA. The Ethical Committee of Tabriz University of Medical Sciences approved this study.
Tissue preparation
Guinea pigs were slaughtered by a blow on the neck and the trachea was then removed. One tracheal chain in each animal was prepared as follows: The trachea was cut into 10 rings (each containing 2 to 3 cartilaginous rings). Then, in order to form a tracheal chain, all the rings were cut open opposite the trachealis muscle and sutured together. Tissue was then suspended in a 20ml organ bath (Schuler organ bath type 809, Germany). The organ bath chambers contained Krebs-Henseliet solution of the following composition (mM): KH2PO4 (1.2), KCl (4.72), NaCl (120), NaHCO3 (25), MgSO4 (0.5), CaCl2 (2.5) and dextrose (11). The Krebs solution was maintained at 37°C and gassed with 95% O2 and 5% CO2. Tissue was suspended under isotonic tension of 1 g and allowed to equilibrate for at least 1 hr while it was washed with Krebs solution every 15min (14).
Responses were measured by means of an isometric transducer (ADInstruments, spain) with a sensitivity range of 0 to 25 g, and amplified with an amplifier (Ml/118 quadribridge amp; March-Hugstetten, Germany) and recorded on a powerlab (ML-750, 4 channel recorder; March-Hugstetten, Germany).
Assessment of tracheal responsiveness to methacholine
In each experiment, a cumulative concentration response curve of methacholine induced contraction of the tracheal chain was obtained. Methacholine hydrochloride was purchased from Sigma Chemical Ltd., UK. Consecutive concentrations (containing 10−7 to 10−2 M, dissolved in saline) were added every 3 min. The contraction of each concentration was recorded at the end of 3 min and the effect reached a plateau in all experiments. The percentage of contraction of the tracheal smooth muscle due to each concentration of methacholine in proportion to the maximum contraction obtained by its final concentration was plotted against log concentration of methacholine. The concentration-response curve of methacholine was done in the tracheal chain of all animals of experimental groups. The effective concentration of methacholine causing 50% of maximum response (EC50) was measured from the methacholine response curve in each experiment using 50% of the maximum response in the Y axis and measuring the dose of methacholine causing this response in the X axis. The magnitude of contraction as the contractility response to 10 μM methacholine was also measured.
Measurement of tracheal response to ovalbumin (OA)
The tracheal response of all animals to a 0.1% solution of OA was measured in each studied animal as follows: 0.5 ml of 4% OA solution (dissolved in saline) was added to the 20ml organ bath and the degree of tracheal chain contraction was recorded after 15 min and was expressed as a proportion (in percentage) to the contraction obtained with 10 μM methacholine. The tracheal responsiveness to methacholin and ovalbumin were obtained in random order.
Lung lavage fluid and its white blood cell count
Coincident with preparing the tracheal chain, a cannula was put into the remaining trachea, and the lungs were lavaged with 5ml normal saline for 4 times (total: 20 ml). One ml of lung lavage fluid (LLF) was stained with Turk solution and counted in duplicate in a hemocytometer (in a Burker chamber). The Turk solution composed of 1 ml of gentiac violet solution 1%, 1ml of glacial acetic acid and 100 ml of distilled water.
The remaining LLF was centrifuged at 2500 × g at 4°C for 10 min. The supernatant was removed. The smear was prepared from the cells and stained with Wright-Giemsa. Differential cell analysis was performed under a light microscope, according to staining and morphological criteria, by counting 100 cells twice and the percentage of each cell type was calculated (15).
Statistical analysis
The data of tracheal response to methacholine (EC50), tracheal response to OA, tracheal contractility response, total WBC numbers and differential WBC counts were quoted as mean ± SEM. The data of six sensitized groups were compared with controls using one-way analysis of variance (ANOVA) with Tukey-Kramer post-test. In addition, the data of the sensitized group were compared with pretreated groups using one-way analysis of variance (ANOVA) with Tukey-Kramer post-test. Significance was accepted at P<0.05.
Results
Tracheal response to methacholine
Concentration-response curves to methacholine showed left ward shift of the curve in all groups compared to controls. All the groups except group S+Anta A2A, showed right ward shift in comparison with sensitized group. Concentration-response curve of S+TQ+Anta A2B group was adjacent to that of C group. The highest response was related to the group S+Anta A2A and the lowest response was related to the group S+TQ+Anta A2B (Figure 1).
Figure 1.
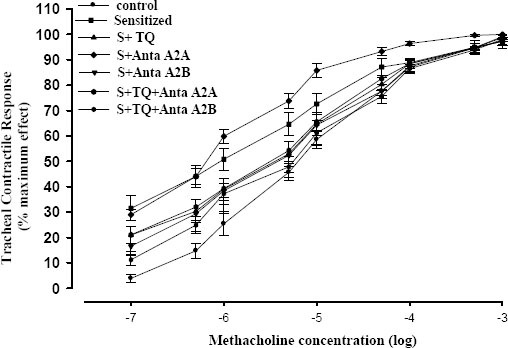
Cumulative log concentration-response curves of methacholine induced contraction of isolated trachea in control (C), sensitized (S), sensitized pretreated with thymoquinone (S+TQ), sensitized pretreated with selective A2A antagonist (ZM241385) and selective A2B antagonist (MRS1706) (S+Anta A2A and S+Anta A2B), sensitized groups pretreated with selective A2A antagonist and thymoquinone (S+Anta A2A+TQ) and selective A2B antagonist and thymoquinone (S+Anta A2B+TQ) guinea pig tracheal chains in the organ bath (for each group, n=7)
The mean value of EC50 in tracheal chains in all groups except S+TQ+Anta A2B group were significantly lower than in Group C (P<0.001 to P<0.05). The mean value of EC50 in tracheal chains in groups S+TQ and S+TQ+Anta A2B increased significantly in comparison with group S (P<0.05), whereas this parameter in S+Anta A2B and S+TQ+Anta A2A groups was non significantly higher than group S (Figure 2).
Figure 2.
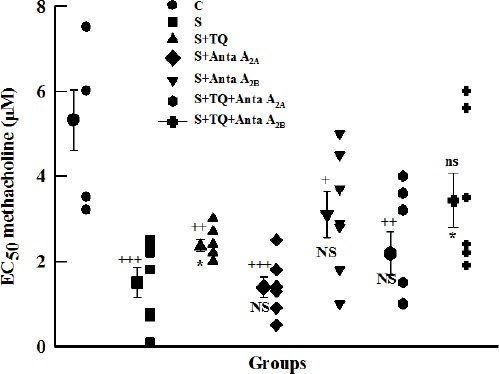
Individual values and mean±SEM (big symbols with bars) of tracheal response to methacholine (EC50) in control (C), sensitized (S), sensitized pretreated with thymoquinone (S+TQ), sensitized pretreated with selective A2A antagonist (ZM241385) and selective A2B antagonist (MRS1706) (S+Anta A2A and S+Anta A2B), sensitized groups pretreated with selective A2A antagonist and thymoquinone (S+Anta A2A+TQ) and selective A2B antagonist and thymoquinone (S+Anta A2B+TQ) (for each group, n=7). Statistical differences between control and different groups: ns: non significant differences, +; P<0.05, ++; P<0.01, +++; P<0.001. Statistical differences between pretreated groups vs sensitized group: NS: non significant differences, *: P<0.05
The contractility response of tracheal chains to methacholine was increased in all groups in comparison to group C (P<0.001 to P<0.05). Compared with S group, just pretreated group with selective A2B antagonist (S+Anta A2B group) showed significant decrease in this parameter (P<0.01, Figure 3).
Figure 3.
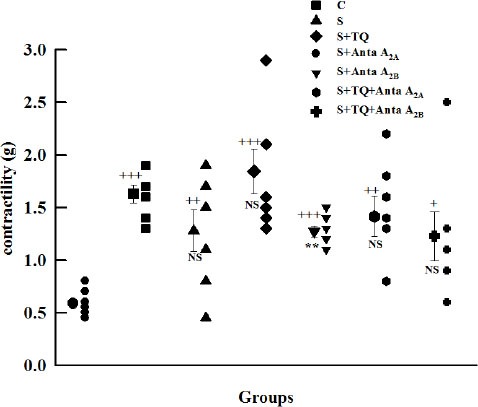
Individual values and mean±SEM (big symbols with bars) of tracheal contractility response to 10 μM methacholine in control (C), sensitized (S), sensitized pretreated with thymoquinone (S+TQ), sensitized pretreated with selective A2A antagonist (ZM241385) and selective A2B antagonist (MRS1706) (S+Anta A2A and S+Anta A2B), sensitized groups pretreated with selective A2A antagonist and thymoquinone (S+Anta A2A+TQ) and selective A2B antagonist and thymoquinone (S+Anta A2B+TQ) (for each group, n=7). Statistical differences between control and different groups: +; P<0.05, ++; P<0.01, +++; P<0.001. Statistical differences between pretreated groups vs sensitized group: NS: non significant differences, **; P<0.01
Tracheal responsiveness to ovalbumin
Tracheal response to OA in tracheal chains in all groups was increased significantly compared to group C (P<0.001 to P<0.05). Tracheal response to OA in groups S+TQ, S+TQ+Anta A2A, and S+TQ+Anta A2B was significantly decreased compared to group S (P<0.01); however, there was no significant difference in groups S+Anta A2B and S+Anta A2A in comparison with group S (Figure 4).
Figure 4.
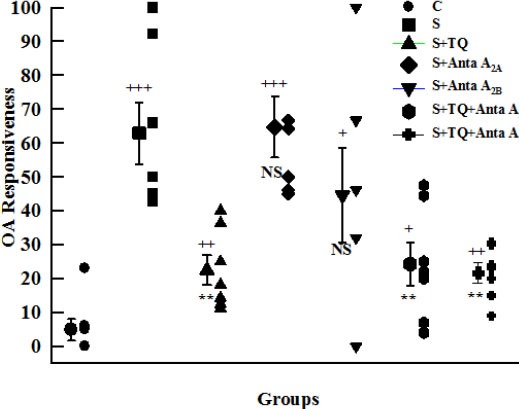
Individual values and mean±SEM (big symbols with bars) of tracheal response to ovalbumin (percent concentration in proportion to contraction obtained by 10 µM methacholine) in control (C), sensitized (S), sensitized pretreated with thymoquinone (S+TQ), sensitized pretreated with selective A2A antagonist (ZM241385) and selective A2B antagonist (MRS1706) (S+Anta A2A and S+Anta A2B), sensitized groups pretreated with selective A2A antagonist and thymoquinone (S+Anta A2A+TQ) and selective A2B antagonist and thymoquinone (S+Anta A2B+TQ) guinea pigs (for each group, n=7). Statistical differences between control and different groups: +; P<0.05, ++; P<0.01, +++; P<0.001. Statistical differences between pretreated groups vs sensitized group: NS: non significant differences, **: P<0.01
Total white blood cell count
The mean value of total white blood cell (WBC) in LLF in all groups increased significantly compared to group C (P<0.001 to P<0.01). However, the mean value of total WBC in all groups except S+Anta A2A decreased compared to group S, but this difference was significant only in pretreated group with thymoquinone and selective A2B antagonist (P<0.05, Figure 5).
Figure 5.
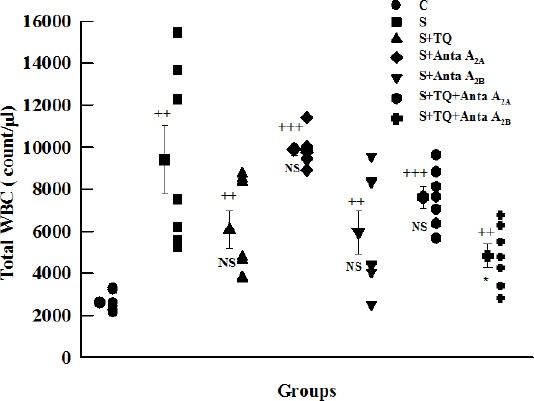
Individual values and mean±SEM (big symbols with bars) of total LLF WBC number in control (C), sensitized (S), sensitized pretreated with thymoquinone (S+TQ), sensitized pretreated with selective A2A antagonist (ZM241385) and selective A2B antagonist (MRS1706) (S+Anta A2A and S+Anta A2B), sensitized groups pretreated with selective A2A antagonist and thymoquinone (S+Anta A2A+TQ) and selective A2B antagonist and thymoquinone (S+Anta A2B+TQ) guinea pigs (for each group, n=6). Statistical differences between control and different groups: ++; P<0.01, +++; P<0.001. Statistical differences between pretreated groups vs sensitized group: NS: non significant differences, *; P<0.05
LLF differential WBC counts
There was a significant increase in LLF eosinophil and decrease in LLF lymphocyte count in all groups compared to C group (P<0.001 to P<0.05). There was also a significant decrease in LLF neutrophil in S, S+Anta A2A and S+TQ+Anta A2A groups in comparison with controls (P<0.001 to P<0.01). In addition, there was a significant decrease in LLF monocyte count in all group except S+A2B group compared to C group (P<0.001 to P<0.05).
In all groups (except S+Anta A2A group), there was a significant decrease in LLF eosinophil and increase in LLF neutrophil, lymphocyte and monocyte count compared to S group (P<0.001 to P<0.01). Significant decrease was observed in LLF basophil in S+TQ, S+Anta A2B and S+TQ+Anta A2A groups in comparison with sensitized animals (P<0.01 to P<0.05)(Figure 6a-e).
Figure 6.
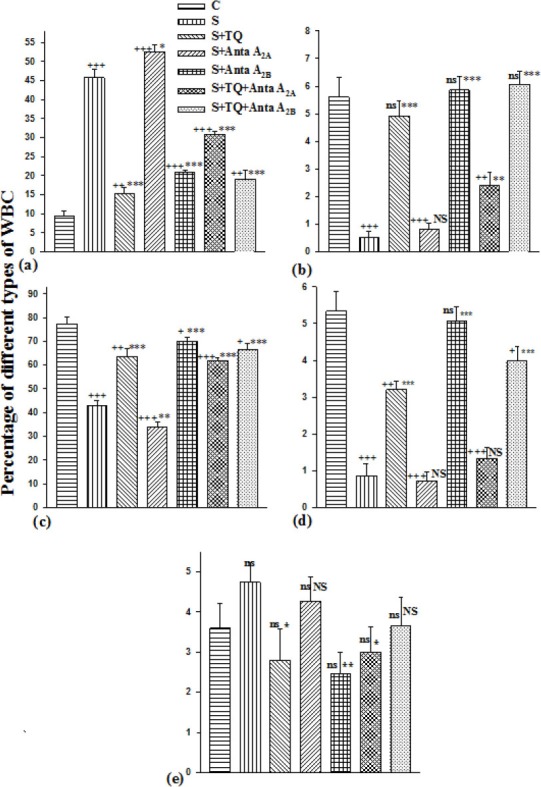
The percentages of eosinophil (a), neutrophil (b), lymphocyte (c), monocyte (d) and basophil (e) of lung lavage fluid in control, sensitized (S), sensitized pretreated with thymoquinone (S+TQ), sensitized pretreated with selective A2A antagonist (ZM241385) and selective A2B antagonist (MRS1706) (S+Anta A2A and S+Anta A2B), sensitized groups pretreated with selective A2A antagonist and thymoquinone (S+Anta A2A+TQ) and selective A2B antagonist and thymoquinone (S+Anta A2B+TQ) guinea pigs (for each group, n=15). Statistical differences between control and different groups: ns; non significant differences, +; P<0.05, ++; P<0.01, +++; P<0.001. Statistical differences between pretreated groups vs sensitized group: NS; non significant differences,*: P<0.05, **; P<0.01, ***: P<0.001
Differences between pretreated groups with S+TQ group
Pretreatment with Anta A2A caused significant decrease in the mean value of EC50 (P<0.01), and LLF neutrophil, lymphocyte and monocyte count (P<0.001 for all) and significant increase in the tracheal response to OA (P<0.01), LLF total WBC (P<0.01) and eosinophil count (P<0.001) compared to S+TQ group. There was significant increase in LLF eosinophil and monocyte counts in S+AntaA2B group compared with S+TQ group (P<0.001 for both, (Table 1).
Table 1.
The mean value of different parameters in control (C), sensitized (S), sensitized pretreated with thymoquinone (S+TQ), sensitized pretreated with selective A2A antagonist (ZM241385) and selective A2B antagonist (MRS1706) (S+Anta A2A and S+Anta A2B), sensitized groups pretreated with selective A2A antagonist and thymoquinone (S+Anta A2A+TQ) and selective A2B antagonist and thymoquinone (S+Anta A2B+TQ). Statistical differences between pretreated groups vs S+TQ group: NS: non significant differences, +; P<0.05, ++; P<0.01, +++; P<0.001
| The mean value of | C | S | S+TQ | S+Anta A2A | S+Anta A2B | S+Anta A2A+ TQ | S+Anta A2B+ TQ |
|---|---|---|---|---|---|---|---|
| EC50 | 5.31±0.71 | 1.50±0.36 | 2.35±0.14 | 1.38±0.24 | 3.10±0.54 | 2.18±0.51 | 3.43±0.64 |
| ++ | NS | NS | NS | ||||
| OA | 4.85±3.18 | 62.88±9.12 | 22.49±4.42 | 64.72±9.01 | 44.49±13.95 | 24.27±6.32 | 21.67±2.95 |
| ++ | NS | NS | NS | ||||
| Contractility | 0.58±0.04 | 1.63±0.08 | 1.28±0.19 | 1.84±0.21 | 1.27±0.05 | 1.41±0.19 | 1.23±0.23 |
| NS | NS | NS | NS | ||||
| LLF WBC | 2580±180.02 | 9421.43±1609.1 | 6073.14±879.86 | 9896.43±288.8 | 5950±1035.7 | 7923.57±523.79 | 4825.0±552.59 |
| ++ | Ns | Ns | Ns | ||||
| LLF eosinophil | 9.47±1.34 | 45.73±2.23 | 15.4±1.14 | 52.47±1.83 | 21±0.55 | 30.93±0.82 | 19.4±2.37 |
| +++ | +++ | +++ | Ns | ||||
| LLF monocyte | 5.33±0.53 | 0.86±0.32 | 3.20±0.24 | 0.73±0.25s | 5.06±0.38 | 1.33±0.28 | 4.0±0.36 |
| +++ | +++ | +++ | Ns | ||||
| LLF lymphocyte | 72.467.2±3.02 | 42.93±2.02 | 63.67±3.19 | 33.87±1.99 | 70.13±1.37 | 61.87±1.17 | 66.53±2.46 |
| +++ | Ns | Ns | Ns | ||||
| LLF neutrophil | 5.60±0.73 | 0.53±0.19 | 4.93±0.54 | 0.80±0.24 | 5.87±0.50 | 2.40±0.47 | 6.06±0.46 |
| +++ | Ns | ++ | Ns | ||||
| LLF basophil | 3.60±0.62 | 4.73±0.50 | 2.80±0.78 | 4.27±0.59 | 2.47±0.53 | 3.0±0.64 | 3.67±0.71 |
| Ns | Ns | Ns | Ns |
There were not any significant differences between parameters of pretreated groups with thymoquinone and antagonists with S+TQ group except there was significant increase in LLF eosinophil count (P<0.001) and significant decrease in LLF neutrophil and monocyte count (P<0.001 to P<0.01) in S+TQ+Anta A2A group compared to S+TQ group (Table 1).
Discussion
In this investigation, the effect of single dose of thymoquinone on tracheal responsiveness to methacholin and ovalbumin, and total and differential cell count in bronchoalveolar lavage of sensitized guinea pigs examined in the presence of selective A2A and A2B adenosine receptor antagonists (ZM241385 and MRS1706). The tracheal responsiveness to methacholine and OA, contractility response and LLF total WBC and eosinophil count seemed to be increased in this study, but LLF neutrophil, lymphocyte and monocyte count in sensitized group decreased compared to control animals which conformed to the results of previous studies (8, 13, 15-18).
In this study, intraperitoneal administration of thymoquinone decreased all the changes mentioned above. Anti-inflammatory and anti-asthmatic effects of thymoquinone have already been demonstrated in our previous studies (8, 17). Although in these studies, thymoquinone was administrated orally during 33 days, but in current study, single dose of thymoquinone was administrated intraperitoneally.
Pretreatment of sensitized animals with thymoquinone was more effective on bronchoalveolar lavage differential cell count. It shows that thymoquinone mainly affects the eosinophilic inflammation and immunological aspects of sensitized animals, which is similar to previous study (17). In addition, Hajhashemi in 2004 showed that the preventive effect of thymoquinone may be due to its ability to suppress airway inflammation(19).
In this study, single dose administration of selective adenosine A2A antagonist, and ZM241385, caused increased tracheal responsiveness (decreased EC50 and incremental contractility), tracheal response to OA and total WBC count and eosinophil and basophil number in LLF, and decrease in neutrophil, monocyte and lymphocyte count compared to controls. Exogenous and endogenous adenosine has essential role in the pathogenesis of asthma and other lung inflammatory disorders. This notion is based on the fact that adenosine receptors are present in many cell types involved in airway inflammation (20). It is now clear that the main mechanism responsible for exogenous adenosine inhalation-induced bronchoconstriction is mediators that release from mast cells; although there is some evidence for neural pathways activation (21). In addition to this effect, the level of adenosine increased in biological fluids of asthmatic patients, bronchoalveolar lavage and exhaled breath condensate (11).
The data strongly suggest that activation of adenosine A2A receptors, which are present in most of the inflammatory cells, affect multiple aspects of the inflammatory process including modulating neutrophils activation and degranulation, production of oxidative species, release of cytokines and mast cells degranulation, so adenosine A2A receptors’ activation can inhibit inflammatory responses (12, 22-24). In S+Anta A2A group, the changes were more than those of sensitized group. It showed that this A2A receptor antagonist deteriorated the effect of ovalbumin in inducing asthma in guinea pigs, which has been predicted because of the inhibitory effects of these receptors on multiple inflammatory cell types.
Administration of single dose of MRS1706 (selective A2B receptor antagonist) caused improvement in tracheal responsiveness, LLF total and differential WBC count, but it could not convey them to the control levels. These results are compatible with Mustafa and his colleagues study in 2007 (25).
Expression of adenosine A2B receptors has been found in bronchial epithelium, human mast cells, monocytes and fibroblasts and cultured human airway smooth muscle (2). Increasing evidences suggest that in rodents and man activation of adenosine A2B receptors modulates mast cells function and stimulates the production of IL-8, IL-4, IL-13 and VEGF from mast cells (26).
Adenosine, via A2B receptors participates in the remodeling process occurring in chronic inflammatory lung diseases (27). Taken together, these evidences suggest that adenosine A2B receptor is deeply involved in the mechanisms underlying mediators release by mast cells, the major mechanism of adenosine induced bronchoconstriction and airway inflammation in asthma. Therefore, it has been proved that targeting adenosine receptors might be a possible approach for the development of anti-inflammatory treatments in diseases characterized by chronic airway inflammation such as asthma and COPD. Currently, there is agreement that development of selective adenosine A2B receptor antagonists might be the most appealing approach (21, 28).
In this investigation, pretreatment with A2A receptor antagonist (ZM241385) increased tracheal responsiveness and caused LLF changes. Co-administration of thymoquinone and ZM241385 in group S+TQ+AntaA2A, prevented these variations in comparison with group S+Anta A2A. It seems that thymoquinone could decrease the negative effects of A2A receptor antagonist. Therefore, it can be concluded that thymoquinone could somehow recover the blockage of A2A receptors. However, it could not prevent completely in comparison to controls and S+TQ group. On the other hand, as co-administration of selective A2B antagonist (MRS1706) and thymoquinone improved the changes in comparison with S+TQ and S+Anta A2B groups specially the EC50 level and LLF neutrophil count. So, it can be concluded that a part of thymoquinone anti-asthmatic effect is due to controlling the adenosine receptors in trachea. However, more studies are required for the exact mechanism(s) causing the beneficial effects of thymoquinone in asthma.
Conclusion
These results showed that thymoquinone affects adenosine receptors which suggest that some of its anti-inflammatory effects may be mediated by these receptors.
Acknowledgment
This investigation was granted by Tuberculosis and Lung Research Center of Tabriz University of Medical Sciences as the part of the thesis of Miss Pejman, Msc student.
References
- 1.Keir S, Page C. The rabbit a model to study asthma and other lung diseases. Pulm Pharmacol Ther. 2008;21:721–730. doi: 10.1016/j.pupt.2008.01.005. [DOI] [PubMed] [Google Scholar]
- 2.Spicuzza L, Di Maria G, Polosa R. Adenosine in the airways: implications and applications. Eur J Pharm Biopharm. 2006;533:77–88. doi: 10.1016/j.ejphar.2005.12.056. [DOI] [PubMed] [Google Scholar]
- 3.Khan MA, Chen HC, Tania M, Zhang DZ. Anticancer activities of Nigella sativa (black cumin) Afr J Tradit Complement Altern Med. 2011;8:226–232. doi: 10.4314/ajtcam.v8i5S.10. [DOI] [PMC free article] [PubMed] [Google Scholar]
- 4.Mansour M, Tornhamre S. Inhibition of 5-lipoxygenase and leukotriene C4 synthase in human blood cells by thymoquinone. J Enzyme Inhib Med Chem. 2004;19:431–436. doi: 10.1080/14756360400002072. [DOI] [PubMed] [Google Scholar]
- 5.Keyhanmanesh R, Bagban H, Nazemiyeh H, Mirzaei Bavil F, Alipour MR, Ahmady M. The relaxant effects of different methanolic fractions of Nigella sativa on guinea pig tracheal chains. Iran J Basic Med Sci. 2013;16:123–128. [PMC free article] [PubMed] [Google Scholar]
- 6.Woo CC, Kumar AP, Sethi G, Tan KH. Thymoquinone: potential cure for inflammatory disorders and cancer. Biochem Pharmacol. 2012;83:443–451. doi: 10.1016/j.bcp.2011.09.029. [DOI] [PubMed] [Google Scholar]
- 7.Kalus U, Pruss A, Bystron J, Jurecka M, Smekalova A, Lichius JJ, et al. Effect of Nigella sativa (black seed) on subjective feeling in patients with allergic diseases. Phytother Res. 2003;17:1209–1214. doi: 10.1002/ptr.1356. [DOI] [PubMed] [Google Scholar]
- 8.Keyhanmanesh R, Boskabady MH, Khamneh S, Doostar Y. Effect of thymoquinone on the lung pathology and cytokine levels of ovalbumin-sensitized guinea pigs. Pharmacol Rep. 2010;62:910–916. doi: 10.1016/s1734-1140(10)70351-0. [DOI] [PubMed] [Google Scholar]
- 9.Ammar el SM, Gameil NM, Shawky NM, Nader MA. Comparative evaluation of anti-inflammatory properties of thymoquinone and curcumin using an asthmatic murine model. Int Immunopharmacol. 2011;11:2232–2236. doi: 10.1016/j.intimp.2011.10.013. [DOI] [PubMed] [Google Scholar]
- 10.Kornerup KN, Page CP, Moffatt JD. Pharmacological characterisation of the adenosine receptor mediating increased ion transport in the mouse isolated trachea and the effect of allergen challenge. Br J Pharmacol. 2005;144:1011–1016. doi: 10.1038/sj.bjp.0706133. [DOI] [PMC free article] [PubMed] [Google Scholar]
- 11.Huszar E, Vass G, Vizi E, Csoma Z, Barat E, Vilagos G M, et al. Adenosine in exhaled breath condensate in healthy volunteers and in patients with asthma. Eur Respir J. 2002;20:1393–1398. doi: 10.1183/09031936.02.00005002. [DOI] [PubMed] [Google Scholar]
- 12.Brown RA, Spina D, Page CP. Adenosine receptors and asthma. Br J Pharm. 2008;153:S446–S456. doi: 10.1038/bjp.2008.22. [DOI] [PMC free article] [PubMed] [Google Scholar]
- 13.Boskabady MH, Keyhanmansh R, Khamneh S, Doostar Y, Khakhzad MR. Potential immuno-modulation effect of the extract of Nigella sativa on ovalbumin sensitized guinea pigs. J Zhejiang Univ-Sci B. 2011;12:201–209. doi: 10.1631/jzus.B1000163. [DOI] [PMC free article] [PubMed] [Google Scholar]
- 14.Boskabady MH, Keyhanmanesh R, Ebrahimi Saadatlou MA. Relaxant effect of different fractions from Nigella sativa L. on guinea pig tracheal chains and its possible mechanism(s) Indian J Experimental Biology. 2008;46:805–810. [PubMed] [Google Scholar]
- 15.Boskabady MH, Keyhanmanesh R, Khamneh S, Ebrahimi Saadatlou MA. The effect of Nigella sativa extract on tracheal responsiveness and lung inflammation in ovalbumin sensitized guinea pigs. Clinics (Sao Paulo) 2011;66:879–887. doi: 10.1590/S1807-59322011000500027. [DOI] [PMC free article] [PubMed] [Google Scholar]
- 16.Boskabady MH, Kiani S, Jandaghi P. Antitussive effect of Nigella sativa. Pakistan J Med Sci. 2004;20:224–228. [Google Scholar]
- 17.Keyhanmanesh R, Boskabady MH, Eslamizadeh MJ, Khamneh S, Ebrahimi MA. The effect of thymoquinone, the main constituent of Nigella sativa on tracheal responsiveness and white blood cell count in lung lavage of sensitized guinea pigs. Planta Med. 2010;76:218–222. doi: 10.1055/s-0029-1186054. [DOI] [PubMed] [Google Scholar]
- 18.Anderson SE, Franko J, Kashon ML, Anderson KL, Hubbs AF, Lukomska E, et al. Exposure to triclosan augments the allergic response to ovalbumin in a mouse model of asthma. Toxicol Sci. 2013;132:96–106. doi: 10.1093/toxsci/kfs328. [DOI] [PMC free article] [PubMed] [Google Scholar]
- 19.Hajhashemi V, Ghannadi A, Jafarabadi H. Black cumin seed essential oil, as a potent analgesic and anti-inflammatory drug. Phytother Res. 2004;18:195–199. doi: 10.1002/ptr.1390. [DOI] [PubMed] [Google Scholar]
- 20.Spicuzza L, Bonfiglio C, Polosa R. Research applications and implications of adenosine in diseased airways. J Trends Pharmacol Sci. 2003;24:409–413. doi: 10.1016/S0165-6147(03)00193-7. [DOI] [PubMed] [Google Scholar]
- 21.Polosa R, Rorke S, Holgate ST. Evolving concepts on the value of adenosine hyperresponsiveness in asthma and chronic obstructive pulmonary disease. J Thorax. 2002;57:649–654. doi: 10.1136/thorax.57.7.649. [DOI] [PMC free article] [PubMed] [Google Scholar]
- 22.Lappas CM, Sullivan GW, Linden J. Adenosine A2A agonists in development for the treatment of inflammation. Expert Opin Investig Drugs. 2005;14:797–806. doi: 10.1517/13543784.14.7.797. [DOI] [PubMed] [Google Scholar]
- 23.Thiel M, Chouker A, Ohta A, Jackson E, Caldwell C, Smith P, et al. Oxygenation inhibits the physiological tissue-protecting mechanism and thereby exacerbates acute inflammatory lung injury. PLOS Biol. 2005;3:174. doi: 10.1371/journal.pbio.0030174. [DOI] [PMC free article] [PubMed] [Google Scholar]
- 24.Wilson CN, Mustafa SJ. Berlin: Springer; 2009. Adenosine receptors in health and disease (handbook of experimental pharmacology) p. 193. [PubMed] [Google Scholar]
- 25.Mustafa SJ, Nadeem A, Fan M, Zhong H, Belardinelli L, Zeng D. Effect of a specific and selective a2b adenosine receptor antagonist on adenosine agonist amp and allergen-induced airway responsiveness and cellular influx in a mouse model of asthma. J Pharm Exp Ther. 2007;320:1246–1251. doi: 10.1124/jpet.106.112250. [DOI] [PubMed] [Google Scholar]
- 26.Zhou Y, Mohsenin A, Morschl E, Young HW, Molina JG, Ma W, et al. Enhanced airway inflammation and remodeling in adenosine deaminase-deficient mice lacking the a2b adenosine receptor. J Immunol. 2009;182:8037–8046. doi: 10.4049/jimmunol.0900515. [DOI] [PMC free article] [PubMed] [Google Scholar]
- 27.Zhong H, Belardinelli L, Maa T, Zeng D. Synergy between A2B adenosine receptors and hypoxia in activating human lung fibroblasts. Am J Respir Cell Mol Biol. 2005;32:2–8. doi: 10.1165/rcmb.2004-0103OC. [DOI] [PubMed] [Google Scholar]
- 28.Holgate ST. The quintiles prize lecture 2004. The identification of the adenosine a2b receptor as a novel therapeutic target in asthma. Br J Pharmacol. 2005;145:1009–1015. doi: 10.1038/sj.bjp.0706272. [DOI] [PMC free article] [PubMed] [Google Scholar]


