Abstract
Objective(s):
This study was planned to appraise the protective effect of Nigella sativa fixed oil (NSO) against subchronic ethanol induced toxicity in rats.
Materials and Methods:
Studies were carried out on six groups of six animals each, including control (normal saline, gavage), ethanol (3 g/kg/day, gavage), NSO (0.125, 0.25 and 0.5 ml/Kg/day, IP) plus ethanol and NSO (0.5 ml/Kg/day, IP) groups. Treatments were continued for 4 weeks.
Results:
According to data, treatment with NSO attenuated ethanol-induced increased levels of malondialdehyde (MDA), tumor necrosis factor α (TNF-α) and interleukin-6 (IL-6), as well as histopathological changes in liver and kidney tissues. Moreover, NSO improved the level of serum liver enzymes (including alanine transaminase (ALT), aspartate transaminase (AST), alkaline phosphatase (ALP) and glutathione (GSH) content in liver and kidney tissues in ethanol-treated rats. Western blot analysis and quantitative real time RT-PCR showed that NSO treatment inhibited apoptosis stimulated by ethanol through decreasing the Bax/Bcl-2 ratio (both protein and mRNA levels), cleaved caspase-3, cleaved caspase-8 and cleaved caspase-9 level in liver and kidney.
Conclusion:
This study showed that NSO may have protective effects against hepatotoxicity and renal toxicity of ethanol by decreasing lipid peroxidation and inflammation and preventing apoptosis.
Keywords: Apoptosis, Ethanol toxicity, Lipid peroxidation, Nigella sativa, Oxidative stress, Alcohol
Introduction
Ethanol is derived from fermentation of sugars in fruits, cereals, and vegetables. Ethanol has played a historical role in the medical, social, and religious rituals of man-kind. Ethanol is commonly abused by humans, resulting in significant medical and social morbidity (1, 2). Acute and chronic toxicity of ethanol in different tissues have been shown in humans and animals. Chronic use of ethanol is associated with many medical disorders such as physical dependence and withdrawal and neuropsychiatric problems like Wernicke’s encephalopathy (3, 4).
Ethanol alters many aspects of endocrine function such as all levels of the hypothalamic-pituitary-adrenal axis, gonadal activity and carbohydrate, fat and mineral metabolism (5). Hepatic lipogenesis, peripheral fat mobilization, and hepatic uptake of circulating lipids are increased while hepatic lipoprotein release is decreased. The altered NADH/NAD+ ratio impede the function of the tricarboxylic acid cycle and slow fatty acid oxidation. These actions lead to the accumulation of triglycerides in hepatocytes (steatosis) and increase in serum triglycerides (6). Ethanol-associated liver disorders include fatty infiltration, alcoholic hepatitis, and fibrosis (cirrhosis) (7). Ethanol induced hepatotoxicity and nephrotoxicity are evidenced by histophatological damages as well as elevated levels of alanine transaminase (ALT), aspartate transaminase (AST) and alkaline phosphatase (ALP) in liver. Some studies indicated that MDA level was significantly increased while GSH content was significantly decreased in the liver and kidney of ethanol- treated rats (8, 9). The levels of inflammatory factors such as tumor necrosis factor α (TNF-α) and interleukin-6 (IL-6) were significantly increased by ethanol (8, 9). In addition, ethanol can induce the activity of cytochrome P450 (CYP) system that leads to increased conversion of xenobiotic compounds such as anesthetics and industrial solvents to toxic metabolites. This system also activates carcinogens that may contribute to the increased incidence of upper alimentary and respiratory tract cancers in alcoholics. Also, accumulation of acetaldehyde, as a metabolite of ethanol, is associated with impaired hepatic oxygen utilization, increased free radical production, lipid peroxidation, and fibrinogenesis (6).
It was shown that ethanol provokes toxic effects through the generation of reactive oxygen species (ROS) and lipid peroxidation in different tissues and cell types. In addition to oxidative stress, ethanol can provoke apoptosis in several cells through the induction of the mitochondrial pathway or death receptor signaling (8, 9). It was reported that oxidative stress and decreased antioxidant capacity of cells and tissues may be an important mediator of apoptotic cell death and this process can be suppressed by various antioxidants (10).
Antioxidants play an important role in preventing free radical mediated damages by directly scavenging them. Nigella sativa L., a member of the Ranunculaceae family, is found in countries bordering the Mediterranean Sea, Iran, Pakistan and India. For thousands of years N. sativa seeds (black seeds or black cumin) have been used for nutritional and medicinal purports in many countries (11). Some pharmacological effects have been attributed to the black cumin seed extracts and/or its oil, including antihistaminic (12-14), antihypertensive (15), analgesic and anti-inflammatory (16-18), hypoglycemic (19), antibacterial and antifungal (20, 21), anthelmintic (22), anticonvulsant (23, 24), antiischemia (25), antitumor (22, 26) and antioxidant activities (27).
The constituents and properties of N. sativa seeds have been investigated and the results of these studies have been reviewed (26, 28). N. sativa seeds contain 36%–38% fixed oils, proteins, alkaloids, saponin and 0.4%–2.5% essential oil. The fixed oil is composed mainly of unsaturated fatty acids. Although, many components of its essential oil were characterized but the major ones were thymoquinone (27.8%–57.0%), ρ-cymene (7.1%–15.5%), carvacrol (5.8%–11.6%), t-anethole (0.25%–2.3%), 4-terpineol (2.0%–6.6%) and longifoline (1.0%–8.0%). Thymoquinone readily dimerizes to form dithymoquinone (29). Most properties of whole seeds or their extracts are mainly attributed to quinone constituents, of which thymoquinone is more abundant (30, 31). Therefore, we designed the present experiments to evaluate the protective effect of No sativa fixed oil (NSO) against ethanol toxicity in rats.
Materials and Methods
Preparation of the NSO
N. sativa seeds were identified by Pharmacognosy Department, School of Pharmacy, Mashhad University of Medical Sciences, Mashhad, Iran. N. sativa seeds were powdered by mechanical grinder. The extract was obtained by cold shocking of powdered seeds in (3 × 1.5) liters of hexane thrice in 24 hours. Then, the solvent was removed from the extract under reduced pressure. The NSO analyzed by gas chromatography (GC) for identification of the volatile compounds. Briefly, 1 drop of NSO plus 2 ml methanolic potash (2 M) and 7 ml N-heptane were shaken in the 50°C water bath for 15 min then 1 μl of N-heptane phase injected to GC.
Chemicals
Ethanol, sodium dodecyl sulphate (SDS), MDA, thiobarbituric acid (TBA), N,N,N-,N-Tetramethylethylenediamine (TEMED), and β-mercaptoethanol (β-ME) were provided by Merck. phenylmethanesulfonyl fluoride (PMSF), complete protease inhibitor cocktail and reduced GSH were gained from Sigma-Aldrich. Rabbit monoclonal caspase-3 antibody, rabbit monoclonal caspase-8 antibody, rabbit monoclonal caspase-9 antibody, rabbit monoclonal Bcl-2 antibody, rabbit polyclonal Bax antibody, antirabbit IgG, horseradish peroxidase-conjugated antibody, mouse monoclonal β-actin antibody, anti-mouse IgG, and horseradish peroxidase-conjugated antibody were purchased from cell signaling. Polyvinylidene fluoride (PVDF) membrane and Bradford protein assay kit were obtained from Bio- Rad. BCA protein assay kit and Western blotting detecting reagents (ECL), was supplied by Pierce. TNF-α Rat ELISA Kit, IL-6 Rat ELISA Kit and Express one-step SYBR R Green ER™kit were provided from Invitrogen. Further chemicals were of the highest grade commercially available.
Animals and treatment
Adult male Wistar rats (weight 160–210 g) were obtained from Animal Center of School of Pharmacy, Mashhad University of Medical Sciences. Rats were maintained on a 12 hr light/dark cycle and at a temperature of 21±2°C with free access to food and water throughout the experimental period. All animal experiments were accomplished in accordance to Mashhad University of Medical Sciences, Ethical Committee Acts. The rats were divided into six groups of six animals each.
Group 1 (control group). The control group received normal saline, orally by gavage once a day, for 4 weeks.
Group 2 (ethanol-treated group). In this group, animals were treated with ethanol 3 g/kg per day in normal saline, orally by gavage once a day, for 4 weeks.
Groups 3, 4, and 5 (NSO + ethanol-treated groups). NSO was injected at doses of 0.125, 0.25 and 0.5 ml/kg per day, intraperitoneally to rats once a day, for 4 weeks.
Group 6 (NSO-treated group (NSO group)). In this group, rats received NSO (0.5 ml/kg per day, intraperitoneally) for 4 weeks.
At the end of the experiment period, after overnight fast, rats were killed by decapitation. Blood samples were immediately collected in dry tubes, allowed to clot, and centrifuged at 2000×g for 15 min to separate the sera that were kept at -70°C for biochemical analysis. The liver and kidney tissues were removed and washed in normal saline and then samples were taken and stored at -80°C for analysis.
Biochemical and specific biomarker evaluation Measurement of serum enzymes levels
Aspartate aminotransferase (AST), alanine aminotransferase (ALT) and alkaline phosphatase (ALP) were measured using commercial colorimetric kits.
Specific biomarker assessment
The biomarkers TNF-α and IL-6 were measured in the liver using Invitrogen Elisa kits according to the instructions of manufacturer.
Measurement of malondialdehyde (MDA) in the liver and kidney tissues
To measure MDA, an important marker of oxidative stress, the tissues were homogenized in ice-cold solution of 1.15% KCl to provide a 10% homogenate (w/v). These homogenates were centrifuged (Hettich, Germany) at 3000 g for 10 min to obtain supernatants. MDA levels were determined according to the method of Niehaus and Samuelsson (32). The level of MDA in the supernatant was determined spectrophotometrically by measuring thiobarbituric acid-reactive substances with a maximum absorbance at 532 nm. Concisely, 0.5 ml of the sample was mixed with 3 ml of 1% phosphoric acid and 1 ml of 0.6% TBA solution. The mixture was heated in a boiling water bath for 45 min and cooled to the room temperature. Then, 4 ml of n-butanol was increased, and mixture was vortexed and centrifuged at 3000 g for 10 min. The absorbance of butanol phase (supernatant) was measured at 532 nm. Tissue MDA content was expressed as nmol/g tissue.
Measurement of reduced glutathione (GSH) content in the liver and kidney tissues
GSH content was measured according to the method of Moron et al (33). The tissues were homogenized in ice cold phosphate buffered saline (PBS), pH 7.4, to obtain 10% homogenate (w/v). Homogenates were centrifuged at 3000 g for 10 min. GSH content was determined in supernatants. Reduced GSH contents were assessed using 5,5´-dithiobis(2-nitrobenzoic acid) (DTNB) which produced a yellow-colored 5-thio-2-nitrobenzoic acid (TNB). Briefly, equal amounts of samples and 10% trichloroacetic acid (TCA) were mixed and centrifuged at 3000 g for 5 min. 0.5 ml of 0.04% DTNB reagent was added to 0.5 ml of supernatants plus 2 ml PBS (0.1 M, pH 8.0). Then, the absorbance of yellow colored TNB was measured at 412 nm. Tissue GSH contents were expressed as nmol/g tissue.
Histopathological study
The tissues (liver and kidney) were fixed in 10% buffered formalin for at least 24 hr and then were processed for microscopical assay by a standard protocol. The paraffin sections of about 5 μm were stained with hematoxylin and eosin. Histopathological criteria such as severe congestion were determined semiquantitatively as mild (+), moderate (++) and severe (+++).
Western blot analysis
Western blot analysis was carried out on protein extracts from the liver and kidney tissues for Bax, Bcl2, caspase-3, caspase-8 and caspase-9. Tissues were homogenized in the homogenization buffer containing 50 mM Tris pH 7.4, 2 mM EDTA, 10 mM NaF, 1 mM Na3VO4, 10 mM b-glycerol phosphate, 0.2% W/V sodium deoxycholate, 1 mM phenylmethylsulfonyl fluoride (PMSF), and complete protease inhibitor cocktail (Sigma, P8340) using polytron homogenizer (POLYTRON_ PT 10–35, Kinematica, Switzerland) in ice and then were centrifuged at 4°C for 15 min at 10,000 g. Supernatants were frozen at -80°C until further use. The total protein content was determined using Bradford protein assay kit (Bio-Rad). Levels of Bax, Bcl2, caspase-3, caspase-8, caspase-9 and β-actin were measured by immune blotting analysis. Briefly, equal amounts of protein extracts (50 μg) were loaded to SDS–PAGE gel. Next electrophoresis, proteins were transferred to PVDF membrane. Membranes were blocked with 5% non-fat dry milk in Tris-buffered saline tween for 3 hr. The primary antibodies were rabbit monoclonal anti-serum against Bcl2 (Cell Signaling, #2870), rabbit monoclonal anti-serum against caspase-3 (Cell Signaling, #9665), rabbit monoclonal anti-serum against caspase-8 (Cell Signaling, #4790), rabbit monoclonal anti-serum against caspase-9 (Cell Signaling, #9506) and rabbit polyclonal anti-serum against Bax (Cell Signaling, #2772) and mouse monoclonal anti serum against β-actin (Cell Signaling, # 3700). All antibodies were used at a dilution of 1:1000. Anti rabbit IgG labeled with horseradish peroxidase (Cell Signaling, #7074) and anti mouse IgG labeled with horseradish peroxidase (Cell Signaling, #7076) were used as secondary antibodies. Protein bands were figured using an increased chemiluminescence (Pierce ECL Western blotting substrate) and Alliance gel doc. (Alliance 4.7 Gel doc, UK). UV tec software (UK) was used to semi quantify protein bands. All protein bands were normalized against β-actin protein.
Isolation of RNA and real-time PCR
Total RNAs were isolated from different samples using high pure RNA tissue kit (Roche, # 12033674001) according to the manufacturer instruction in the liver and kidney tissues. Quality (260/280 and 260/230 ratios) and quantity of isolated RNAs were determined using Nanodrop (NanoDrop™ 2000, USA) and samples were stored at -80°C until use. To measure transcript levels, step one thermal cycler (ABI) and express one-step SYBR R Green ER™kit (Invitrogen, #11780–200) were used. Primers for Bax, Bcl2 and β-actin were chosen according to previous study [36] and/or were designed using Beacon Design® software (BioSoft) (Table 1). Melting curve analysis was performed to analyze quality of primers and products. Expression of target genes was normalized against β-actin. ∆∆CT method was used to measure fold increase of genes in compare to control group.
Table 1.
Sequences of primers used for real-time PCR reactions
| Gene | Primer | Sequence |
|---|---|---|
| Bcl-2 | Forward | 5’-GGTGGAGGAACTCTTCAGGGA-3’ |
| Reversed | 5’- GGTTCAGGTACTCAGTCATCCA-3’ | |
| Bax | Forward | 5’-TGCTGATGGCAACTTCAACT-3’ |
| Reversed | 5’-ATGATGGTTCTGATCAGCTCG-3’ | |
| β-actin | Forward | 5’- GGGAAATCGTGCGTGACATT-3’ |
| Reversed | 5’- GCGGCAGTGGCCATCTC-3’ |
Statistical analysis
All results are expressed as mean ± SEM. ANOVA followed by Tukey–Kramer test were performed to contrast means. P- values less than 0.05 were considered significant.
Results
GC analysis of NSO
The NSO analyzed by GC for identification of the volatile compounds. Six major compounds were identified (Table 2).
Table 2.
GC analysis of Nigella sativa fixed oil
| Fatty acid | Percentage |
|---|---|
| Palmitic (C 16:0) | 13% |
| Stearic (C 18:0) | 3% |
| Oleic (C 18:1) | 23% |
| Linoleic (C 18:2) | 57% |
| Arachidic (C 20:0) | 0.3% |
| Eicosanoic (C 20:1) | 3% |
Biochemical and specific biomarker evaluation Measurement of serum enzymes levels
AST, ALT and ALP were increased significantly in the ethanol-treated group when compared to the control group. NSO prevented this effect of ethanol on AST, ALT and ALP levels (Figure 1).
Figure 1.
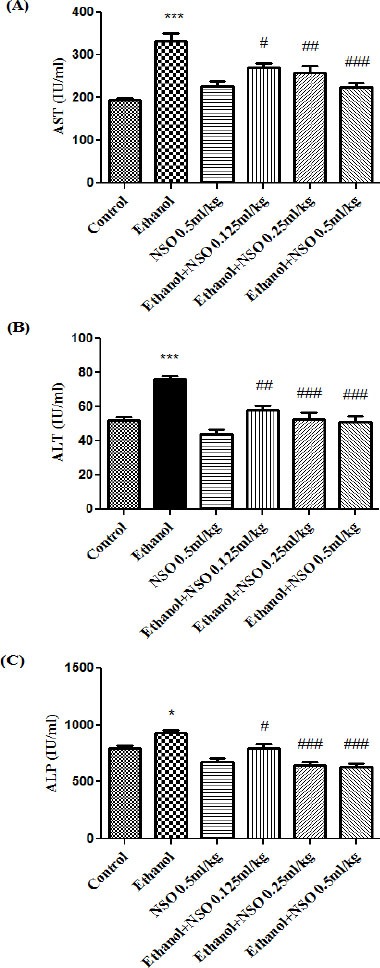
Effects of ethanol and Nigella sativa fixed oil (NSO) treatment (4 weeks) on serum levels of AST (A), ALT (B) and ALP (C) in rats. NSO was administered intraperitoneally, once a day. Ethanol was administered via gavage to rats once a day. Data showed as mean ± SEM, *Comparison with control, #Comparison with ethanol-treated group. * or # P<0.05, ##P<0.01 and *** or ### P<0.001, Tukey-Kramer test, n=6
Specific biomarker evaluation
The levels of liver IL-6 and TNF-α were increased significantly in the ethanol-treated group compared with the control group (P<0.001 and P<0.05, respectively). The augmentation of IL-6 level by ethanol was significantly decreased by NSO (0.5 ml/kg) (Figure 2). The level of TNF-α in liver showed no significant changes in group 5 (0.5 ml/kg) compared to ethanol treated rats (Figure 2).
Figure 2.
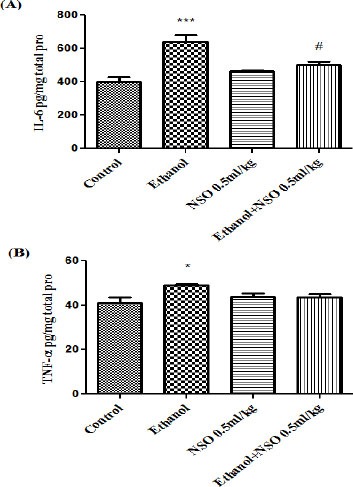
Effects of ethanol and Nigella sativa fixed oil (NSO) treatment (4 weeks) on IL-6 (A) and TNF-α (B) levels in the liver. NSO was administered intraperitoneally, once a day. Ethanol was administered via gavage to rats once a day. Data showed as mean ± SEM, *Comparison with control, #Comparison with ethanol-treated group. * or #P<0.05 and *** P<0.001, Tukey-Kramer test, n=6
Measurement of MDA and GSH content
Data showed that MDA level was significantly increased while GSH content was significantly decreased in the liver and kidney of ethanol-treated rats (P<0.001). MDA levels were significantly decreased in NSO plus ethanol (groups 3, 4 and 5) in the liver (P<0.001) (Figure 3A) and NSO plus ethanol (groups 3, 4 and 5) in the kidney (P<0.01 and P<0.001, respectively) (Figure 3B) as compared with ethanol group. NSO plus ethanol also significantly increased the content of GSH compared to ethanol treated rats (group 2) in the liver (Figure 4A) and kidney (Figure 4B) (P<0.001).
Figure 3.
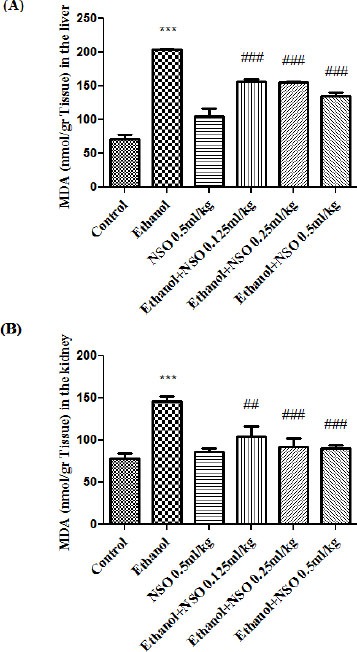
Effects of ethanol and NSO treatment (4 weeks) on MDA level in the liver (A) and kidney (B) in rats. NSO was administered intraperitoneally, once a day. Ethanol was administered via gavage to rats once a day. Data showed as mean ± SEM, *Comparison with control, #Comparison with ethanol-treated group. ##P<0.01 and *** or ### P<0.001, Tukey-Kramer test, n=6
Figure 4.
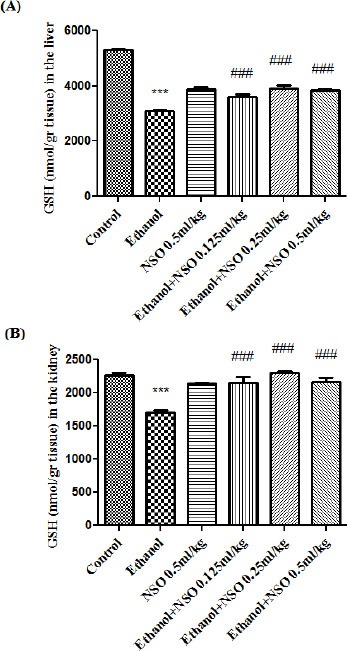
Effects of ethanol and NSO treatment (4 weeks) on GSH content in the liver (A) and kidney (B) in rats. NSO was administered intraperitoneally, once a day. Ethanol was administered via gavage to rats once a day. Data showed as mean ± SEM, *Comparison with control, #Comparison with ethanol-treated group. *** or ### P<0.001, Tukey-Kramer test, n=6
Histopathological findings
Histopathological changes of liver and kidney tissues are presented in Table 3, Figure 5 and Figure 6. All histological findings were normal in the control group and NSO alone (group 6) in the liver (Figure 5A, 5G) and kidney (Figure 6A and 6G). Histological changes were observed in ethanol treated group in the liver and kidney tissues. Ethanol induced liver damage included severe congestion (+++), steatosis (++) and infiltration of inflammatory focal portal space (++) (Table 3 and Figure 5B, 5C). The liver lesions were improved in all ethanol plus NSO groups compared to ethanol-treated group (Table 3 and Figure 5D, 5E, 5F).
Table 3.
Effect of NSO and ethanol on histopathological changes in liver and kidney tissues of rat after 4 weeks treatment. Histopathological criteria were determined semiquantitatively from mild (+) to moderate (++) and sever (+++), n=6
| Groups | Liver | Kidney |
|---|---|---|
| Control | Normal | Normal |
| Ethanol | Severe congestion (+++), steatosis (++) and infiltration of inflammatory focal portal space (++) | Severe congestion (+++), hematuria (++) and infiltration of inflammatory focal adjacent glomerular (++) |
| NSO (0.5 ml/kg) | Normal | normal |
| Et + NSO (0.125 ml/kg) | Moderate congestion (++) | Mild congestion (+) |
| Et + NSO (0.25 ml/kg) | Mild congestion (+) | Mild congestion (+) |
| Et + NSO (0.5 ml/kg) | Normal | Normal |
Figure 5.
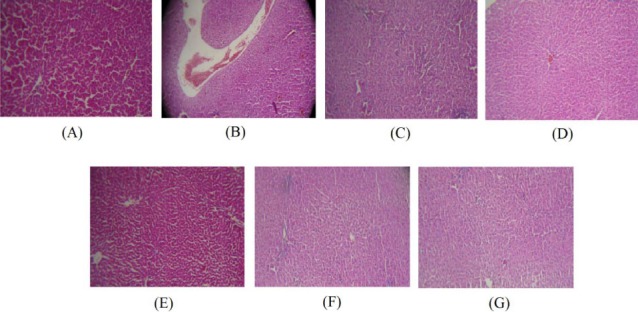
(A) Normal liver of control rats. Hematoxylin and eosin, ×100. (B) Ethanol treated rats show severe congestion. Hematoxylin and eosin, ×100. (C) Ethanol treated rats show steatosis and infiltration of inflammatory focal portal space. Hematoxylin and eosin, ×100. (D) Liver sections of rats received NSO 0.125 ml/kg plus ethanol showing moderate congestion. Hematoxylin and eosin, ×100. (E) Mild congestion was observed in rats received NSO 0.25 ml/kg plus ethanol. Hematoxylin and eosin, ×100. (F and G) Liver tissues of rats received NSO 0.5 ml/kg plus ethanol and NSO alone at dose 0.5 ml/kg were normal. Hematoxylin and eosin, ×100
Figure 6.
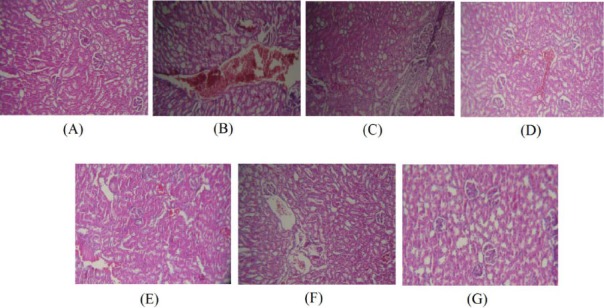
(A) Normal kidney of control rats. Hematoxylin and eosin, ×100. (B) Ethanol treated rats show severe congestion. Hematoxylin and eosin, ×100. (C) Ethanol treated rats show hematuria and infiltration of inflammatory focal adjacent glomerular. Hematoxylin and eosin, ×100. (D) Kidney sections of rats received NSO 0.125 ml/kg plus ethanol showing mild congestion. Hematoxylin and eosin, ×100. (E) Mild congestion was observed in rats received NSO 0.25 ml/kg plus ethanol. Hematoxylin and eosin, ×100. (F and G) Kidney tissues of rats received NSO 0.5 ml/kg plus ethanol and NSO alone at dose 0.5 ml/kg were normal. Hematoxylin and eosin, ×100
Also ethanol induced kidney damage included severe congestion (+++), hematuria (++) and infiltration of inflammatory focal adjacent glomerular (++) (Table 3 and Figure 6B and 6C). The kidney lesions were improved in all ethanol plus NSO groups compared to ethanol-treated group (Table 3 and Figure 6D, 6E and 6F).
Western blot analysis for apoptotic proteins (Bax, Bcl-2, caspase-3, caspase-8 and caspase-9)
Western blot analysis showed that protein expression of Bax/Bcl2 was up-regulated in ethanol group in the liver and kidney (P<0.001 and P<0.01, respectively) (Figures 7 and 8). Also protein level of caspase-3, caspase-8 and caspase-9 were up-regulated by ethanol in the liver (Figures 9, 11 and 13) and kidney (Figures 10, 12 and 14) tissues. Co-treatment of ethanol with NSO (0.5 ml/kg) significantly decreased the ratio of Bax/Bcl2 in liver and kidney (P<0.001 and P<0.05, respectively) (Figures 7 and 8). Furthermore, NSO (0.5 ml/kg) inhibited the ethanol-induced activation of caspase-3 (19 KDa) and attenuated the protein level of cleaved caspase-3 (17 KDa) in the liver and kidney (P<0.01 and P<0.001, respectively) (Figure 9 and 10). Administration of NSO to animals significantly decreased the liver and kidney ratio of cleaved caspase-8 (P<0.001) (Figures 11 and 12) and the liver ratio of cleaved caspase-9 (P<0.01) (Figure 13). Administration of ethanol with NSO indicated no significant change in the level of cleaved caspase-9 compared to the ethanol group in the kidney tissue (P>0.05) (Figure 14).
Figure 7.
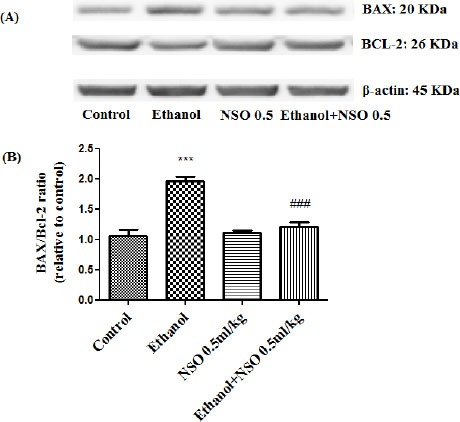
Effect of NSO (0.5 ml/kg) and ethanol on the protein levels of Bax and Bcl2 in the rat liver tissue. (A) Representative Western blots showing specific bands for Bax, Bcl2 and β-actin as an internal control. Equal amounts of protein sample (50 μg) obtained from whole liver homogenate were applied in each lane. (B) Densitometric data of protein analysis. Data are expressed as the mean ± SEM. ***P<0.001 vs control group, ###P<0.001 vs ethanol group
Figure 8.
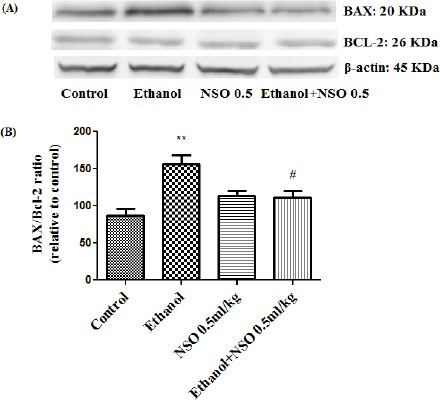
Effect of NSO (0.5 ml/kg) and ethanol on the protein levels of Bax and Bcl2 in the rat kidney tissue. (A) Representative Western blots showing specific bands for Bax, Bcl2 and β-actin as an internal control. Equal amounts of protein sample (50 μg) obtained from whole kidney homogenate were applied in each lane. (B) Densitometric data of protein analysis. Data are expressed as the mean ± SEM. **P<0.01 vs control group, #P<0.05 vs ethanol group
Figure 9.
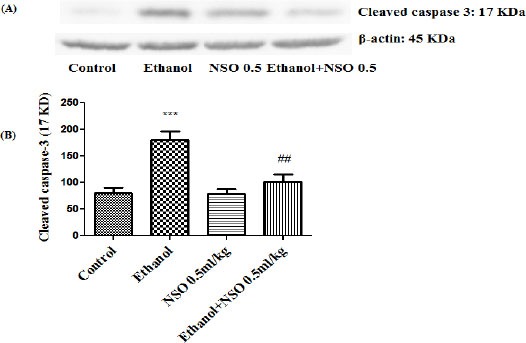
Effect of NSO (0.5 ml/kg) and ethanol on the protein level of caspase-3 (cleaved caspase-3) in the rat liver tissue. (A) Representative Western blots showing specific bands for cleaved caspase-3 (17 KDa) and β-actin as an internal control. Equal amounts of protein sample (50 μg) obtained from whole liver homogenate were applied in each lane. (B) Densitometric data of protein analysis. Data are expressed as the mean ± SEM. ***P<0.001 vs control group, ##P<0.01 vs ethanol group
Figure 11.
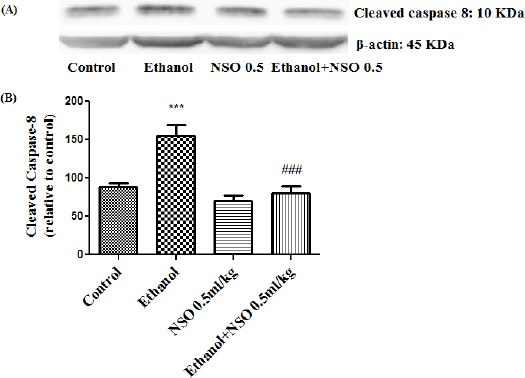
Effect of NSO (0.5 ml/kg) and ethanol on the protein level of caspase 8 (cleaved caspase 8) in the rat liver tissue. (A) Representative Western blots showing specific bands for cleaved caspase 8 (10 KDa) and β-actin as an internal control. Equal amounts of protein sample (50 μg) obtained from whole liver homogenate were applied in each lane. (B) Densitometric data of protein analysis. Data are expressed as the mean ± SEM. ***P<0.001 vs control group, ###P<0.001 vs ethanol group
Figure 13.
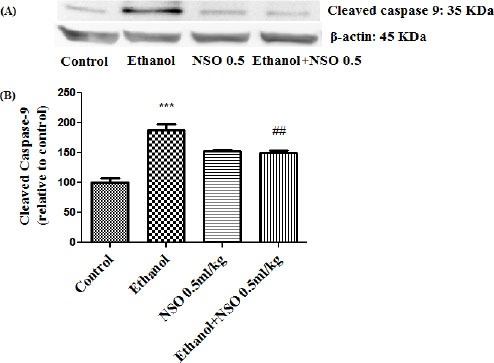
Effect of NSO (0.5 ml/kg) and ethanol on the protein level of caspase-9 (cleaved caspase-9) in the rat liver tissue. (A) Representative Western blots showing specific bands for cleaved caspase-9 (35 KDa) and β-actin as an internal control. Equal amounts of protein sample (50 μg) obtained from whole liver homogenate were applied in each lane. (B) Densitometric data of protein analysis. Data are expressed as the mean ± SEM. ***P<0.001 vs control group, ##P<0.01 vs ethanol group
Figure 10.
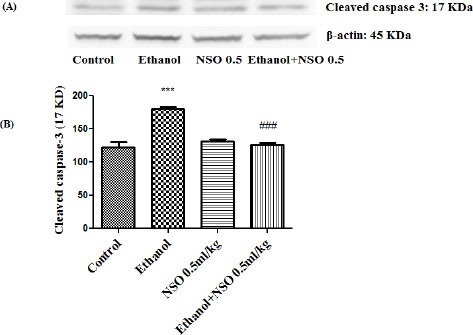
Effect of NSO (0.5 ml/kg) and ethanol on the protein level of caspase-3 (cleaved caspase-3) in the rat kidney tissue. (A) Representative Western blots showing specific bands for cleaved caspase-3 (17 KDa) and β-actin as an internal control. Equal amounts of protein sample (50 μg) obtained from whole kidney homogenate were applied in each lane. (B) Densitometric data of protein analysis. Data are expressed as the mean ± SEM. ***P<0.001 vs control group, ###P<0.001 vs ethanol group
Figure 12.
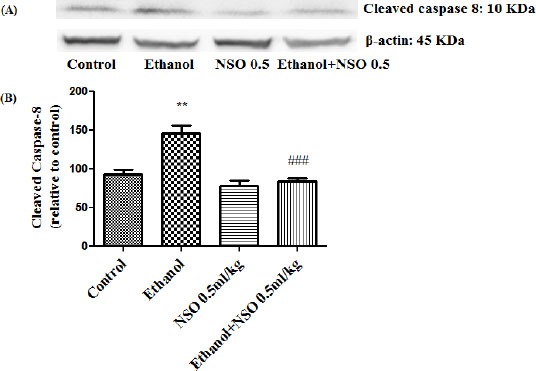
Effect of NSO (0.5 ml/kg) and ethanol on the protein level of caspase-8 (cleaved caspase-8) in the rat kidney tissue. (A) Representative Western blots showing specific bands for cleaved caspase-8 (10 KDa) and β-actin as an internal control. Equal amounts of protein sample (50 μg) obtained from whole kidney homogenate were applied in each lane. (B) Densitometric data of protein analysis. Data are expressed as the mean ± SEM. **P<0.01 vs control group, ###P<0.001 vs ethanol group
Figure 14.
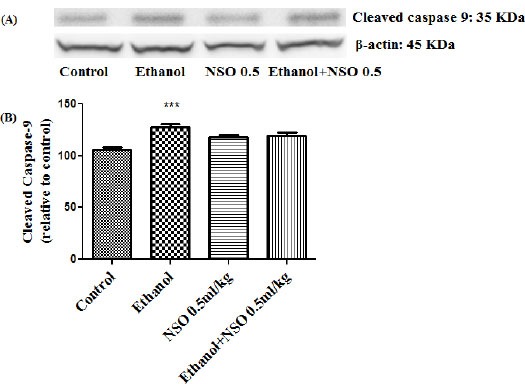
Effect of NSO (0.5 ml/kg) and ethanol on the protein level of caspase-9 (cleaved caspase-9) in the rat kidney tissue. (A) Representative Western blots showing specific bands for cleaved caspase-9 (35 KDa) and β-actin as an internal control. Equal amounts of protein sample (50 μg) obtained from whole kidney homogenate were applied in each lane. (B) Densitometric data of protein analysis. Data are expressed as the mean ± SEM. ***P<0.001 vs control group
Measurement of mRNA expression of Bax/Bcl2 ratio in the liver and kidney tissues
The results showed that ethanol can induce induction of Bax/Bcl2 mRNA expression ratio in the liver and kidney (1.5 and 1.45-fold, respectively). Bax/Bcl2 mRNA expression ratio was down- regulated in concurrent administration of ethanol and NSO (0.5 ml/kg) in the liver (Figure 15) (P<0.01). The ratio of Bax/Bcl2 mRNA expression in kidney showed no significant changes in group 5 compared to group 2.
Discussion
N. sativa L. sometimes known as black seed or black cumin has long been used in the Middle East as a traditional medicine for a variety of illnesses: cough, headache, flatulence, as a choleretic, antispasmodic and uricosuric (11). Antioxidant and anti apoptotic effects of N. sativa have been reported in several studies (e.g. 22).
Ethanol is a dietary component which is usually consumed for its psychophysical and mood-altering effects. Long-term alcohol consumption may cause damage to vital organs including liver and cardiovascular, endocrine, gastrointestinal, and central nervous systems (1, 2). Ethanol provokes its toxic effects through the generation of reactive oxygen species (ROS) and lipid peroxidation in many tissues and cell types (8, 9). In addition to oxidative stress, ethanol can induce apoptosis in different cells and tissues (8, 9).
Oxidative stress induces lipid peroxidation, due to the interaction between free radicals of diverse origin and cell membrane unsaturated fatty acids. This situation leads to addition of several toxic products and malondialdehyde (MDA). The level of MDA is considered to be an appropriate indicator of lipid peroxidation (34). The content of reduced GSH is a marker of oxidative damage in tissues. GSH as a free radicals scavenger can protect liver and kidney from oxidative stress (35). Data indicated that the level of MDA was significantly increased and the content of GSH was significantly decreased following ethanol administration in the liver and kidney tissues (Figure 3, 4). It has been shown that subchronic exposure to ethanol induces oxidative stress damages due to free radicals production and lipid peroxidation in different tissues such as liver and kidney (6). These results are in agreement with other studies demonstrated that ethanol significantly increases MDA and decreases reduced GSH in some tissues of rats (9, 36-39).
The histopathological findings indicated that ethanol subchronic exposure could induce severe congestion of central vein, steatosis and infiltration of inflammatory focal portal space in the liver and also could induce severe congestion, hematuria and infiltration of inflammatory focal adjacent glomerular in the kidney. It has been reported that ethanol increased inflammatory cells infiltration, fatty changes, accumulation of collagenous fibers, and necrotic damage (8, 9).
Serum enzymes including AST, ALT and ALP are mainly monitored for the evaluation of liver damage. Although these enzymes are not necessarily specific, increase in enzyme activities reflects active liver destruction. It is reported that ethanol may cause increase in AST, ALT and ALP activities (8, 9). These alterations in enzyme levels may depend on exposure time and doses. In our study, ethanol caused a significant increment in AST, ALT and ALP activities in rats. These results suggest that increased serum enzyme activities are associated with hepatic degeneration and it is likely that ethanol induced biochemical changes in liver (40). IL-6, a pleiotropic cytokine, plays key roles in regulating and sustaining the immune system, linking innate and adaptive immunity, modulating cell growth and differentiation. There are numerous cellular sources of IL-6 including stimulated T cells, B cells, monocytes, macrophages/monocytes, endothelial cells, fibroblasts, keratinocytes, granulocytes, skeletal and smooth muscle cells, eosinophils, mast cells, and osteoblasts. IL-6, along with the cytokines IL-1 and TNF-α, stimulates the acute phase response, then in this phase, inflammatory cells such as neutrophils and macrophages secrete these pro-inflammatory cytokines from localized sites of injury into the blood flow. Cytokines activate the production of acute phase proteins by the liver. Studies with IL-6 knockout mice underscore the importance of IL-6 on the development of the immune system. These mice have reduced number of thymocytes and peripheral T cells. TNF-α is a central regulator of inflammation. TNF-α antagonists may be operative in treating inflammatory disorders in which TNF-α plays an important pathogenic role (41). In our study, ethanol increased IL-6 and TNF- α levels after 4 weeks in comparison with the control group in the liver tissue. These findings were in agreement with other studies demonstrated that ethanol significantly increased TNF- α and IL-6 levels in some tissues of rats (8, 9).
According to the data, exposure to ethanol may result in peroxidation of polyunsaturated fatty acids, causing to the degradation of phospholipids and finally cellular damages which was shown in this study as an increase in liver and kidney biomarker and histological damages. Our results supported the hypothesis that oxidative stress and free radicals play an important role in ethanol hepatotoxicity and renal toxicity (36, 42).
NSO have a noticeable antioxidant activity (27). The protective effect of N. sativa oil and its major component, thymoquinone against oxidative damages and alteration of biochemical indices and specific biomarker (TNF-α) has been shown in several studies (43-46).
The results of the present study showed that concurrent administration of NSO and ethanol decreased the MDA and increased GSH content in the liver and kidney tissues of rats. Furthermore, the protective effect of NSO against ethanol-induced hepatotoxicity demonstrated by the significant reduction of serum AST, ALT and ALP as well as significant decrease in IL-6 in liver tissue. Also, NSO may protect the liver and kidney from histological damages induced by ethanol through anti-oxidative (27) and anti-inflammatory effects (16, 17). So, in this study the protective effect of NSO could be attributed to the inhibition of lipid peroxidation which leads to stabilizing plasma membranes and preventing the release of hepatic enzymes.
Evidence suggests that a principal apoptotic stimulus in different diseases is oxidative stress (47, 48). Several studies revealed that apoptosis could be a possible mechanism of toxicity in exposure to ethanol (36).
According to the results, lipid peroxidation could be considered as a mechanism of ethanol hepatotoxicity and renal toxicity. Therefore, to understand whether subchronic exposure to ethanol can induce apoptosis in liver and kidney tissues, some key factors involved in apoptotic pathway were evaluated in this study.
The intrinsic (mitochondrial) and extrinsic (death receptor) pathways are two main apoptotic processes in biological systems (49). The proteins of Bcl-2 family are involved in the regulation of the intrinsic apoptotic pathway (50). Bax is a pro-apoptotic protein and Bcl2 possesses anti apoptotic properties through stabilizing mitochondrial membrane and suppressing the release of cytochrome c. The balance between these proteins is important in the progression of apoptosis (51).
In this study, ethanol increased the ratio of Bax/Bcl2 in both mRNA and protein levels in liver and kidney tissues (Figure 7, 8 and 15). This increase in Bax/Bcl-2 ratio by ethanol could be considered as a predictor of ethanol induced apoptosis in liver and kidney tissues.
Figure 15.
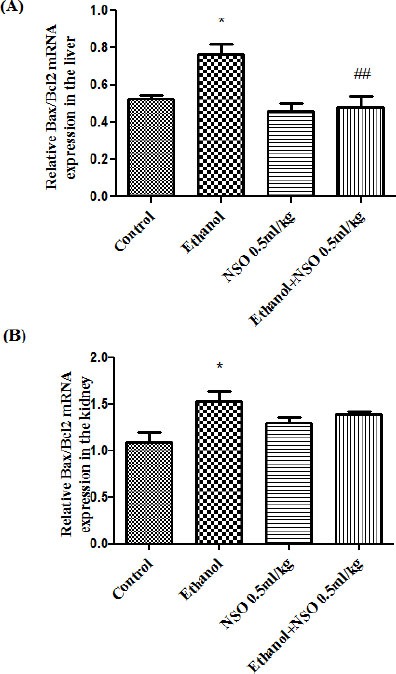
The effect of ethanol and NSO on Bax/Bcl2 mRNA expression in the rat liver (A) and kidney (B) tissues after 4 weeks treatment by real time PCR. The transcript level of each sample was normalized against b-actin transcript level. Data are expressed as the mean ± SEM. *P<0.05 vs. control and ##P<0.01vs ethanol group
To evaluate the induction of apoptosis by ethanol, the activation of caspase-3, caspase-8 and caspase-9 were also assessed.
According to the results, ethanol activated caspase-3 and raised the level of cleaved caspase-3. Also, ethanol activated caspase-9 and increased the level of cleaved caspase-9 in the liver and kidney tissues. It has been proved that mitochondria plays an important role in apoptosis by releasing of cytochrome c into the cytosol. In the cytosol, cytochrome c activated caspase-9 and then caspase-9 directly cleaved and activated caspase-3 (52). Furthermore, ethanol activated caspase-8 and raised the level of cleaved caspase-8 in the liver and kidney tissues. Caspase-8, which is introduced as initiator caspase, may be prompted by cell surface death receptors. Both pathways of apoptosis (intrinsic and extrinsic pathways) might have a major effect in the toxicity of ethanol in liver and kidney tissues.
Antioxidants are known to regulate gene expression and signal transduction pathways, and can prevent the occurrence of apoptosis. Anti-apoptotic effect of N. sativa has been reported through inhibitory effect against TNF-α induced cell death, modulatory properties on expression of Bcl2 family proteins and inhibition of release of cytochrome c to the cytosol (52).
Our results showed that administration of NSO clearly reduced the Bax/Bcl2 ratio in the protein and mRNA levels in the liver and kidney of ethanol treated group. Also, NSO inhibited the activation of caspase-3, caspase-8 and caspase-9 induced by ethanol in liver and kidney tissues.
Conclusion
In summary, our data indicated that NSO has protective effects against ethanol-induced hepato -toxicity and renal toxicity through attenuating lipid peroxidation, increasing reduced GSH, reducing biochemical (AST, ALT and ALP) and specific biomarker (IL-6), reducing histopathlogical damages and alleviating apoptosis by decreasing Bax/Bcl-2 ratio and inhibition of caspase-3, caspase-8 and caspase-9 activation.
Acknowledgment
The authors are thankful to the Vice Chancellor of Research, Mashhad University of Medical Sciences for financial support. The results described in this paper were part of a Master of Science degree thesis.
Footnotes
Conflict of interest The authors declare that there are no conflicts of interest.
References
- 1.Petroni NC, Cardoni AA. Alcohol content of liquid medicinals. Clin Toxicol. 1979;14:407–432. doi: 10.3109/15563657909010603. [DOI] [PubMed] [Google Scholar]
- 2.Vogel C, Caraccio T, Mofenson H, Hart S. Alcohol intoxication in young children. Clin Toxicol. 1995;33:25–33. doi: 10.3109/15563659509020212. [DOI] [PubMed] [Google Scholar]
- 3.Charness ME, Simon RP, Greenberg DA. Ethanol and the nervous system. N Engl J Med. 1989;321:442–454. doi: 10.1056/NEJM198908173210706. [DOI] [PubMed] [Google Scholar]
- 4.Diamond I, Messing RO. Neurologic effects of alcoholism. West J Med. 1994;161:279–287. [PMC free article] [PubMed] [Google Scholar]
- 5.Adler RA. Clinically important effects of alcohol on endocrine function. J Clin Endocrinol Metab. 1992;74:957–960. doi: 10.1210/jcem.74.5.1569170. [DOI] [PubMed] [Google Scholar]
- 6.Lieber CS. Hepatic and metabolic effects of ethanol: pathogenesis and prevention. Ann Med. 1994;26:325–330. doi: 10.3109/07853899409148346. [DOI] [PubMed] [Google Scholar]
- 7.Lieber CS. Medical disorders of alcoholism. N Engl J Med. 1995;333:1058–1065. doi: 10.1056/NEJM199510193331607. [DOI] [PubMed] [Google Scholar]
- 8.Yang HY, Lin HS, Chao JC, Chien YW, Peng HC, Chen JR. Effects of soy protein on alcoholic liver disease in rats undergoing ethanol withdrawal. J Nut Biochem. 2012;23:679–684. doi: 10.1016/j.jnutbio.2011.03.016. [DOI] [PubMed] [Google Scholar]
- 9.Darwish HA, Abd Raboh NR, Mahdy A. Camel's milk alleviates alcohol-induced liver injury in rats. Food Chem Toxicol. 2012;50:1377–1383. doi: 10.1016/j.fct.2012.01.016. [DOI] [PubMed] [Google Scholar]
- 10.Hossein Hosseinzadeh SP. Effect of thymoquinone and Nigella sativa seeds oil on lipid peroxidation level during global cerebral ischemia-reperfusion injury in rat hippocampus. Phytomedicine. 2007;14:621–627. doi: 10.1016/j.phymed.2006.12.005. [DOI] [PubMed] [Google Scholar]
- 11.Jansen PM. Wageningen, The Netherlands: Centre for Agricultural Publishing and Documentation; 1981. Spices, Condiments and Medicinal Plants in Ethiopia, their Taxonomy and Agricultural Significance; pp. 194–205. [Google Scholar]
- 12.Chakravarty N. Inhibition of histamine release from mast cells by nigellone. Ann Allergy. 1993;70:237–242. [PubMed] [Google Scholar]
- 13.el-Dakhakhny M. Studies on the Egyptian Nigella sativa L. IV. Some pharmacological properties of the seeds’ active principle in comparison to its dihydro compound and its polymer. Arzneimittelforschung. 1965;15:1227–1229. [PubMed] [Google Scholar]
- 14.Mahfouz M, Abdel-Maguid R, El-Dakhakhny M. The effect of “nigellone therapy” on the histaminopexic power of the blood sera in asthmatic patients. Arzneimittelforschung. 1965;15:1230–1234. [Google Scholar]
- 15.El Tahir KE, Ashour M, Al-Harbi MM. The cardiovascular actions of the volatile oil of the black seed (Nigella sativa) in rats: elucidation of the mechanism of action. Gen Pharmacol. 1993;24:1123–1131. doi: 10.1016/0306-3623(93)90359-6. [DOI] [PubMed] [Google Scholar]
- 16.Al-Ghamdi M. The anti-inflammatory, analgesic and antipyretic activity of Nigella sativa. J Ethnopharmacol. 2001;76:45–48. doi: 10.1016/s0378-8741(01)00216-1. [DOI] [PubMed] [Google Scholar]
- 17.Houghton PJ, Zarka R, de las Heras B, Hoult J. Fixed oil of Nigella sativa and derived thymoquinone inhibit eicosanoid generation in leukocytes and membrane lipid peroxidation. Planta Med. 1995;61:33–36. doi: 10.1055/s-2006-957994. [DOI] [PubMed] [Google Scholar]
- 18.Abdel-Fattah A-FM, Matsumoto K, Watanabe H. Antinociceptive effects of Nigella sativa oil and its major component, thymoquinone, in mice. Eur J Pharmacol. 2000;400:89–97. doi: 10.1016/s0014-2999(00)00340-x. [DOI] [PubMed] [Google Scholar]
- 19.Al-Hader A, Aqel M, Hasan Z. Hypoglycemic effects of the volatile oil of Nigella sativa seeds. Pharmaceut Biol. 1993;31:96–100. [Google Scholar]
- 20.Topozada HH, Mazolum HA, El-Dakhakhny M. The antibacterial properties of Nigella sativa seeds, active principle with some clinical applications. J Egypt Med Assoc. 1965;48:187–202. [PubMed] [Google Scholar]
- 21.Hanafy MS, Hatem ME. Studies on the antimicrobial activity of Nigella sativa seed black cumin. J Ethnopharmacol. 1991;34:275–278. doi: 10.1016/0378-8741(91)90047-h. [DOI] [PubMed] [Google Scholar]
- 22.Salomi N, Nair S, Jayawardhanan K, Varghese C, Panikkar L. Anti-tumor principles from Nigella sativa and saffron (Crocus sativus) on chemical carcinogenesis in mice. Nutr Cancer. 1992;16:67–72. doi: 10.1080/01635589109514142. [DOI] [PubMed] [Google Scholar]
- 23.Hosseinzadeh H, Parvardeh S. Anticonvulsant effects of thymoquinone, the major constituent of Nigella sativa seeds, in mice. Phytomedicine. 2004;11:56–64. doi: 10.1078/0944-7113-00376. [DOI] [PubMed] [Google Scholar]
- 24.Hosseinzadeh H, Parvardeh S, Nassiri-Asl M, Mansouri MT. Intracerebroventricular administration of thymoquinone, the major constituent of Nigella sativa seeds, suppresses epileptic seizures in rats. Med Sci Monit. 2005;11:BR106–BR110. [PubMed] [Google Scholar]
- 25.Hosseinzadeh H, Jaafari MR, Khoei AR, Rahmani M. Anti-ischemic effect of Nigella sativa L. seed in male rats. Iran J Pharm Res. 2006;5:53–58. [Google Scholar]
- 26.Worthen DR, Ghosheh OA, Crooks PA. The in vitro anti-tumor activity of some crude and purified components of blackseed, Nigella sativa L. Anticancer Res. 1998;18:1527–1532. [PubMed] [Google Scholar]
- 27.Burits M, Bucar F. Antioxidant activity of Nigella sativa essential oil. Phytother Res. 2000;14:323–328. doi: 10.1002/1099-1573(200008)14:5<323::aid-ptr621>3.0.co;2-q. [DOI] [PubMed] [Google Scholar]
- 28.Riaz M, Syed M, Chaudhary FM. Chemistry of the medicinal plants of the genus Nigella. Hamdard Medicus. 1996;39:40–45. [Google Scholar]
- 29.Ali BH, Blunden G. Pharmacological and Toxicological Properties of Nigella sativa. Phytother Res. 2003;17:299–305. doi: 10.1002/ptr.1309. [DOI] [PubMed] [Google Scholar]
- 30.Mahfouz M, Abdel-Meguid R, El-Dakhakimy M. Effectiveness of ‘Nigella’ in asthma. Alexandria Med J. 1960;6:543–547. [Google Scholar]
- 31.D’Antuono LF, Moretti A, Lovato A. Seed yield, yield components, oil content and essential oil content and composition of Nigella sativa L. and Nigella damascene L. Indust Crops Prod. 2002;15:59–69. [Google Scholar]
- 32.Niehaus WG, Jr, Samuelsson B. Formation of malonaldehyde from phospholipid arachidonate during microsomal lipid peroxidation. Eur J Biochem. 1968;6:126–130. doi: 10.1111/j.1432-1033.1968.tb00428.x. [DOI] [PubMed] [Google Scholar]
- 33.Moron MS, Depierre JW, Mannervik B. Levels of glutathione, glutathione reductase and glutathione S transferase activities in rat lung and liver. Biochim Biophys Acta. 1979;582:67–78. doi: 10.1016/0304-4165(79)90289-7. [DOI] [PubMed] [Google Scholar]
- 34.Jurczuk M, Brzóska MM, Moniuszko-Jakoniuk J, Gałazyn-Sidorczuk M, Kulikowska-Karpińska E. Antioxidant enzymes activity and lipid peroxidation in liver and kidney of rats exposed to cadmium and ethanol. Food Chem Toxicol. 2004;42:429–438. doi: 10.1016/j.fct.2003.10.005. [DOI] [PubMed] [Google Scholar]
- 35.Scott RB, Reddy KS, Husain K, Schlorff EC, Rybak LP, Somani SM. Dose response of ethanol on antioxidant defense system of liver, lung, and kidney in rat. Pathophysiology. 2000;7:25–32. doi: 10.1016/s0928-4680(99)00034-6. [DOI] [PubMed] [Google Scholar]
- 36.Hoek JB, Pastorino JG. Ethanol, oxidative stress, and cytokine-induced liver cell injury. Alcohol. 2002;27:63–68. doi: 10.1016/s0741-8329(02)00215-x. [DOI] [PubMed] [Google Scholar]
- 37.Yoon SJ, Koh EJ, Kim CS, Jee OP, Kwak JH, Jeong WJ, et al. Agrimonia eupatoria protects against chronic ethanol-induced liver injury in rats. Food Chem Toxicol. 2012;50:2335–2341. doi: 10.1016/j.fct.2012.04.005. [DOI] [PubMed] [Google Scholar]
- 38.Arslan SO, Ethem Gelir TE, Armutcu F, Coskun O, Gurel A, Hale Sayan, et al. The protective effect of thymoquinone on ethanol-induced acute gastric damage in the rat. Nutr Res. 2005;25:673–680. [Google Scholar]
- 39.El-Dakhakhny M, Barakat M, Abd El-Halim M, Aly SM. Effects of Nigella sativa oil on gastric secretion and ethanol induced ulcer in rats. J Ethnopharmacol. 2000;72:299–304. doi: 10.1016/s0378-8741(00)00235-x. [DOI] [PubMed] [Google Scholar]
- 40.Lu ZM, Tao WY, Zou XL, Fu HZ, Ao ZH. Protective effects of mycelia of Antrodia camphorata and Armillariella tabescens in submerged culture against ethanol-induced hepatic toxicity in rats. J Ethnopharmacol. 2007;110:160–164. doi: 10.1016/j.jep.2006.09.029. [DOI] [PubMed] [Google Scholar]
- 41.Esposito E, Cuzzocrea S. TNF-alpha as a therapeutic target in inflammatory diseases, ischemia-reperfusion injury and trauma. Curr Med Chem. 2009;16:3152–3167. doi: 10.2174/092986709788803024. [DOI] [PubMed] [Google Scholar]
- 42.Shirpoor A, Minassian S, Salami S, Khadem-Ansari MH, Ghaderi-Pakdel F, Yeghiazaryan M. Vitamin E protects developing rat hippocampus and cerebellum against ethanol-induced oxidative stress and apoptosis. Food Chem. 2009;113:115–120. [Google Scholar]
- 43.El Daly E. Protective effect of cysteine and vitamin E, Crocus sativus and Nigella sativa extracts on cisplatin-induced toxicity in rats. J Pharm Belg. 1998;53:87–93. [PubMed] [Google Scholar]
- 44.El-Dakhakhny M, Mady NI, Halim MA. Nigella sativa L. oil protects against induced hepatotoxicity and improves serum lipid profile in rats. Arzneimittelforschung. 2000;50:832–836. doi: 10.1055/s-0031-1300297. [DOI] [PubMed] [Google Scholar]
- 45.Mansour MA. Protective effects of thymoquinone and desferrioxamine against hepatotoxicity of carbon tetrachloride in mice. Life Sci. 2000;66:2583–2591. doi: 10.1016/s0024-3205(00)00592-0. [DOI] [PubMed] [Google Scholar]
- 46.Helal GK. Thymoquinone supplementation ameliorates acute endotoxemia-induced liver dysfunction in rats. Pak J Pharm Sci. 2010;23:131–137. [PubMed] [Google Scholar]
- 47.Fadeel B, Orrenius S, Zhivotovsky B. Apoptosis in human disease: a new skin for the old ceremony? Biochem Biophys Res Commun. 1999;266:699–717. doi: 10.1006/bbrc.1999.1888. [DOI] [PubMed] [Google Scholar]
- 48.Kumar S, Sitasawad SL. N-acetylcysteine prevents glucose/glucose oxidase-induced oxidative stress, mitochondrial damage and apoptosis in H9c2 cells. Life Sci. 2009;84:328–336. doi: 10.1016/j.lfs.2008.12.016. [DOI] [PubMed] [Google Scholar]
- 49.Elmore S. Apoptosis: a review of programmed cell death. Toxicol Pathol. 2007;35:495–516. doi: 10.1080/01926230701320337. [DOI] [PMC free article] [PubMed] [Google Scholar]
- 50.Frenzel A, Grespi F, Chmelewskij W, Villunger A. Bcl2 family proteins in carcinogenesis and the treatment of cancer. Apoptosis. 2009;14:584–596. doi: 10.1007/s10495-008-0300-z. [DOI] [PMC free article] [PubMed] [Google Scholar]
- 51.Scorrano L, Korsmeyer S. Mechanisms of cytochrome c release by proapoptotic BCL-2 family members. Biochem Biophys Res Commun. 2003;304:437–444. doi: 10.1016/s0006-291x(03)00615-6. [DOI] [PubMed] [Google Scholar]
- 52.Abd El-Ghany RM, Sharaf NM, Kassem LA, Mahran LG, Heikal OA. Thymoquinone triggers anti-apoptotic signaling targeting death ligand and apoptotic regulators in a model of hepatic ischemia reperfusion injury. Drug Discov Ther. 2009;3:296–306. [PubMed] [Google Scholar]


