

Abstract
The aim of this study was to find an inexpensive and environmentally friendly CO2 source for growing the hydrogen-producing microalgae Chlamydomonas reinhardtii. The effect of different flue gas concentrations from a silicomanganese smelter on the growth of these algae at a photon flux density of 200 μmol photons m−2 s−1 applied 24 h day−1 was studied. First, the algae were grown in a laboratory at 1.2, 6.8 and 17.1 % (v/v) pure CO2 gas mixed with fresh air. After 5 days of growth, the dry biomass per litre algal culture was slightly higher (17 %) at 6.8 % CO2 as compared to at 1.2 % CO2. A further increase to 17.1 % CO2 decreased the biomass by about 40 %. Then, the flue gas from a silicomanganese smelter was used as a CO2 source for growing the algae. The flue gas was characterized by a high CO2 concentration (about 17 % v/v), low oxygen concentration (about 4 %), about 100 ppm NOx and 1 ppm SO2. The culture medium bubbled with undiluted flue gas contained about 490 mg L−1 dissolved CO2 and 4.0 mg L−1 dissolved O2, while the lowest flue gas concentration contained about 280 mg L−1 CO2 and 7.1 mg L−1 O2. Undiluted flue gas (17.4 % CO2) decreased the biomass of the algae by about 40 % as compared with 4.8 % pure CO2 gas or flue gas diluted to a concentration of 6.3 % CO2. Flue gas diluted to give 10.0 % CO2 gave less reduction in the growth of the algae (22 %). It was concluded that the high CO2 concentration itself caused the growth reduction and not the air pollutants, and the very low O2 concentrations in the growth medium could not counteract this negative effect.
Keywords: Biomass, Microalgae, Nitrogen oxides, Oxygen concentration (O2)
Introduction
Hydrogen is recognised as a promising future energy alternative because it produces no carbon dioxide that contributes to the greenhouse effect when combusted (IPCC 2013). Today, conventional hydrogen production is energy-intensive, and more environmentally friendly production by means of biological processes is therefore of great interest (Jo et al. 2006; Skjånes et al. 2007). The single-cell green alga Chlamydomonas reinhardtii is known to produce hydrogen when starved of sulfur under anaerobic conditions (Melis et al. 2000; Nguyen et al. 2011; Geier et al. 2012). Hydrogen is released through the action of a hydrogenase enzyme that receives the energy from electrons from the breakdown of starch or splitting of water in photosystem II. Before the anaerobic hydrogen-producing stage, the microalgae are grown under aerobic conditions: sunlight with CO2 and nutrients. Today’s atmospheric CO2 concentration of around 400 ppm strongly limits the algae growth, and additional CO2 should be supplied throughout the production phase (Geier et al. 2012). It has also been found that C. reinhardtii grown at high CO2 concentrations subsequently produces more hydrogen than when grown at low CO2 levels (Geier et al. 2012). In order for the production to be environmentally friendly, waste CO2 from industrial flue gas should be used, which also contributes to cleaning the emissions. Several studies have investigated the effect of flue gases on the growth of microalgae (Douskova et al. 2009; Kastánek et al. 2010; Borkenstein et al. 2011; Lara-Gil et al. 2014). Depending on the species and the content of different pollutants in the flue gas, the growth varied greatly compared with using pure CO2 gas. Although C. reinhardtii has been subjected to extensive investigation, the effect of flue gas seems to have been little studied in this species. Bark (2012) showed that C. reinhardtii could be grown in simulated flue gas at a concentration of 15 % CO2/100 ppm NO; however, the growth was better at lower CO2 concentrations. A CO2 concentration of 4.5 % was found to be optimal for the growth when the effect of concentrations between 1 and 6 % was studied in C. reinhardtii (Daria Markina, unpublished results). In order to maximise the conversion of solar energy to biomass, it is important to search for an industrial emission that stimulates growth to the same extent as pure CO2. Since extensive cleaning devices have been installed during recent years, the emissions from a silicomanganese smelter in Norway are recognised as being very clean (www.eramet.no). Highly efficient combustion processes produce emission gas containing up to 20 % CO2 accompanied by O2 in concentrations down to 1 %. Such high CO2 concentrations are rarely obtained in industrial emissions. The combination of high CO2 and low O2 concentrations is of particular interest for plant production, since combination of high CO2 and low O2 decreases photorespiration and increases photosynthesis in C3 plants as well as in microalgae (Ramazanov and Cardenas 1992; Kliphuis et al. 2011). In studies of the effect of CO2 concentration on the growth of microalgae, CO2 gas is usually mixed with air, causing dilution of the O2 content. If 20 % CO2 is added to the air, the resulting O2 concentration would be around 17 %, while the emission from the silicomanganese smelter in our study could reach 20 % CO2 combined with 1 % O2. Our study therefore focused on the effect of the CO2 concentration and air pollutants in the flue gas as well as on the O2 concentration. The study was a combination of laboratory experiments with pure CO2 gas mixed with fresh air and experiments with flue gas at the site of the silicomanganese smelter. Since previous results have shown that concentrations above 1 % CO2 increase the growth of this alga, around 1 % CO2 was chosen to be the lowest concentration in this study (Markina, unpublished results).
Materials and methods
Chlamydomonas reinhardtii strain SAG 34.89 from Georg-August-Universität Göttingen (Germany) obtained from the NIVA culture collection, Norway, was used in the experiments. The algae were stored on Petri dishes covered with TAP medium 1.5 % agar (Gorman and Levine 1965). The algae were grown in tap water-based high-salt Sueoka medium (Sueoka 1960). Sodium bicarbonate was used at 10 mM in order to buffer the culture medium since pH otherwise would become very low due to ammonium uptake by C. reinhardtii. The addition of bicarbonate typically increased pH of the culture medium by 0.6 units. The microalgae were grown in 1.0-L clear plastic bottles (80 mm inner and 82 mm outer diameter) filled with 0.85 L of growing medium (filled to 17 cm). Twelve bottles were placed in a row adjacent to each other. The light was supplied from one side by four cool white fluorescent tubes (Osram L36W/840) placed about 10 cm in front of the bottles. A photon flux density (PFD) of 200 ± 10 μmol photons m−2 s−1 was given 24 h day−1 and was measured by a LI-COR Model LI-250 instrument with a quantum sensor (400–700 nm). The CO2 concentration was measured using a Vaisala CO2 transmitter (type GMT221, range 0–5 %) or a Vaisala GMP instrument with a sensor in the range 0–20 %. The CO2 concentration was recorded once in an hour. The temperature was measured by copper-constantan thermocouples and was recorded hourly using a Campbell AM25T multiplexer.
The different CO2 concentrations with pure CO2 gas were established by mixing food grade CO2 with fresh air. The CO2 gas flow was determined by capillaries with defined resistances. The gas pressure was defined by the height of a water column. In this way, a very accurate CO2 flow could be added to a constant rate of fresh air produced by air pumps (Resun ACO-001, ACO-004). The different gas mixtures were bubbled through 0.3-cm-inner diameter plastic tubes to the bottom of the bottles at a rate of approximately 100 L h−1. All treatments in all experiments included three parallel bottles with 0.85 L culture. The initial algae concentration was 0.2 g dry weight L−1 medium in the different experiments. For practical reasons, the start culture had been stored in darkness at 5 °C; however, this seemed not to reduce the activity of the microalgae since no lag period was observed at start of the experiments.
Laboratory experiments
C. reinhardtii was grown in pure CO2 gas mixed with fresh air to give three CO2 concentrations (1.2 ± 0.4, 6.8 ± 1.0 and 17.1 ± 2.4 %). The experiment lasted 6 days and the temperature was 23.8 ± 1.5 °C. In order to see if an acclimation to high CO2 concentrations (6.5 ± 0.3 and 16.2 ± 0.7 %) took place, the algae were grown in another experiment for 6 days before dilution of the cultures and continuation of the experiment for another 5 days. In this experiment, the turbidity (FTU) was measured by a Hanna instrument (HI 93703). The measurements were carried out in the range 0–50 FTU (the linear phase) by diluting the algal culture if necessary. The temperature in this experiment was 22.0 ± 1.7 °C. The variation in the temperatures was due to no cooling devices in the algal growing room.
Experiment with flue gas from a silicomanganese smelter
An experimental set-up was established in a silicomanganese smelter (Eramet Norway Kvinesdal; www.eramet.no). The melting furnaces are run on electricity, and the flue gas from the furnaces is cleaned in order remove polycyclic aromatic hydrocarbons (PAHs) and mercury before emission as cleaned flue gases through the chimney. In 2012, the emissions from the furnaces amounted to 208,000 t of CO2, 88.5 t of NOx (95 % NO), 4.12 t of SO2 and 2.68 kg of Hg (www.norskeutslipp.no; Eramet Norway Kvinesdal AS). Flue gas from the chimney was sucked by pumps (Resun ACO-008A) with a capacity of 6.9 m3 h−1 through two 100-L plastic tubs in series for condensation of the water vapour. Then, the flue gas was diluted by mixing with fresh air in order to establish two CO2 concentrations in addition to the CO2 concentration in the undiluted flue gas. The mean concentrations throughout the 4-day experimental period were 6.3 ± 1.0, 10.0 ± 1.6 and 17.4 ± 2.9 % in the three flue gas treatments. This corresponded to mean O2 concentrations of around 15, 11 and 4 %, respectively. The corresponding NOx concentrations were 36 ± 6, 58 ± 10 and 102 ± 13 ppm, the SO2 concentrations were 0.4 ± 0.0, 0.6 ± 0.1 and 1.1 ± 0.1 ppm, while the H2S concentrations were 0.3 ± 0.0, 0.5 ± 0.1 and 0.8 ± 0.1 ppm, at the different flue gas concentrations, respectively. The measured CO concentration was <5 ppm in the undiluted flue gas. The pollutants were measured using Dräger gas detection tubes (Accuro, Dräger Safety, Germany). The concentration of Hg was not measured during the experiment, but it has been reported to vary between 1 and 5 μg m−3 and can be calculated from the yearly emission data (www.norskeutslipp.no). In addition to the different flue gas treatments, a control treatment was established with pure CO2 gas at a concentration of 4.8 ± 0.8 %. The O2 concentration in the algae culture was measured using an Odeon OPTOD sensor for dissolved oxygen. Light was provided by fluorescent tubes as described above. The mean temperature during the experimental period was 28.7 ± 0.5 °C, a temperature that was the result of the hot environment in a room adjacent to that of the melting furnaces.
In the laboratory experiment, the dry weight of the cells was measured by filtering 0.3–2.0 ml of algal culture through 0.7-μm-pore size, 25-mm-diameter Whatman GF/F glass microfiber filters to collect the biomass. The filters with the algae were washed with 20 mL distilled water to remove adhering salts and then were dried at 104 °C for 4 h. The dry weight was calculated by subtracting the dry weight of the clean filter from the dry weight of the filter with algae. In the experiment at the smelter site, the dry weight was measured by vacuum filtering 10 or 20 mL of culture through a 90-mm filter (Whatman GF/B) and by drying it in an oven for 4 h at 100 °C. No pore size of this filter was given; however, all algal cells remained on the filter since no colouration of the filtered water was observed. The number of cells and cell diameter were counted using a cell counter (Multisizer 4 Coulter Counter, Beckman Coulter). Since the algae were not grown aseptically, it was useful to study the cell size distribution in order to identify if other microorganisms were present in the cultures.
The data were analysed using the SAS ANOVA procedure (SAS Institute, Inc., USA) based on the bottles as replicates (n = 3).
Dissolved CO2 in the growth medium
For algae growth, the concentration of dissolved CO2 in the nutrient medium is important and not the concentration of CO2 in the air bubbled into the culture. Recently, the dissolved CO2 in the growth medium was measured with the same algal growing system as used in the present study (Mortensen and Gislerød 2014). Based on these data, a regression analysis was done (Fig. 1). The results showed a progressive increase in the dissolved CO2 concentration from about 100 to about 500 mg L−1 with increasing CO2 concentration from about 1 % up to about 24 %. The regression equation (order 2) was found to be y = 83.4 + 35.5x − 0.70x 2 (r 2 = 0.973). Parallel to this increase, the pH decreased from 7.6 to about 6.5. The measurements were done at 23 °C. The dissolved CO2 as measured at 7.0 % CO2 was found to be about the same in the temperature range 23–33 °C.
Fig. 1.
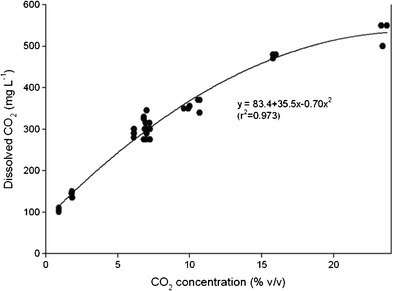
The effect of CO2 concentration on dissolved CO2 in the growth medium (n = 3, SE)
Results
Laboratory experiments
In the first experiment, the dry biomass of the algae (g L−1) was increased by 17 % when the CO2 concentration was increased from 1.2 to 6.8 %, while a further increase to 17.2 % CO2 decreased it by around 40 % (Table 1). The dry weight and diameter per cell were unaffected by the CO2 concentration. The pH at end of the experiment decreased from 7.2 to 6.4 when the CO2 concentration was increased from the lowest to the highest level. In the second experiment, the turbidity increased in the two treatments (6.5 and 16.2 % CO2) over 6 days of growth without any lag phase (Fig. 2). After 6 days, the cultures were diluted and the cultures continued to grow at about the same rate as before dilution. No significant acclimation to high CO2 seemed to take place. The growth rate was significantly higher at 6.5 % compared to 16.2 % CO2. In this experiment, the dry weight was only measured after 6 days (1.03 ± 0.11 and 0.47 g L−1 at 6.5 and 16.2 % CO2, respectively).
Table 1.
The effect of different concentrations of pure CO2 on mean the dry biomass, cell diameter and dry weight (n = 3, ±SE) of C. reinhardtii grown 5 days at a photon flux density of 200 μmol photons m−2 s−1 and a temperature of 23.8 °C
| CO2 conc. (%) | pH | Biomass (g L−1) | Cell diameter (μm) | Cell w. (рg cell−1) |
|---|---|---|---|---|
| 1.2 ± 0.4 | 7.2 ± 0.1 | 1.00 ± 0.03 | 6.6 ± 0.8 | 1,184 ± 21 |
| 6.8 ± 1.0 | 6.6 ± 0.1 | 1.17 ± 0.05 | 7.4 ± 0.1 | 1,215 ± 35 |
| 17.1 ± 2.4 | 6.4 ± 0.0 | 0.68 ± 0.15 | 5.7 ± 0.9 | 1,258 ± 63 |
| F values and significance levels | ||||
| 140*** | 8.52** | 2.01# | 3.58# | |
F values and significance levels are given
# p > 0.05; *p < 0.05; **p < 0.01; ***p < 0.001
Fig. 2.
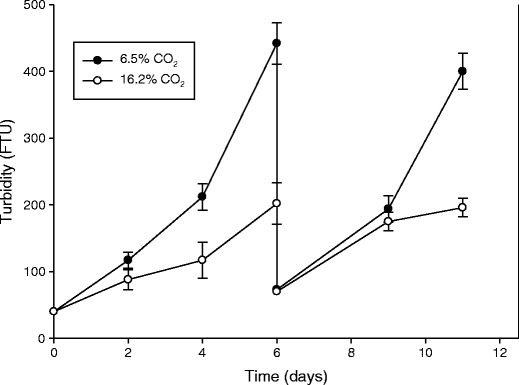
The mean turbidity of C. reinhardtii grown at two CO2 concentrations at a photon flux density of 200 μmol photons m−2 s−1 and a temperature of 22.0 °C for 11 days. After 6 days, the cultures were diluted and allowed to grow for another 5 days (n = 3, ±SE)
Flue gas experiment
Undiluted flue gas (17.4 % CO2/102 ppm NOx) decreased the dry biomass (g L−1) of the microalgae after 4 days of growth by about 40 % as compared with 4.8 % pure CO2 gas or flue gas diluted to a concentration of 6.3 % CO2/36 ppm NOx (Table 2). Flue gas diluted to give 10.0 % CO2/58 ppm NOx gave less reduction in the growth of the algae (22 %). The cell diameter was the same in all treatments (Table 2) as well as the dry weight per cell (results not presented). The experiment was repeated with two of the treatments, undiluted flue gas and 4.8 % pure CO2 gas. After 4 days, the biomass concentration was 1.11 ± 0.07 g L−1 (n = 3, ±SE) in the flue gas treatment and 1.87 ± 0.03 g L−1 (n = 3, ±SE) in pure CO2 gas treatment. This was the same decrease in growth (about 40 %, p < 0.001) by undiluted flue gas as in the first experiment. Increasing the flue gas concentration from 6.5 to 17.4 % CO2 decreased the O2 concentration in the culture from 7.4 to 4.0 mg L−1.
Table 2.
Effect of different concentrations of flue gas (FG) and pure CO2 gas on mean dry biomass (g L−1) and cell diameter of Chlamydomonas reinhardtii after 2 and 4 days of growth in a silicomanganese smelter at a photon flux density of 200 μmol photons m−2 s−1 (n = 3, ±SE)
| Treatment | NOx (ppm) | SO2 (ppm) | H2S (ppm) | Dissolved CO2 (mg L−1)a | Dissolved O2 (mg L−1) | pH | Biomass (g L−1) | ||
|---|---|---|---|---|---|---|---|---|---|
| 2 days | 4 days | Cell diam. (μm) | |||||||
| 17.4 ± 2.9 % CO2 FG | 102 ± 13 | 1.1 ± 0.1 | 0.8 ± 0.1 | 489 | 4.0 ± 0.3 | 6.3 ± 0.1 | 0.45 ± 0.04 | 1.28 ± 0.03 | 6.6 ± 0.1 |
| 10.0 ± 1.6 % CO2 FG | 58 ± 10 | 0.6 ± 0.1 | 0.5 ± 0.1 | 368 | 5.9 ± 0.0 | 6.4 ± 0.0 | 0.56 ± 0.04 | 1.67 ± 0.06 | 6.1 ± 0.2 |
| 6.3 ± 1.0 % CO2 FG | 36 ± 6 | 0.4 ± 0.0 | 0.3 ± 0.0 | 279 | 7.1 ± 0.5 | 6.6 ± 0.2 | 0.63 ± 0.08 | 1.92 ± 0.05 | 6.3 ± 0.1 |
| 4.8 ± 0.8 % pure CO2 | 0 ± 0 | 0.0 ± 0.0 | 0.0 ± 0.0 | 237 | 7.4 ± 0.5 | 6.6 ± 0.1 | 0.63 ± 0.04 | 2.14 ± 0.23 | 6.1 ± 0.2 |
| F values and significance levels | |||||||||
| 50.9*** | 7.12* | 7.42* | 16.6** | 1.37# | |||||
aValues of dissolved CO2 was calculated by the formula in Fig. 2
F values and significance levels are given
# p > 0.05; *p < 0.05; **p < 0.01; ***p < 0.001
Discussion
It appeared that the biomass production of C. reinhardtii was significantly decreased (about 40 %) when grown in undiluted flue gas at about 17 % CO2 as compared with pure CO2 gas at a concentration of about 5 % or flue gas with a CO2 concentration of 6 %. In the present study, flue gas with a concentration of 10 % CO2 decreased the biomass by about 20 %. This is quite similar to the 20–25 % biomass reduction in the same strain recently found with flue gas from waste combustion at a concentration of 11.4 % CO2 (Mortensen and Gislerød 2014). Also, Bark (2012) found that 20 % CO2 was too high to give optimal growth of this species.
Similar results have been obtained with Scenedesmus dimorphus, where 20 % CO2 significantly reduced biomass production as compared to 2 and 10 % CO2 (Jiang et al. 2013). Chlorella pyrenoidosa could tolerate concentration up to 50 % CO2; however, the growth was the best at 10 % (Tang et al. 2011). Several microalgae species have shown good tolerance to concentrations up to approximately 20 % and even up to 100 % (van den Hende et al. 2012). In the present experiment, CO2 stress that inhibited the efficiency of photosystem II might explain the growth reduction at high CO2. Although the pH of the culture was slightly lower at the highest flue gas concentration, this did not seem to be the reason for the reduced growth, since the pH still was within an optimal range of this species (Bark 2012). Olaizola (2003) concluded that a moderate decrease in pH caused by flue gases probably has a small effect on the growth of microalgae cultures. Nevertheless, the use of a bicarbonate buffer in the present study avoided a strong acidification that would otherwise have arisen at high CO2 concentrations. In the present experiment with flue gas, the NOx level reached about 100 ppm and the SO2 level 1 ppm in combination with 17 % CO2. Such concentrations, however, seem seldom to affect the growth of microalgae (Brown 1996; Olaizola 2003; Hende et al. 2012; Farrelly et al. 2013; Jiang et al. 2013).
Kliphuis et al. (2011) found a 20 % increase in growth rate in C. reinhardtii when air with 21 % O2 was replaced by N2 (0 % O2) when mixed with 2 % CO2. This effect was attributed to the reduction in the oxygenase activity of Rubisco, resulting into decreased photorespiration and increased growth. However, Vance and Spalding (2005) who studied the same species over a range of CO2 concentrations (0.005–5 %) at 2 and 20 % O2 found no discernable effect of the O2 concentration on growth. The effect on growth was related to the CO2 concentration alone. Unfortunately, the results with the present flue gas were in accordance with the conclusions of Vance and Spalding (2005) and not Kliphuis et al. (2011). The very low O2 concentration (down to about 1 %) in the flue gas from the silicomanganese smelter resulting into dissolved O2 values in the algae culture down to about 4 mg L−1 seemed therefore not to be of any particular benefit. In addition, the very high CO2 concentration (up to 20 %) resulting into dissolved CO2 values of up to 490 mg L−1 in algal culture caused a negative effect on growth. Based on the results from the present experiments, it can be concluded that flue gas containing up to about 6 % CO2 would be optimal for the production of the present C. reinhardtii strain. However, the special properties of the flue gas from the silicomanganese smelters seemed not to provide an advantage over other flue gas sources.
Acknowledgments
The authors thank Eramet Norway Kvinesdal, Håvard Midtgaard and staff for an excellent cooperation and also thank Ms. Silje Evensdatter Roksi for her technical assistance. This work was done as a part of the project ‘Use of solar energy for CO2 capture, algae cultivation and hydrogen production’ headed by Stig Borgvang, Bioforsk, Norway, and was financed by the Research Council of Norway.
References
- Bark M (2012) Cultivation of eleven different species of freshwater microalgae using simulated flue gas mimicking effluents from paper mills as carbon source. Master’s Thesis, Chalmers University of Technology, Gothenburg, 97 p
- Borkenstein CG, Knoblechner J, Frühwirth H, Schagert M. Cultivation of Chlorella emersonii with flue gas derived from cement plant. J Appl Phycol. 2011;23:131–135. doi: 10.1007/s10811-010-9551-5. [DOI] [Google Scholar]
- Brown LM. Uptake of carbon dioxide from flue gas by microalgae. Energ Conv Manag. 1996;37:1363–1367. doi: 10.1016/0196-8904(95)00347-9. [DOI] [Google Scholar]
- Douskova I, Doucha J, Livansky K, Machat J, Novak P, Umysova D, Zachleder V, Vitova M. Simultaneous flue gas bioremediation and reduction of microalgal biomass production costs. Appl Microbiol Biot. 2009;82:179–185. doi: 10.1007/s00253-008-1811-9. [DOI] [PubMed] [Google Scholar]
- Farrelly DJ, Everard CD, Fagan CC, McDonnell KP. Carbon sequestration and the role of biological carbon mitigation: a review. Ren Sust Energy Rev. 2013;21:712–727. doi: 10.1016/j.rser.2012.12.038. [DOI] [Google Scholar]
- Geier SC, Huyer S, Praebst K, Husmann M, Walter C, Buchholz R. Outdoor cultivation of Chlamydomonas reinhardtii for photobiological hydrogen production. J Appl Phycol. 2012;24:319–327. doi: 10.1007/s10811-011-9729-5. [DOI] [Google Scholar]
- Gorman DS, Levine RP. Cytochrome f and plastocyanin: their sequence in the photosynthetic electron transport chain of Chlamydomonas reinhardtii. Proc Natl Acad Sci U S A. 1965;54:1665–1669. doi: 10.1073/pnas.54.6.1665. [DOI] [PMC free article] [PubMed] [Google Scholar]
- IPCC (2013) Climate change 2013: the physical science basis. Contribution of Working Group I to the Fifth Assessment Report of the Intergovernmental Panel on Climate Change [Stocker, T. F., D. Qin, G.-K. Plattner, M. Tignor, S. K. Allen, J. Boschung, A. Nauels, Y. Xia, V. Bex and P. M. Midgley (eds.)]. Cambridge University Press, Cambridge, www.climatechange2013.org
- Jiang Y, Zhang W, Wang J, Chen Y, Shen S, Liu T. Utilization of simulated flue gas for cultivation of Scenedesmus dimorphus. Bioresour Tech. 2013;128:359–364. doi: 10.1016/j.biortech.2012.10.119. [DOI] [PubMed] [Google Scholar]
- Jo HJ, Lee DS, Park JM. Modeling and optimization of photosynthetic hydrogen gas production by green alga Chlamydomonas reinhardtii in sulphur-deprived circumstance. Biotechnol Prog. 2006;22:431–437. doi: 10.1021/bp050258z. [DOI] [PubMed] [Google Scholar]
- Kastánek F, Sabata S, Solcová O, Maléterová Y, Kastánek P, Brányiková I, Kuthan K, Zachleder V. In-field experimental verification of cultivation of microalgae Chlorella sp. using flue gas from cogeneration unit as a source of carbon dioxide. Waste Manag Res. 2010;28:961–966. doi: 10.1177/0734242X10375866. [DOI] [PubMed] [Google Scholar]
- Kliphuis AMJ, Martens DE, Janssen M, Wijffels RH. Effect of O2:CO2 ratio on the primary metabolism of Chlamydomonas reinhardtii. Biotechnol Bioeng. 2011;108:2390–2402. doi: 10.1002/bit.23194. [DOI] [PubMed] [Google Scholar]
- Lara-Gil JA, Alvarez MM, Pacheco A (2014) Toxicity of flue gas components from cement plants in microalgae mitigation systems. J Appl Phycol 26:357–368
- Melis A, Zhang L, Forestier M, Ghiradi M, Sebert M. Sustained photobiological hydrogen gas production upon reversible inactivation of oxygen evolution in the green algae Chlamydomonas reinhardtii. Plant Physiol. 2000;122:127–136. doi: 10.1104/pp.122.1.127. [DOI] [PMC free article] [PubMed] [Google Scholar]
- Mortensen LM, Gislerød HR (2014) The effect on growth of Chlamydomonas reinhardtii of flue gas from a power plant based on waste combustion. AMB Express (in press) [DOI] [PMC free article] [PubMed]
- Nguyen AV, Toepel J, Burgess S, Uhmeyer A, Bilfernez O, Doebbe A, Hankamer B, Nixon P, Wobbe L, Kruse O (2011). Time-course global expression profiles of Chlamydomonas reinhardtii during photo-biological H2 production. PLoS One 6(12):e29364 [DOI] [PMC free article] [PubMed]
- Olaizola M. Microalgal removal of CO2 from flue gases: changing in medium pH and flue gas composition do not appear to affect the photochemical yield of microalgal cultures. Biotech Bioprocess Eng. 2003;8:360–367. doi: 10.1007/BF02949280. [DOI] [Google Scholar]
- Ramazanov Z, Cardenas J. Involvement of photorespiration and glycolate pathway in carbonic anhydrase induction and inorganic carbon concentration in Chlamydomonas reinhardtii. Physiol Plant. 1992;84:502–508. doi: 10.1111/j.1399-3054.1992.tb04697.x. [DOI] [Google Scholar]
- Skjånes K, Lindblad P, Muller J. BioCO2—a multidisciplinary, biological approach using solar energy to capture CO2 while producing H2 and high value products. Biomol Eng. 2007;24:405–413. doi: 10.1016/j.bioeng.2007.06.002. [DOI] [PubMed] [Google Scholar]
- Sueoka N. Mitotic replication of deoxyribonucleic acid in Chlamydomonas reinhardii. Proc Natl Acad Sci U S A. 1960;46:83–91. doi: 10.1073/pnas.46.1.83. [DOI] [PMC free article] [PubMed] [Google Scholar]
- Tang D, Han W, Li P, Miao X, Zhong J. CO2 biofixation and fatty acid composition of Scenedesmus obliquus and Chlorella pyrenoidosa in response to different CO2 levels. Biores Techn. 2011;102:3071–3076. doi: 10.1016/j.biortech.2010.10.047. [DOI] [PubMed] [Google Scholar]
- van den Hende S, Vervaeren H, Boon N. Flue gas compounds and microalgae: (bio-)chemical interactions leading to biotechnological opportunities. Biotechnol Adv. 2012;30:1405–1424. doi: 10.1016/j.biotechadv.2012.02.015. [DOI] [PubMed] [Google Scholar]
- Vance P, Spalding MH. Growth, photosynthesis, and gene expression in Chlamydomonas over a range of CO2 concentrations and CO2/O2 ratios: CO2 regulates multiple acclimation states. Can J Bot. 2005;83:796–809. doi: 10.1139/b05-064. [DOI] [Google Scholar]