Abstract
Rationale
The American Recovery and Reinvestment Act (ARRA) allowed NHLBI to fund R01 grants that fared less well on peer review than those funded by meeting a payline threshold. It is not clear whether the sudden availability of additional funding enabled research of similar or lesser citation impact than already funded work.
Objective
To compare the citation impact of ARRA-funded de novo NHLBI R01 grants with concurrent de novo NHLBI R01 grants funded by standard-payline mechanisms.
Methods and Results
We identified de novo (“Type 1”) R01 grants funded by NHLBI in fiscal year (FY) 2009: these included 458 funded by meeting Institute’s published payline and 165 funded only because of ARRA funding. Compared to payline grants, ARRA grants received fewer total funds (median values $1.03 million versus $1.87 million, P<0.001) for a shorter duration (median values including no-cost extensions 3.0 versus 4.9 years, P<0.001). Through May 2014, the payline R01 grants generated 3895 publications, while the ARRA R01 grants generated 996. Using the InCites database from Thomson-Reuters, we calculated a “normalized citation impact” for each grant by weighting each paper for the number of citations it received normalizing for subject, article type, and year of publication. The ARRA R01 grants had a similar normalized citation impact per $1 million spent as the payline grants (median values[IQR] 2.15[0.73–4.78] versus 2.03[0.75–4.10], P=0.61). The similar impact of the ARRA grants persisted even after accounting for potential confounders.
Conclusions
Despite shorter durations and lower budgets, ARRA R01 grants had comparable citation outcomes per $million spent to that of contemporaneously funded payline R01 grants.
Keywords: Research funding, economics, bibliometrics, citations
Introduction
When Congress enacted the American Recovery and Reinvestment Act (ARRA) in 2009, the National Institutes of Health (NIH) was faced with an unprecedented opportunity and challenge of quickly assembling and supporting a portfolio of short-term grants that under normal circumstances would not have been funded. The ARRA came in the midst of a continuous decline in real NIH dollars available for extramural research support; the decline continued after the ARRA program ended.1 NHLBI chose to spend some of its ARRA (or “stimulus”) funds on “shovel ready” R01 grants that had undergone peer review in FY2008 and FY2009 but had not been funded due to failure to meet the Institute’s payline.2 NHLBI program staff contacted investigators whose grants were within 10 percentile points of the 2009 payline and asked them to revise the scope and the budget of their projects that were originally proposed for 4 to 5 years to fit into the ARRA two-year timeframe. As noted by others, the sudden ability of NIH institutes to fund grants that missed paylines effectively created a “natural experiment” of the impact of additional research funding on scientific productivity.3 Since the newly funded grants fared less well on peer review and were subject to budgetary and calendar restrictions, we might surmise that their productivity per dollar would be lower than that seen for payline grants. We therefore decided to compare the citation impact of ARRA-funded de novo NHLBI R01 grants with concurrent de novo NHLBI R01 grants funded by standard payline-based mechanisms.
Methods
Study Sample
We included all de novo (“Type 1”) FY 2009 NHLBI funded R01 research grants along with their subsequent non-competing (Type-5) and competing (Type-2) renewals. There were 458 grants funded by meeting Institute’s published payline (“payline R01 grants”) and 165 funded only because of ARRA funding (“ARRA R01 grants”).
Data collection
Using publically accessible NIH Research Online Portfolio Reporting Tools (RePORT, http://projectreporter.nih.gov we recorded data for each grant on project start and end dates (including no-cost extensions), budget start and end dates, total funding, and publications. We supplemented these data with internally available data on use of vertebrate animals, involvement of human research subjects, performance of clinical trials, amount of requested funding and duration, the principal investigators’ prior NIH funding (number of prior funded projects and amount of prior funding), and previous participation in meetings of NIH study sections, special emphasis panels, and advisory councils. We defined “early stage investigators” as a new investigator who was within 10 years of completing his/her terminal research degree or medical residency (or equivalent).
Outcomes
We utilized InCites™, a database developed by Thomson-Reuters to measure citation impact. For each paper, InCites provides a “percentile” value, which is a measure of how often the paper was cited compared with papers that were published in the same year, were of similar type (review, research, report, book chapter etc.) and focused on the same scientific topic.4 Thus a highly cited paper that received more citations than another similar paper (by year, type, and topic) has a percentile value close to zero, while papers that received no citations have percentile values of 100. By using the formula, (100 InCites percentile)/100] a normalized citation impact score per publication was obtained, where 1 has the highest citation impact within its group and 0 has the lowest.5 We calculated the normalized citation impact per grant by adding the normalized impact scores for each of its publications. Our primary grant-based endpoint was normalized citation impact per $million spent. Secondary outcomes included number of publications, normalized citation impact, number of top-10% publications (that is among the top 10% cited stratified by subject, publication year, and article type), number of publication per $million spent, and number of top-10% publications per $million spent.
Statistical Methods
Descriptive statistics for the continuous variables of the project characteristics, such as project duration, total award in million dollars, etc., were presented using quartiles (1st quartile, median, 3rd quartile) and compared using the F-tests for the payline R01s and the ARRA R01s. For categorical variables, such as clinical trials, human and animal research, descriptive statistics were presented using percent and counts and compared using the chi-square tests for the two types of grants. Multivariable linear regression models were used to describe the associations of normalized citation impact per $million spent with grant types (payline R01s vs. ARRA R01s) after accounting for potential grant-based confounders, including peer-review grant percentile ranking (if available), total award in $millions, project duration, involvement of vertebrate animals and/or human research subjects, and performance of a clinical trial and for investigator-based confounders, including early-stage/new-investigator status, prior NIH funding, number of prior NIH grants, time elapsed since main academic degree, and prior service on NIH study sections, special emphasis panels, and advisory councils. To evaluate the potential nonlinear effects of total award (in $million) on the outcome measures of grant productivity, nonparametric regression method based on locally weighted scatterplot smoothing (LOWESS) were used to estimate the mean grant productivity as a smooth function of total award, where natural logarithmic transformations were applied to both the outcome measures of grant productivity and the covariates to reduce skewedness. Graphical methods, such as box plots and scatter plots, were used to present the distributions of grant productivity outcome measures and the LOWESS estimates.
Further analysis of the independent associations of grant types, total awards in million dollars, and other covariates with grant productivity outcome measures was carried out using the machine learning method of Breiman’s random forests.6,7 This analysis was intended to produce a robust, unbiased and flexible assessment of the complex associations, which led to the relative importance of the independent predictors. Statistical results were produced using the R statistical packages RMS, HMisc, GAM, ggplot2, and RandomForestSRC.
Results
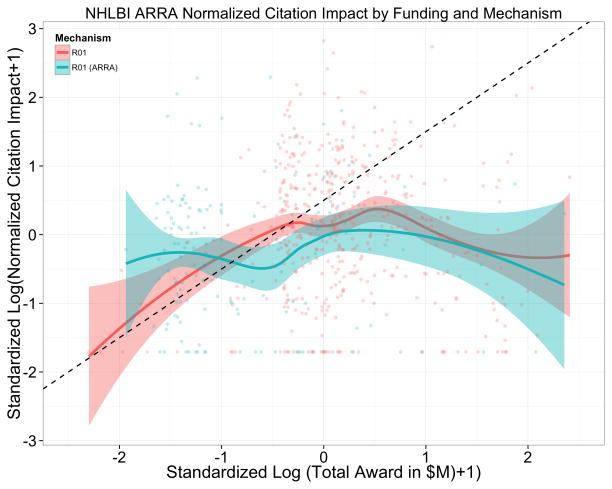
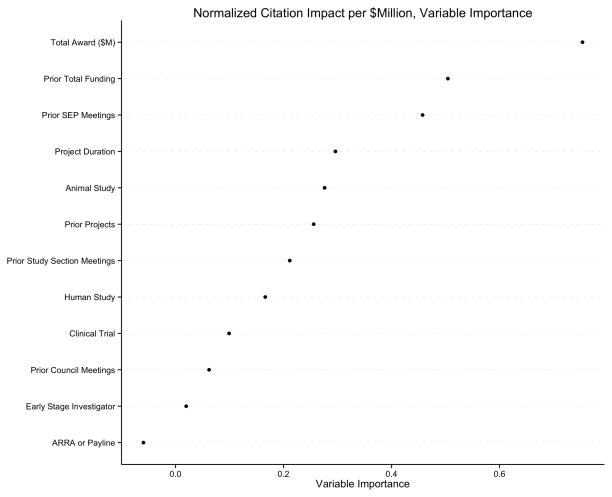
Grant and investigator characteristics of 458 payline R01s and 165 ARRA R01s are shown in Table 1. The ARRA R01s were shorter in duration and lower in budget, but were otherwise similar to the payline R01s. The ARRA R01 grant recipients did not have a prior knowledge of ARRA funding and their original proposals were not tailored to any ARRA funding solicitations. Peer-review grant percentile values were obtained for 549 grants; the remaining 74 grants were reviewed by special study sections and therefore were not assigned a percentile value. The payline R01s yielded 3895 publications and a normalized citation impact of 2586. There were 954 publications (24%) that were “top 10%-publications,” publications that had a citation percentile (stratified by subject, year, and article type) ≤ 10%; there were correspondingly 126 (3.2%) “top-1% publications. The 165 ARRA R01s yielded 996 publications and a normalized citation impact of 651, with 231 (23%) top-10% publications and 24 (2.4%) top 1% publications. Bibliometric outcomes of payline and ARRA R01 grants are shown in Table 2. The payline R01 grants yielded more papers, and had higher normalized citation impacts (Table 2 and Figure 1), but the differences between payline and ARRA R01 grants disappeared when accounting for $million spent (Table 2 and Figures 2–3). In multivariable regression analyses, the mechanism of funding continued to be unrelated to normalized citation impact per $million (P=0.82). By random forest machine learning regression, the grant mechanism (ARRA or payline) was the least important predictor, while the total award amount was the most important predictor (Figure 4).
Table 1.
Grant and percentile characteristics by mechanism
| R01 N = 458 |
R01 (ARRA) N = 165 |
Test Statistic | |
|---|---|---|---|
| Percentile Ranking | 6 10 14 | 20 23 25 | F1,547 = 469, P < 0.0011 |
| Project Duration (Years) | 4.8 4.9 5.0 | 2.8 3.0 3.3 | F1,621 = 300, P < 0.0011 |
| Total Award ($M) | 1.56 1.87 2.29 | 0.83 1.03 1.63 | F1,621 = 171, P < 0.0011 |
| Requested Budget ($M) | 1.8 1.9 2.3 | 1.8 1.9 2.4 | F1,621 = 0.68, P = 0.411 |
| Clinical Trial | 7% (33) | 7% (11) | , P = 0.822 |
| Human Study | 44% (201) | 35% (57) | , P = 0.0372 |
| Animal Study | 64% (293) | 67% (110) | , P = 0.542 |
| Early Stage Investigator | 19% (88) | 9% (15) | , P = 0.0032 |
| Prior Council Meetings | 0 0 0 | 0 0 0 | F1,621 = 0, P = 0.951 |
| Prior Study Section Meetings | 0 3 13 | 0 3 9 | F1,621 = 0.2, P = 0.661 |
| Prior SEP Meetings | 1.0 5.5 12.0 | 2.0 4.0 11.0 | F1,621 = 1.3, P = 0.261 |
| Prior Projects | 1 2 5 | 1 3 4 | F1,621 = 0.15, P = 0.71 |
| Prior Total Funding ($M) | 0.47 1.89 7.96 | 0.61 2.66 8.11 | F1,621 = 0.97, P = 0.331 |
a b c represent the lower quartile a, the median b, and the upper quartile c for continuous variables. There were 623 observations available for all characteristics except for percentile ranking, where 549 observations were available; some grants did not receive percentile rankings per NIH policy. Numbers after percents are frequencies.
Tests used:
Wilcoxon test;
Pearson test
Table 2.
Bibliometric and economic outcomes by mechanism
| R01 N = 458 |
R01 (ARRA) N = 165 |
Test Statistic | |
|---|---|---|---|
| Publications | 3 7 11 | 2 4 8 | F1,621 = 17, P < 0.001 |
| Normalized Citation Impact | 1.59 3.82 7.58 | 0.87 2.84 4.91 | F1,621 = 14, P < 0.001 |
| Top-10% Publications | 0.0 1.0 2.5 | 0.0 0.0 2.0 | F1,621 = 7, P = 0.008 |
| Publications per $M | 1.3 3.3 6.3 | 1.3 3.6 7.2 | F1,621 = 0.64, P = 0.42 |
| Normalized Citation Impact per $M | 0.75 2.03 4.10 | 0.73 2.15 4.68 | F1,621 = 0.27, P = 0.61 |
| Top-10% Publications per $M | 0.00 0.52 1.29 | 0.00 0.00 1.26 | F1,621 = 1.5, P = 0.23 |
a b c represent the lower quartile a, the median b, and the upper quartile c for continuous variables.
Test used: Wilcoxon test.
Figure 1.
Scatter plots with LOWESS smoothers and confidence ranges of normalized citation impact according to total award dollars and grant funding mechanism. Both the X- and Y- axis values are logarithmically transformed and standardized (to allow for meaningful comparisons). The dotted line represents a slope of 1, corresponding to a state in which a standardized unit increase of funding would be associated with a standardized unit increase of citation impact. The slopes < 1 correspond to expected diminishing marginal returns.
Figure 2.
Results of random forest regression showing variable importance values. The most important variable for prediction of normalized citation impact per $million spent was total award; the second most important was an investigator’s prior total funding. The funding mechanism (ARRA or payline) was the least important predictor.
Figure 3.
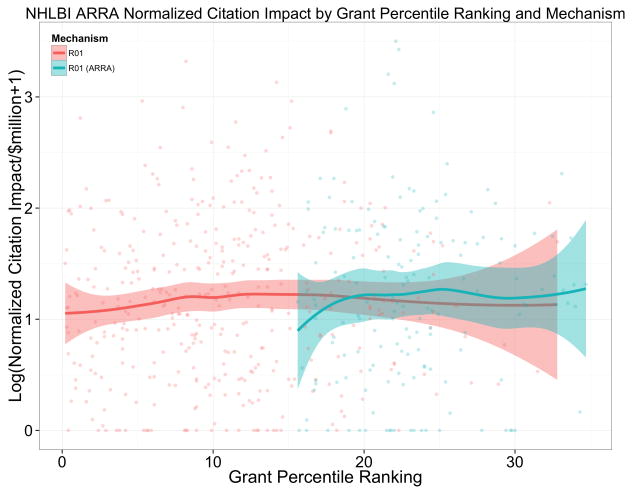
Scatter plots with LOWESS smoothers and confidence ranges of normalized citation impact per $million spent according to grant percentile ranking and grant funding mechanism.
Figure 4.
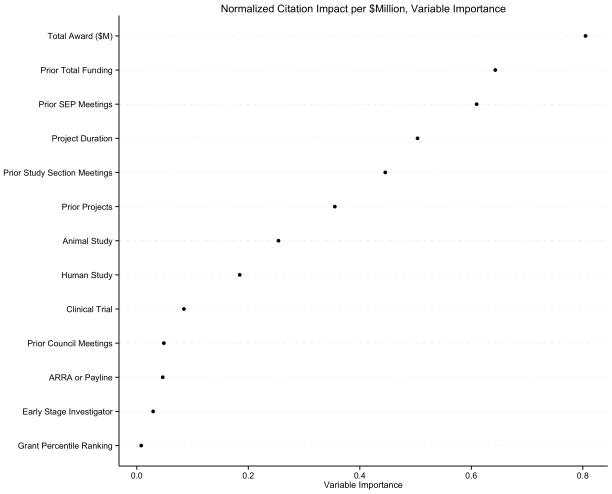
Results of random forest regression showing variable importance values for those grants that received a peer review percentile ranking. The most important variable for prediction of normalized citation impact per $million spent was total award; the second most important was project duration followed by an investigator’s prior total funding. The funding mechanism (ARRA or payline) was the least important predictor.
When we confined our analyses to those grants that were assigned a peer-review percentile ranking, we found that neither the grant mechanism nor the grant percentile ranking were associated with normalized citation impact per $million (Figure 5). By random forest machine learning regression, both of these variables emerged as relatively unimportant predictors (Figure 6).
Discussion
We analyzed the citation impact of NHLBI funded R01s that received funding in FY 2009, the year that the ARRA was passed and implemented. We found that R01s that met the funding guidelines for FY 2009 and were funded with funds from regular appropriations yielded more publications and citation impact than those that were funded using ARRA funds. However, after we accounted for the lower budgets allocated to ARRA R01s, we found that both types of grants yielded similar citation impacts per $million spent. We further found no association between grant percentile ranking and citation impact, confirming our previous findings but on a completely different set of R01 grants.5,8
Park et. al. recently posted a similar analysis comparing outcomes of “regular NIH grants” with “NIH ARRA grants.”3 They found that these two mechanisms yielded similar measures of productivity, which they defined as the number of publications per project, and the respective citations along with the journal impact factor of those publications. While their findings are consistent with ours, there are some important differences. Our analysis focused on R01 grants only and we utilized InCites™, a tool developed by Thomson-Reuters to derive the publication ranking, which is a measure of how often the articles are cited compared with articles that were published in the same year, similar type (review, research, report, book chapter etc.) and similar scientific area. This approach is arguably more robust than a focus on raw publication and citation counts or impact factors, which have been criticized for their failure to account for different publication/citation behaviors varying across scientific disciplines.4 Nonetheless, our findings are consistent with their conclusion that “a dollar increase in public research funding from the current scale would produce an equivalent level of scientific knowledge as a current dollar does.”3
There are some important limitations in our analyses. We only measured citation impact, but did not consider other measures of scientific impact, such as study quality according to other measures, long-term importance of specific discoveries, replication, data sharing, and translation – all measures that deserve attention but were beyond the scope of this study.9 As we have acknowledged before, citation measures reflect only one measure of scientific productivity and impact.5,8 Traditional citation counts have been viewed as suspect, particularly because of their failure to account for highly variable citation behaviors within disciplines (e.g. due to the number of investigators and journals).4 Nonetheless, we did use a measure – normalized citation impact – that accounts for discipline-based variations and that has been considered by external authorities as useful and validated.10 Beyond differences in budget and project duration, we did not consider the specific actions of program staff in post-review reshaping, reshaping that by statute was considerable for the ARRA grants. We also did not consider “non-tangible” inputs into scientific publications.
Despite these limitations, we present evidence that, at least according to the metrics we considered, ARRA enabled NHLBI to support additional R01 grants that were just as productive – in terms of citation impact per dollar – as payline supported R01 grants. This finding may have policy implications and is consistent with Augustine’s contention that “with a mere 0.2% of Gross Domestic Product currently being devoted to federally funded basic research of all kinds … it would seem that we are far from any danger of overinvesting.”11
Supplementary Material
Acknowledgments
We would like to thank Dr. Frank Evans for his assistance with the IMPAC II data collection. We are also grateful to three anonymous peer reviewers for their thoughtful and constructive critiques, which we believe have strengthened the presentation of our work.
Sources of Funding: All authors were full-time employees of NHLBI at the time they worked on this project.
Nonstandard Abbreviations and Acronyms
- ARRA
American Recovery and Reinvestment Act
- LOWESS
locally weighted scatterplot smoothing
- NHLBI
National Heart, Lung, and Blood Institute
- NIH
National Institutes of Health
Footnotes
Disclaimer: The views expressed in this paper are those of the authors and do not necessarily reflect the views of the NHLBI, the NIH, or the US Federal Government.
Disclosure: All authors are full-time employees of the NHLBI and conducted this work as part of their official Federal duties. There are no financial conflicts to report.
References
- 1.Moses H, Dorsey ER. Biomedical research in an age of austerity. JAMA. 2012;308:2341–2. doi: 10.1001/jama.2012.14846. [DOI] [PubMed] [Google Scholar]
- 2.Lauer MS. National Heart, Lung, and Blood Institute and the American Recovery and Reinvestment Act of 2009: 1 year later. J Am Coll Cardiol. 2010;56:234–236. doi: 10.1016/j.jacc.2010.03.042. [DOI] [PubMed] [Google Scholar]
- 3.Park H, Lee J, Kim B. Less bang for the buck? A natural experiment in NIH funding [Internet] 2014 [cited 2014 Dec 17];Available from: http://www.econ.gatech.edu/files/papers/NIHARRA_RP.pdf.
- 4.Bornmann L, Marx W. How good is research really? Measuring the citation impact of publications with percentiles increases correct assessments and fair comparisons. EMBO Rep. 2013;14:226–230. doi: 10.1038/embor.2013.9. [DOI] [PMC free article] [PubMed] [Google Scholar]
- 5.Kaltman JR, Evans FJ, Danthi NS, Wu CO, DiMichele DM, Lauer MS. Prior publication productivity, grant percentile ranking, and topic-normalized citation impact of NHLBI cardiovascular R01 grants. Circ Res. 2014;115:617–24. doi: 10.1161/CIRCRESAHA.115.304766. [DOI] [PMC free article] [PubMed] [Google Scholar]
- 6.Ishwaran H, Kogalur UB, Gorodeski EZ, Minn AJ, Lauer MS. High-dimensional variable selection for survival data. J Am Stat Assoc. 2010;105:205–217. [Google Scholar]
- 7.Gorodeski EZ, Ishwaran H, Kogalur UB, Blackstone EH, Hsich E, Zhang ZM, Vitolins MZ, Manson JE, Curb JD, Martin LW, Prineas RJ, Lauer MS. Use of Hundreds of Electrocardiographic Biomarkers for Prediction of Mortality in Postmenopausal Women The Women’s Health Initiative. Circ Qual Outcomes. 2011;4:521–532. doi: 10.1161/CIRCOUTCOMES.110.959023. [DOI] [PMC free article] [PubMed] [Google Scholar]
- 8.Danthi N, Wu CO, Shi P, Lauer M. Percentile ranking and citation impact of a large cohort of national heart, lung, and blood institute-funded cardiovascular r01 grants. Circ Res. 2014;114:600–606. doi: 10.1161/CIRCRESAHA.114.302656. [DOI] [PMC free article] [PubMed] [Google Scholar]
- 9.Ioannidis JP, Khoury MJ. Assessing value in biomedical research: the PQRST of appraisal and reward. JAMA. 2014;312:483–484. doi: 10.1001/jama.2014.6932. [DOI] [PMC free article] [PubMed] [Google Scholar]
- 10.Informing Research Choices: Indicators and Judgement. The Expert Panel on Science Performance and Research Funding. Ottowa, Canada: Council of Canadian Academies; 2012. [Google Scholar]
- 11.Augustine NR. Is biomedical research a good investment? J Clin Invest. 2014;124:5087–9. doi: 10.1172/JCI79617. [DOI] [PMC free article] [PubMed] [Google Scholar]
Associated Data
This section collects any data citations, data availability statements, or supplementary materials included in this article.


