

Abstract
Site-specific perforation of the plasma membrane can be achieved through ultrasound-triggered cavitation of a single microbubble positioned adjacent to the cell. However, for this perforation approach (sonoporation), the recovery manoeuvres invoked by the cell are unknown. Here, we report new findings on how membrane blebbing can be a recovery manoeuvre that may take place in sonoporation episodes whose pores are of micrometres in diameter. Each sonoporation site was created using a protocol involving single-shot ultrasound exposure (frequency: 1 MHz; pulse length: 30 cycles; peak negative pressure: 0.45 MPa) which triggered inertial cavitation of a single targeted microbubble (diameter: 1–5 µm). Over this process, live confocal microscopy was conducted in situ to monitor membrane dynamics, model drug uptake kinetics and cytoplasmic calcium ion (Ca2+) distribution. Results show that blebbing would occur at a recovering sonoporation site after its resealing, and it may emerge elsewhere along the membrane periphery. The bleb size was correlated with the pre-exposure microbubble diameter, and 99% of blebbing cases at sonoporation sites were inflicted by microbubbles larger than 1.5 µm diameter (analysed over 124 sonoporation episodes). Blebs were not observed at irreversible sonoporation sites or when sonoporation site repair was inhibited via extracellular Ca2+ chelation. Functionally, the bleb volume was found to serve as a buffer compartment to accommodate the cytoplasmic Ca2+ excess brought about by Ca2+ influx during sonoporation. These findings suggest that membrane blebbing would help sonoporated cells restore homeostasis.
Keywords: sonoporation, targeted microbubbles, recovery manoeuvre, membrane blebbing, live confocal imaging
1. Introduction
Since its initial conceptualization, sonoporation has been widely appraised as a novel way of transiently disrupting cell membrane integrity [1,2]. Over the years, it has undergone significant development from an initial proof of concept to a localized membrane perforation technique with spatio-temporal control [3], and it has achieved early success in facilitating drug delivery [4], gene therapy [5], intracellular biomarker extraction [6] and cancer treatment [7]. In fostering localized induction of sonoporation, one technical advance that has played an important role is the advent of targeted microbubbles with binding affinity to antigen receptors on the cell type of interest [8,9], such as vascular endothelial growth factor (VEGF) receptors expressed on cancerous cells [10] or hypoxic endothelial cells [11]. These targeted microbubbles, often composed of a perfluorocarbon gas core encapsulated within an antibody-conjugated shell material [12], are in effect artificial gas bodies that would cavitate in response to ultrasound excitation, which could be as short as a single pulse firing [13]. As their binding is known to persist under shear-flow conditions [14,15], they can effectively reside adjacent to the plasma membrane to locally induce membrane disruption over their course of acoustic cavitation [16,17] and concurrently release drugs which may be preloaded onto the microbubble shell [18].
Alas, amid the technical advances in targeted microbubble design that enabled controlled instigation of sonoporation, the biophysical details involved in this process have remained vaguely understood. At issue is the lack of knowledge on how a cell seeks to recover from sonoporation episodes [19,20], especially those that were triggered locally by the cavitation of microbubbles bordering the plasma membrane. This issue is after all of crucial relevance to the survival of sonoporated cells. Previous findings have reported instances of membrane morphology alterations in cells that were subjected to acoustic cavitation exposure [21–24], but the constitutive processes leading to these alterations have yet to be identified. Perhaps two recovery manoeuvres that may take place during sonoporation are endocytosis-mediated membrane reunion and exocytosis-mediated vesicular patching [25]. The former is suggested to be applicable to nanometre-sized pores [26], while the latter is often invoked in cases with acute calcium ion (Ca2+) influx [27], which would indeed arise during sonoporation [28,29]. However, the caveat in solely relying on these two manoeuvres to underscore the recovery phase of sonoporation is that they cannot serve to explain why significant membrane protrusions were observed in some sonoporated cells [23]. As such, it is conceivable that other forms of morphological remodelling events would take place as a sonoporated cell seeks to repair the cavitation-induced physical discontinuities on its plasma membrane.
In this article, we report new insights into the recovery dynamics in sonoporation by demonstrating membrane blebbing as a possible action in which a sonoporated cell may undertake in its stride to restore plasma membrane integrity. Specifically, our investigation has sought to establish the causality between: (i) individual, site-specific sonoporation episodes induced by ultrasound-triggered collapse of a single targeted microbubble (a terminal feature of inertial cavitation) attached to the plasma membrane and (ii) emergence of blebs at the recovering sonoporation site and at other parts of the plasma membrane. In hypothesizing that blebbing is a sonoporation-related membrane remodelling event, our rationale was twofold. First, as blebs are essentially local herniations on the membrane [30,31], they are seemingly in close resemblance to the protrusive membrane blisters observed in some sonoporated cells [23]. Second, it is recognized that acute disruption of the actin cytoskeleton would favour bleb formation [32], and such disruption would indeed take place during microbubble-mediated sonoporation [33]. Taken together, it is plausible that blebbing may occur as a reactionary manoeuvre in sonoporation episodes, particularly since reparable sonoporation sites can be a few micrometres in size [34] and passive membrane reunion is known to falter under this circumstance [35]. Note that, from a cell biology standpoint, blebbing has conventionally been associated with cell locomotion and cell death [30–32], but recent evidence has shown that this manoeuvre is equally important in helping wounded cells avoid immediate lysis when they were non-specifically attacked by pore-forming toxins [36]. Taking into account the latter notion, we surmise that observing a similar phenomenon in sonoporation is after all not peculiar. Indeed, our current investigation would serve to substantiate the pro-recovery nature of membrane blebbing by providing novel direct observations of bleb formation at recovering membrane wounds that were physically instigated on a site-specific basis via sonoporation.
2. Material and methods
2.1. Experimental hardware
Investigation of the relationship between membrane blebbing and sonoporation was conducted by performing live cell imaging over the course of sonoporation. For this task, we have made use of a customized confocal imaging platform that was assembled recently for another study on sonoporation-induced actin network disruption [33]. As shown in figure 1, the ultrasound exposure apparatus of our experimental platform comprised a cascade of waveform generator (33120A, Agilent Technologies, Santa Clara, CA, USA), broadband amplifier (50 dB gain; 2100L, Electronics and Innovation Ltd, Rochester, NY, USA) and a single-element unfocused piston transducer (1 MHz centre frequency, 25.4 mm effective diameter; Wuxi Beisheng Technology Ltd, Wuxi, Jiangsu, China). Ultrasound pulses emitted from the ultrasound exposure apparatus were passed into a leg-shaped acrylic waveguide that served as a collimating device (1.5 mm wall thickness, 70 mm leg length, 40° leg angle), and the collimated pulses were in turn emitted through the waveguide's cuboid foot base. Placed in contact with the waveguide base was a cassette-shaped cell chamber, whose bottom interface was an acoustically thin glass coverslip (0.13 mm thick) with an enumerated grid (1 × 1 mm box resolution) as a guide for in situ tracking of cell location. During experimentation, cell morphology was observed live using a confocal fluorescence microscopy system (LSM 710, Carl Zeiss, Jena, Germany) and a 40× oil immersion lens (420461-9910, Carl Zeiss).
Figure 1.

The acoustically coupled confocal microscopy platform used for investigation of membrane blebbing during sonoporation. It is a redrawn version of the platform described in [33].
2.2. Ultrasound exposure parameters
In our set-up, ultrasound was applied based on a single-shot pulsing protocol similar to that adopted in other cellular-level studies on sonoporation [13]. The applied pulse was a 30-cycle tone burst with 1 MHz wave frequency (i.e. 30 µs pulse duration). As calibrated previously through hydrophone mapping [33], the collimated acoustic field emerging from the waveguide's cuboid foot was relatively homogeneous along the cell chamber coverslip's axial position (instead of following the typical free-field acoustic pressure profile that is marked by diffraction sidelobes). The acoustic peak negative pressure was measured to be 0.45 MPa in the microscope's field of view. At this pressure level, the targeted microbubbles that we introduced as localized sonoporation agents (details to be described later) would generally collapse for our given applied pulse. Correspondingly, the type of cavitational activity responsible for our sonoporation episodes should belong to the inertial cavitation regime in which jetting is known to occur [37]. It essentially differs from other studies that focused on stable cavitation activities [38].
2.3. Cell culturing protocol
Our sonoporation experiments were conducted on ZR-75–30 human breast carcinoma cells (CCL-1504; ATCC, Manassas, VA, USA) with natural expression of VEGF receptors on their plasma membrane as we have verified previously through immunofluorescence analysis [33]. Incubated inside a culture flask in a 37°C environment (with 5% carbon dioxide), these cells were cultivated using Roswell Park Memorial Institute 1640 medium (R8758; Sigma-Aldrich, St Louis, MO, USA) and 10% fetal bovine serum (30-2020; ATCC, Manassas, VA, USA). Cells growing in exponential phase were harvested from the culture flask and were transferred to the cassette-shaped cell chamber for use in the experiments (working density: 10 000 cells per chamber).
2.4. Fluorescent labelling
2.4.1. Plasma membrane
The plasma membrane of ZR-75–30 cells in the cell chamber was fluorescently labelled using the CellMask Orange dye (C10045; Invitrogen, Carlsbad, CA, USA), which exhibits excitation and emission maxima of 554 nm and 567 nm, respectively. This labelling procedure was done prior to ultrasound exposure and the introduction of microbubbles to the cell chamber. The dye was applied in solution form in which a 2.5 µg ml−1 dye concentration was used. The time allotted for the labelling reaction was 15 min, and it was conducted in a dark environment. Subsequently, the dye solution was washed away using phosphate-buffered saline (PBS).
2.4.2. Cytoplasmic calcium ions
To study whether the relationship between membrane blebbing and sonoporation is associated with Ca2+ kinetics, a subset of experiments was performed under the condition in which the intracellular Ca2+ ions were fluorescently tagged using the Fluo4-AM dye (F14201; Invitrogen), whose excitation and emission maximum are, respectively, at 494 nm and 506 nm. For these experimental trials, Fluo4-AM was loaded into the cell samples before plasma membrane labelling, and it was administered at 1 µg ml−1 dye concentration for 30 min in a dark environment. Uninternalized Fluo4-AM dye was washed away with PBS.
2.5. Attachment of targeted microbubbles to cells
Site-specific instigation of sonoporation episodes was realized through the use of targeted microbubbles with binding preference to VEGF receptors. These microbubbles were 1–5 µm in diameter; their core contained perfluoropropane (C3F8) gas, and their shell was a phospholipid monolayer that consisted of distearoyl phosphocholine (DSPC), polyethylene glycol (PEG) stearate and biotinylated distearoyl phosphoethanolamine (DSPE). In each experimental trial, the microbubbles were added to the cell chamber in mixture form (20 µl; 108 bubbles ml−1 concentration). The cell chamber was then flipped upside down for 1 min to foster binding, and after that, unbound bubbles were washed away using PBS.
Our microbubbles were fabricated in-house using the same methodology as we reported previously [33]. Briefly, the fabrication process involved: (i) creating a phospholipid film comprising DSPC (850365; Avanti Polar Lipids, Alabaster, AL, USA) and DSPE-PEG2000-biotin (880129; Avanti Polar Lipids) at a 95 : 5 molar ratio; (ii) infusing C3F8 gas upon the surface of the hydrated phospholipid film and concurrently sonicating with a sonicator (Model 250, Branson Ultrasonics, Danbury, CT, USA) that was equipped with a 3-mm probe head (cat. no. 101-063-212; Branson Ultrasonics); (iii) stepwise conjugating avidin (A887; Invitrogen) and biotinylated VEGF receptor antibodies (AHG9119; Invitrogen) at a 1 : 1 molar ratio onto the microbubble shell. The size of microbubbles synthesized in each fabrication trial was gauged using a haemocytometer. The binding efficacy of these targeted microbubbles was confirmed as described previously [33]; in general, one targeted microbubble was found to be attached to each ZR-75–30 cell for the loading protocol and concentration that we used.
2.6. Additional pre-imaging cell sample preparations
2.6.1. Application of fluorescent markers as model drug
After microbubble loading but before conducting the imaging experiment, the cell chamber was filled with fresh culture medium containing Sytox-Green markers (S34860; Invitrogen) that served as a model drug to substantiate the prevailing notion that sonoporation can enhance delivery of exogenous substances. Note that this step was not executed in experimental trials that involved Fluo4-AM tagging of intracellular Ca2+ to avoid fluorescent overlap. In terms of its properties, Sytox-Green, with excitation and emission maxima of 504 nm and 523 nm, respectively, is known to be cell impermeant unless the plasma membrane integrity is disrupted. Thus, its synchronized entry into the cytoplasm following single-shot ultrasound exposure can concurrently serve as a tracer to indicate that sonoporation has taken place. In our experiments, this marker was applied at a concentration of 1 µM.
2.6.2. Extracellular calcium ion chelation
As a lateral investigation, a subset of experimental trials was performed without the presence of extracellular Ca2+, which was previously observed to block the initiation of sonoporation site recovery [34]. This side study was intended to delineate whether the suppression of membrane resealing would affect bleb formation. The extracellular Ca2+-free condition was achieved with the use of ethylene glycol tetraacetic acid (E-3889, Sigma-Aldrich), which was added at 5 mM concentration to the cell chamber for 5 min to chemically chelate Ca2+ present in the extracellular space.
2.7. Confocal microscopy procedure
Using our confocal microscopy system, the membrane periphery of cells in the chamber was imaged live in situ over various sonoporation episodes. These wavelengths were used for fluorescence excitation: (i) CellMask Orange (for plasma membrane): 543 nm; (ii) Sytox-Green (for sonoporation tracing) and Fluo4-AM (for intracellular Ca2+ tracking): 488 nm. The detection bands used for the three fluorescent labels were, respectively, 565–640 nm (CellMask) and 495–560 nm (Sytox and Fluo4-AM). Bright field images were taken concurrently to locate the microbubble position on the cell surface.
In each experimental trial, the confocal scan plane was set to the z-axis position that corresponded to the central cross-section of the cell monolayer. Thereafter, single-shot ultrasound exposure was delivered to the cell chamber, and the resulting membrane dynamics were monitored in situ. Depending on the fluorescent labelling applied to a particular sample, the model drug (Sytox) uptake kinetics or the intracellular Ca2+ (Fluo4-AM) dynamics were also tracked concurrently. A pinhole size of 130 µm was used so that the slice thickness (4.6 µm) would encompass the bulk of the cell volume, and the pixel dwell time was set to 1.27 µs. In total, 124 episodes of site-specific sonoporation were imaged at a single-cell level.
In another set of 12 sonoporation episodes, detailed morphological insights were gained by conducting volumetric scanning of the plasma membrane. Specifically, a three-dimensional sweep of the membrane contour before exposure was first acquired by carrying out a series of xy-plane scans at different z-axis positions (with 2 µm z-axis step size) to cover the entire cell volume. A pinhole size of 63 µm was used for these scans, and it in turn yielded an effective xy-plane sectional thickness of 2 µm; the pixel dwell time was set to 2.55 µs. Their membrane dynamics during sonoporation were then tracked using the same imaging protocol as described above; note that, to maintain sufficient imaging frame rate, three-dimensional confocal scans were not conducted during this live monitoring process. At the end of the live observation period, another three-dimensional confocal sweep was conducted to obtain volumetric information about the post-sonoporation membrane morphology.
2.8. Data analysis
For the 12 sonoporation episodes in which we acquired volumetric data, their corresponding image frames were imported into the ImageJ software (v. 1.47n; National Institutes of Health, Bethesda, MD, USA) to analyse various morphological features related to sonoporation and membrane blebbing. In particular, the following parameters were measured using built-in functions in ImageJ: (i) pre-exposure microbubble diameter (based on bright-field signature); (ii) temporal-peak pore diameter (by measuring the gap length of membrane periphery disruption as highlighted by CellMask); (iii) bleb volume at the sonoporation site (from measuring the bleb size in the three-dimensional confocal image volume). Pearson correlation analysis was carried out on these measurements to assess the relationships between: (i) microbubble diameter and bleb volume (association between sonoporation and membrane blebbing); (ii) microbubble diameter and pore diameter (association between the instigation of sonoporation episodes and the size of sonoporation sites). In addition, using the 124 sonoporation episodes in which single-plane membrane dynamics data were available, we tallied the number of occurrences of sonoporation-induced blebbing for different microbubble size groups (eight groups spanning between 1 and 5 µm; each with 0.5 µm range). For this task, the overarching criterion used to classify blebbing is whether a sonoporated cell had exhibited one or more physical protrusions of the membrane periphery over the observation period. Each microbubble size group had at least 10 cells considered (Ngroup ≥ 10).
3. Results
3.1. Direct observation of bleb formation at the sonoporation site
Membrane blebbing was observed in a number of resealed sonoporation sites that were generated on a site-specific basis via the synergized use of targeted microbubbles and single-shot ultrasound exposure (124 sonoporation episodes were analysed in total). Electronic supplementary material, movie S1, shows a representative scenario obtained from a group of six breast carcinoma cells. In this cine loop, the temporal dynamics of the membrane periphery (CellMask fluorescence) of the six cells were tracked from 5 s before exposure to 15 min after exposure. Selected frames of this field of view at various time points are shown in figure 2. As a background observation, it can be noted that adjacent to the pre-exposure microbubble position (present on Cells 1 to 4; see figure 2a), abrupt perturbation of the membrane periphery and localized entry of Sytox-Green (green fluorescence) into the cytoplasm were both apparent immediately after single-shot ultrasound exposure (figure 2b,c). These phenomena represent strong indications that sonoporation have been instigated locally at those places.
Figure 2.

Confocal image set of a six-cell scenario showing membrane blebbing at resealed sonoporation sites (see also electronic supplementary material, movie S1). Cells 1–3 (reversibly sonoporated): one microbubble (MB) attached to their membrane before exposure. Cell 4 (irreversibly sonoporated): two MBs bound before exposure. Cells 5, 6 (unsonoporated): no MB attachment. Image frames are shown for different time points (in mm : ss scale): (a) 00 : 00 (just before ultrasound pulsing); (b) 00 : 01 (first frame after exposure); (c) 00 : 10; (d) 01 : 20; (e) 03 : 00; (f) 06 : 30; (g) 10 : 00; (h) 15 : 00. White and light-blue arrows highlight the first instant in which a bleb had formed at, respectively, the sonoporation site and other places along the membrane. Red and green labels, respectively, show plasma membrane (CellMask) and sonoporation tracer (Sytox Green). They were merged with the corresponding bright field image which depicts the pre-exposure microbubble location.
In electronic supplementary material, movie S1, and figure 2, key observations on sonoporation-induced membrane blebbing can be noted from Cells 1, 2 and 3, each of which had a single targeted microbubble attached to their membrane before ultrasound exposure. In particular, after the respective sonoporation site of these cells had restored its membrane integrity (within 1 min), a bleb in the form of local membrane herniation had emerged shortly thereafter (indicated by white arrows in electronic supplementary material, movie S1, and figure 2c,d). Furthermore, secondary blebs away from the sonoporation site had also emerged at other locations along the cell periphery (see light-blue arrows in electronic supplementary material, movie S1, and figure 2d–h). It should be emphasized that this phenomenon is specific to sonoporation episodes with successful resealing, because such blebs were not found in Cell 4 whose membrane integrity was irreversibly sonoporated by ultrasound-triggered collapse of two targeted microbubbles attached to its membrane (permanent membrane damage was concurrently indicated by the incessant Sytox-Green uptake). Note that the blebs were also not observed in Cells 5 and 6 (with no microbubbles attached) that remained unsonoporated and intact following ultrasound exposure.
3.2. No blebbing at the sonoporation site if extracellular Ca2+ is depleted
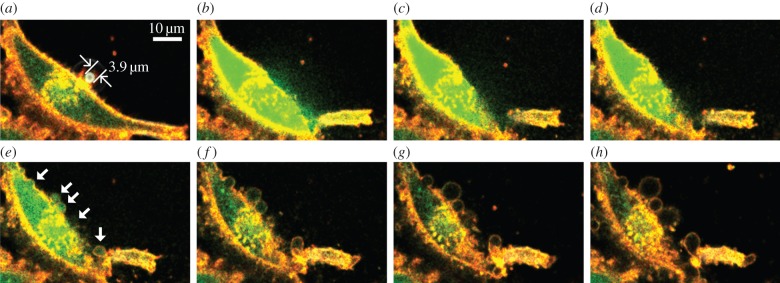
As further evidence of the notion that sonoporation-induced membrane blebbing would only arise in cases with successful resealing, electronic supplementary material, movie S2, shows another sonoporation scenario in which the initiation of membrane recovery was inhibited through extracellular Ca2+ chelation. The corresponding time-series image set is shown in figure 3. In this scenario, one targeted microbubble (4.2 µm in diameter) was attached to the cell edge before exposure (figure 3a). Upon the application of single-shot ultrasound pulsing, membrane disruption was expectedly observed near the pre-exposure microbubble position as labelled in figure 3b. However, the sonoporation site (with 3.9 µm gap size) had remained unsealed over time because of the absence of Ca2+ influx, which is a known condition that would trigger emergency repair of the severed membrane [28,29]. Throughout this period, the membrane periphery did not exhibit bleb-like protrusive morphology (figure 3c–h). Instead, continuous influx of sonoporation tracer (Sytox Green) can be observed through the sonoporation site, and outflux of cytoplasmic contents can be noted sporadically.
Figure 3.

Membrane morphology of a sonoporated cell with resealing failure due to the absence of extracellular Ca2+ (see also electronic supplementary material, movie S2). A series of eight image frames are shown for these time points: (a) 00 : 00 (just before ultrasound pulsing); (b) 00 : 05; (c) 00 : 20; (d) 00 : 40; (e) 01 : 00; (f) 02 : 00; (g) 05 : 00; (h) 10 : 00. Sonoporation site position is annotated by white arrow. Red: CellMask (plasma membrane); green: Sytox (sonoporation tracer); greyscale: bright field (microbubble signature). Blebbing was not observed, while continuous influx of sonoporation tracer was apparent.
3.3. Volumetric rendering of bleb size at the sonoporation site
The membrane blebs induced by microbubble-mediated sonoporation was found to span a volume that was significantly larger than the pre-exposure microbubble size. Figure 4a,b illustrates this finding through a three-dimensional rendering of the plasma membrane in the form of maximum intensity projections along the xy, xz and yz planes, as obtained from a stack of confocal images acquired over multiple z-axis positions. Results for two time points are shown: (i) before single-shot ultrasound exposure (figure 4a) and (ii) at 10 min after exposure (figure 4b). Note that two cells are shown in this field of view: one with sonoporation that was triggered by a 3.8-µm-diameter microbubble resting on the membrane surface before ultrasound pulsing, and another that remains unsonoporated. It can be observed that for the sonoporated cell (indicated by cytoplasmic presence of Sytox-Green; yellow colour coded after merging with red CellMask membrane fluorescence), a significant bleb had emerged at the pre-exposure microbubble position, and its size was 24 µm in apical height and 22 µm in diameter (figure 4b). This feature was not observed in the unsonoporated cell. Figure 4c shows a top-view volumetric rendering of the sonoporated cell's plasma membrane. As illustrated, the bleb at the sonoporation site essentially encompassed a significant fraction of the cell surface, and its morphology was largely hemispherical in nature.
Figure 4.

Three-dimensional confocal rendering of plasma membrane (red) blebbing due to microbubble-mediated sonoporation. Maximum intensity projection images along three planes (xy, xz and yz) are shown (a) before and (b) 10 min after sonoporation for two cells: an unsonoporated cell (left) and a cell sonoporated by ultrasound-triggered microbubble collapse (right). Sytox-Green was used as tracer to label the sonoporated cell (giving yellow cytoplasmic fluorescence when merged with red membrane colour). (c) Volumetric rendering of the membrane bleb at the sonoporation site (top-down view). The bleb occupied a significant volume of the sonoporated cell.
3.4. Correlation between pre-exposure microbubble size and bleb size at the sonoporation site
Through conducting a statistical analysis over multiple sonoporation episodes, we found a positive correlation between the pre-exposure microbubble diameter and the volume of the membrane bleb at the sonoporation site. As illustrated in figure 5a, the correlation coefficient between these two physical size quantities was found to be 0.8075 (N = 12). This phenomenon can well be explained by noting that larger microbubbles tend to generate larger sonoporation sites. Supporting data are shown in figure 5b which plots the positive correlation between microbubble diameter and temporal-peak pore diameter of the sonoporation site (R = 0.8619 for N = 12). It is worth pointing out that membrane blebbing tends to be instigated by larger microbubbles. Table 1 summarizes this finding by listing, for 124 site-specific sonoporation episodes, the ratio between the number of blebbing cases (Nbleb) and the number of cells (Ngroup) in different microbubble size groups ranging between 1 and 5 µm (in 0.5 µm increments). In total, blebbing was observed in 96 of these sonoporation episodes (77.4%), and this phenomenon became prevalent for microbubble diameters larger than 3.0 µm (all cells in those groups had blebbed). Moreover, 99% of the sonoporation-induced blebbing cases were attributed to microbubbles with larger than 1.5 µm diameter.
Figure 5.
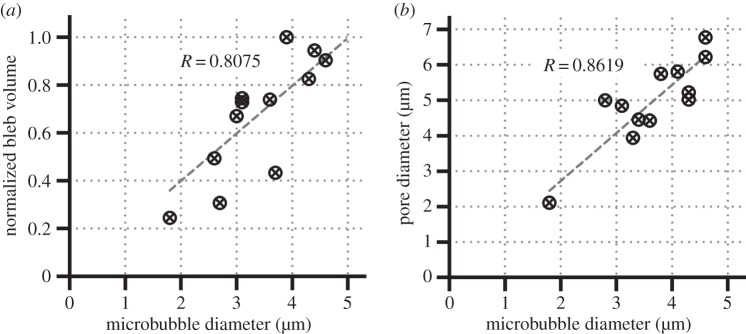
Correlation plots showing the causal relationship between: (a) microbubble diameter (parameter for instigation of sonoporation episodes) and normalized bleb volume at the sonoporation site (morphological feature of membrane blebs); (b) microbubble diameter and pore diameter (morphological feature of sonoporation sites). Pearson correlation coefficients are also indicated (N = 12).
Table 1.
Blebbing probability for different microbubble size groups. (Ngroup = number of cells in the group; Nbleb = number of blebbing cases).
| microbubble diameter (µm) | Nbleb/Ngroup | % of total blebbing cases |
|---|---|---|
| 1.0–1.5 | 1/10 | 1.0 |
| >1.5–2.0 | 6/15 | 6.3 |
| >2.0–2.5 | 20/28 | 20.8 |
| >2.5–3.0 | 16/18 | 16.7 |
| >3.0–3.5 | 16/16 | 16.7 |
| >3.5–4.0 | 17/17 | 17.7 |
| >4.0–4.5 | 10/10 | 10.4 |
| >4.5–5.0 | 10/10 | 10.4 |
| total | 96/124 | 100.0 |
3.5. Functional role of membrane blebbing in post-sonoporation recovery
As a functional insight into how membrane blebbing would foster cellular recovery from a sonoporation episode, electronic supplementary material, movie S3, shows a cine loop on the cytoplasmic Ca2+ distribution (Fluo4-AM fluorescence) within a sonoporated cell as a function of time, and the representative frames of this scenario are summarized in figure 6. Similar to Cells 1 to 3 shown in figure 2, membrane disruption can be observed in the cell shown in electronic supplementary material, movie S3, immediately after single-shot ultrasound exposure (see also figure 6b). Over this process, Ca2+ influx was evident as indicated by the significant increase in cytoplasmic Fluo4-AM fluorescence (figure 6b–d), and it is after all expected as Ca2+ influx is known to take place during sonoporation [28,29]. When membrane blebbing began to emerge at the sonoporation site and elsewhere along the membrane periphery (starting at around 20 s after ultrasound pulsing; see white arrows in figure 6e), two observations of interest regarding intracellular Ca2+ dynamics can be noted. First, intracellular Ca2+ had concurrently filled the resulting bleb volume, as reflected by the high local Fluo4-AM fluorescence inside the bleb compartment immediately upon its formation (figure 6e,f). Second, over the course of time, the intra-bleb Ca2+ level had seemingly dissipated at a rate similar to the cytoplasmic Ca2+ level. In particular, Fluo4-AM fluorescence within the bleb and the cytoplasm had both decreased to the baseline level after 3 min (figure 6g,h). On the whole, these two observations indicate that, while the cell attempted to restore Ca2+ homeostasis after sonoporation, the bleb had functionally served as a physical buffer zone to help the cell to accommodate the anomalous amount of Ca2+ that had accumulated in the cytoplasm as a result of sonoporation-induced Ca2+ influx.
Figure 6.
Intracellular Ca2+ dynamics during a microbubble-mediated sonoporation episode (see also electronic supplementary material, movie S3). Ca2+ distribution within the cytoplasm (green; Fluo4-AM), membrane periphery (orange; CellMask), and microbubble bright-field signature are shown for eight different time points: (a) 00 : 00 (just before ultrasound pulsing); (b) 00 : 01; (c) 00 : 03; (d) 00 : 08; (e) 00 : 22; (f) 01 : 15; (g) 03 : 00; (h) 10 : 00. Rapid influx of Ca2+ was evident, and they were distributed to the bleb compartments that were concurrently formed (marked by white arrows in (e)). Subsequently, the intra-bleb Ca2+ had dissipated to the pre-exposure baseline level at a similar rate as that in the cytoplasm.
4. Discussion and conclusion
4.1. Sonoporation-induced membrane blebbing: summative recap
How cells strive to restore plasma membrane integrity in a sonoporation episode is an important question that has remained unanswered hitherto. While direct observations of sonoporation site closure have been reported [34], the mechanistic steps involved in the process are still unknown with the exception of a few hypotheses based on site patching and membrane self-reunion arguments [25]. In this work, we have gained insight into the recovery dynamics in sonoporation episodes that were generated by inertial cavitation of targeted microbubbles. Central to our investigation is the use of a previously established experimental protocol that allowed us to identify the in situ position of sonoporation sites via the tracking of the pre-exposure targeted microbubble location [33]. Using this protocol, a new series of direct observations has been acquired on possible membrane-level events that may take place at sonoporation sites after their resealing. Results have generally illustrated that membrane blebbing in the form of physical herniations may emerge in the recovery phase of sonoporation episodes.
At a single-cell level, a number of salient findings are worth highlighting in our experiments. First, blebbing was found to occur at the sonoporation site after its initial resealing, and it may also emerge at other places along the membrane periphery (Cells 1 to 3 in electronic supplementary material, movie S1, and figure 2). This morphological feature may well explain why physical protrusions may arise on the membrane of cells that were exposed to acoustic cavitation instigated on a non-specific basis [23]. Another finding to be noted is that membrane blebbing was seemingly specific to sonoporation sites that could undergo successful repair, as irreversibly punctured sites (Cell 4 in electronic supplementary material, movie S1, and figure 2) and inhibition of sonoporation site repair via extracellular Ca2+ chelation (electronic supplementary material, movie S2, and figure 3) had both suppressed bleb formation. Correspondingly, it can be inferred that blebbing is after all related to a cell's recovery manoeuvre during a sonoporation episode. In terms of the size of sonoporation-induced membrane blebs, which are essentially volumetric in nature (figure 4), it was generally found to be correlated with the size of the microbubble responsible for inflicting the sonoporation episode (figure 5a). Also, over 124 sonoporation episodes, most of the blebbing cases (99%) were seemingly inflicted by microbubbles larger than 1.5 µm diameter (table 1). This trend suggests that blebbing is more likely to form at large sonoporation sites (up to 6.8 µm pore diameter in our experiments; figure 5b).
4.2. Biophysical postulate of sonoporation-induced membrane blebbing
Perhaps one fundamental question worth pondering is why blebbing may occur during sonoporation when the perforation site is large. From a biophysical perspective, this phenomenon may be attributed to two factors. The first pertains to the cytostructural dynamics of a sonoporated cell. It is known that, when sonoporation is instigated, there is concomitant rupturing of the actin cytoskeleton network that is physically interconnected with the plasma membrane [33]. Although membrane integrity may be restored within tens of seconds, actin disassembly may persist, and this would promote an increase in the local hydrostatic pressure because of the resulting sparser cytoskeleton scaffold [30–32]. Consequently, the membrane of the newly resealed sonoporation site would reactively be pinched outward in attempt to restore pressure equilibrium. Note that sonoporation-induced actin network disruption may not necessarily be a localized phenomenon and may propagate to the entire cell over time [33]. As such, it is not unreasonable to expect that secondary blebs may emerge at other places along a sonoporated cell's membrane periphery (i.e. away from the sonoporation site).
We postulate that the second factor as to why sonoporation-induced membrane blebbing may take place is because of the activation of a cytoprotective response. As reported in the cell biology literature, blebbing is a manoeuvre that may help an injured cell resist against immediate lysis [36]. Our experiments have suggested that the intra-bleb volume, which is essentially created through an outward pinching of the membrane, would fulfil such a cytoprotective function by physically serving as a buffer compartment to accommodate the high cytoplasmic Ca2+ level brought about by the Ca2+ influx during sonoporation (electronic supplementary material, movie S3, and figure 6). This Ca2+ buffer zone functionality would persist while the sonoporated cell attempts to restore homeostasis by draining excessive Ca2+ from the cytoplasm. Taken together with earlier findings that showed how transient disruption of membrane integrity via sonoporation may trigger cellular stress activation [39,40], one may deduce that blebbing is after all part of a sonoporated cell's anti-stress machinery.
4.3. Perspectives for further investigation
Unravelling the processes pertinent to sonoporation site closure are undoubtedly relevant to scenarios involving the use of targeted microbubbles, because the resulting cavitational impact incited during ultrasound exposure would be discharged first-hand to the plasma membrane [16,17]. On the other hand, it is also worth investigating the course of recovery action involved in sonoporation episodes instigated by: (i) ultrasound-triggered cavitation of microbubbles that are positioned at a distance away from the plasma membrane and (ii) stable cavitation in which microbubble oscillation is the defining feature (rather than microbubble collapse as is the case in inertial cavitation). For these investigations, it is essential to make use of meticulous instruments to control the relative distance between the microbubble and the plasma membrane, such as optical tweezers [41–43] or the combined use of laser optics and acoustic radiation force [44]. We hypothesize that, under both scenarios, blebbing at the sonoporation site may not necessarily occur because the cavitational impact that reached the plasma membrane would consequently be tapered. Instead, less rigorous manoeuvres may be triggered to restore cellular homeostasis.
On a related topic, it would be of interest to consider whether and how membrane recovery would take place in more intricate sonoporation scenarios. One particular case worth analysing is the scenario where concurrent induction of multiple sonoporation episodes would occur on the same cell via the cavitation of multiple microbubbles. An example of such case is that of Cell 4 depicted in electronic supplementary material, movie S1, and figure 2. In this multi-site sonoporation example, membrane resealing did not occur, and the cell had seemingly become non-viable. To generalize such an observation, it would be beneficial to study the membrane impact of different parameters related to multi-site sonoporation, including the number, size and positioning of microbubbles attached to the cell. Doing so would render new insight on why the use of bubble-to-cell ratios greater than unity for sonoporation purposes has been shown to increase the chances of cell death [45]. Note that the recovery dynamics of sonoporation may be different when using non-tone-burst ultrasound pulsing waveforms, such as chirps [46]. It would be relevant to survey this issue as well.
A further avenue of investigation worth pursuing is to connect our observations with theoretical biophysics models that describe plasma membrane behaviour during ultrasound exposure [47,48]. The pursuit of this foundational study would provide us with a more predictive account of the biophysical conditions under which blebbing would occur at sonoporation sites. In turn, it would create new knowledge on the mechanistic foundations of sonoporation. Such knowledge would be practically relevant to ongoing application development efforts that seek to leverage sonoporation to intentionally disrupt the plasma membrane for therapeutic purposes, such as the delivery of drugs and genes into cells.
Acknowledgements
The authors are grateful to Dr Xian Chen and Mr Billy Y. S. Yiu for their technical assistance.
Funding statement
This investigation has been funded in part by the Hong Kong Innovation and Technology Fund (ITS/292/11) and the University of Hong Kong (201111159091).
References
- 1.Mehier-Humbert S, Guy RH. 2005. Physical methods for gene transfer: improving the kinetics of gene delivery into cells. Adv. Drug Deliv. Rev. 57, 733–753. ( 10.1016/j.addr.2004.12.007) [DOI] [PubMed] [Google Scholar]
- 2.Villemejane J, Mir LM. 2009. Physical methods of nucleid acid transfer: general concepts and applications. Brit. J. Pharmacol. 157, 207–219. ( 10.1111/j.1476-5381.2009.00032.x) [DOI] [PMC free article] [PubMed] [Google Scholar]
- 3.Fan Z, Liu H, Mayer M, Deng CX. 2012. Spatiotemporally controlled single cell sonoporation. Proc. Natl Acad. Sci. USA 109, 16 486–16 491. ( 10.1073/pnas.1208198109) [DOI] [PMC free article] [PubMed] [Google Scholar]
- 4.Castle J, Butts M, Healey A, Kent K, Marino M, Feinstein SB. 2013. Ultrasound-mediated targeted drug delivery: recent success and remaining challenges. Am. J. Physiol. Heart Circ. Physiol. 304, H350–H357. ( 10.1152/ajpheart.00265.2012) [DOI] [PubMed] [Google Scholar]
- 5.Escoffre JM, Zeghimi A, Novell A, Bouakaz A. 2013. In-vivo gene delivery by sonoporation: recent progress and prospects. Curr. Gene Ther. 13, 2–14. ( 10.2174/156652313804806606) [DOI] [PubMed] [Google Scholar]
- 6.Forbrich A, Paproski R, Hitt M, Zemp R. 2013. Microbubble-enhanced ultrasound liberation of mRNA biomarkers in vitro. Ultrasound Med. Biol. 39, 1087–1093. ( 10.1016/j.ultrasmedbio.2012.12.015) [DOI] [PubMed] [Google Scholar]
- 7.Ibsen S, Schutt CE, Esener S. 2013. Microbubble-mediated ultrasound therapy: a review of its potential in cancer treatment. Drug Design Dev. Ther. 7, 375–388. ( 10.2147/DDDT.S31564) [DOI] [PMC free article] [PubMed] [Google Scholar]
- 8.Kiessling F, Fokong S, Koczera P, Lederle W, Lammers T. 2012. Ultrasound microbubbles for molecular diagnosis, therapy, and theranostics. J. Nucl. Med. 53, 345–348. ( 10.2967/jnumed.111.099754) [DOI] [PubMed] [Google Scholar]
- 9.Sirsi SR, Borden MA. 2012. Advances in ultrasound mediated gene therapy using microbubble contrast agents. Theranostics 2, 1208–1222. ( 10.7150/thno.4306) [DOI] [PMC free article] [PubMed] [Google Scholar]
- 10.Carmeliet P. 2005. VEGF as a key mediator of angiogenesis in cancer. Oncology 69(Suppl. 3), 4–10. ( 10.1159/000088478) [DOI] [PubMed] [Google Scholar]
- 11.Michels C, Arnould T, Remacle J. 2000. Endothelial cell responses to hypoxia: initiation of a cascade of cellular interactions. Biochim. Biophys. Acta 1497, 1–10. ( 10.1016/S0167-4889(00)00041-0) [DOI] [PubMed] [Google Scholar]
- 12.Klibanov AL. 2006. Microbubble contrast agents: targeted ultrasound imaging and ultrasound-assisted drug-delivery applications. Invest. Radiol. 41, 354–362. ( 10.1097/01.rli.0000199292.88189.0f) [DOI] [PubMed] [Google Scholar]
- 13.Kudo N, Okada K, Yamamoto K. 2009. Sonoporation by single-shot pulsed ultrasound with microbubbles adjacent to cells. Biophys. J. 96, 4866–4876. ( 10.1016/j.bpj.2009.02.072) [DOI] [PMC free article] [PubMed] [Google Scholar]
- 14.Takalkar AM, Klibanov AL, Rychak JJ, Lindner JR, Ley K. 2004. Binding and detachment dynamics of microbubbles targeted to P-selectin under controlled shear flow. J. Control. Release 96, 473–482. ( 10.1016/j.jconrel.2004.03.002) [DOI] [PubMed] [Google Scholar]
- 15.Klibanov AL, Rychak JJ, Yang WC, Alikhani S, Li B, Acton S, Lindner JR, Ley K, Kaul S. 2006. Targeted ultrasound contrast agent for molecular imaging of inflammation in high-shear flow. Contrast Media Mol. Imaging 1, 259–266. ( 10.1002/cmmi.113) [DOI] [PubMed] [Google Scholar]
- 16.Kooiman K, Foppen-Harteveld M, van der Steen AFW, de Jong N. 2011. Sonoporation of endothelial cells by vibrating targeted microbubbles. J. Control. Release 154, 35–41. ( 10.1016/j.jconrel.2011.04.008) [DOI] [PubMed] [Google Scholar]
- 17.Kooiman K, Vos R, Versluis M, de Jong N. 2014. Acoustic behavior of microbubbles and implications for drug delivery. Adv. Drug Deliv. Rev. 72, 28–48. ( 10.1016/j.addr.2014.03.003) [DOI] [PubMed] [Google Scholar]
- 18.Luan Y, Lajoinie G, Gelderblom E, Skachkov I, van der Steen A, Vos HJ, Versluis M, de Jong N. 2014. Lipid shedding from single oscillating microbubbles. Ultrasound Med. Biol. 40, 1834–1846. ( 10.1016/j.ultrasmedbio.2014.02.031) [DOI] [PubMed] [Google Scholar]
- 19.Campbell P, Prausnitz MR. 2007. Future directions for therapeutic ultrasound. Ultrasound Med. Biol. 33, 657 ( 10.1016/j.ultrasmedbio.2006.11.001) [DOI] [PMC free article] [PubMed] [Google Scholar]
- 20.Yu H, Xu L. 2014. Cell experimental studies on sonoporation: state of the art and remaining problems. J. Control. Release 174, 151–160. ( 10.1016/j.jconrel.2013.11.010) [DOI] [PubMed] [Google Scholar]
- 21.Schlicher RK, Radhakrishna H, Tolentino TP, Apkarian RP, Zarnitsyn V, Prausnitz MR. 2006. Mechanism of intracellular delivery by acoustic cavitation. Ultrasound Med. Biol. 32, 915–924. ( 10.1016/j.ultrasmedbio.2006.02.1416) [DOI] [PubMed] [Google Scholar]
- 22.Zhao YZ, Luo YK, Lu CT, Xu JF, Tang J, Zhang M, Zhang Y, Liang HD. 2008. Phospholipids-based microbubbles sonoporation pore size and reseal of cell membrane cultured in vitro. J. Drug Target 16, 18–25. ( 10.1080/10611860701637792) [DOI] [PubMed] [Google Scholar]
- 23.Schlicher RK, Hutcheson JD, Radhakrishna H, Apkarian RP, Prausnitz MR. 2010. Changes in cell morphology due to plasma membrane wounding by acoustic cavitation. Ultrasound Med. Biol. 36, 677–692. ( 10.1016/j.ultrasmedbio.2010.01.010) [DOI] [PMC free article] [PubMed] [Google Scholar]
- 24.Zeghimi A, Uzbekov R, Arbeille B, Escoffre JM, Bouakaz A. 2012. Ultrastructural modifications of cell membranes and organelles induced by sonoporation. Proc. IEEE Ultrason. Symp., 2045–2048. [Google Scholar]
- 25.Lentacker I, de Cock I, Deckers R, de Smedt SC, Moonen CTW. 2014. Understanding ultrasound induced sonoporation: definitions and underlying mechanisms. Adv. Drug Deliv. Rev. 72, 49–64. ( 10.1016/j.addr.2013.11.008) [DOI] [PubMed] [Google Scholar]
- 26.Chernomordik LV, Kozlov MM. 2008. Mechanics of membrane fusion. Nat. Struct. Mol. Biol. 15, 675–683. ( 10.1038/nsmb.1455) [DOI] [PMC free article] [PubMed] [Google Scholar]
- 27.McNeil PL, Kirchhausen T. 2005. An emergency response team for membrane repair. Nat. Rev. Mol. Cell Biol. 6, 499–505. ( 10.1038/nrm1665) [DOI] [PubMed] [Google Scholar]
- 28.Fan Z, Kumon RE, Park J, Deng CX. 2010. Intracellular delivery and calcium transients generated in sonoporation facilitated by microbubbles. J. Control. Release 142, 31–39. ( 10.1016/j.jconrel.2009.09.031) [DOI] [PMC free article] [PubMed] [Google Scholar]
- 29.Hassan MA, Campbell P, Kondo T. 2010. The role of Ca2+ in ultrasound-elicited bioeffects: progress, perspectives and prospects. Drug Discov. Today 15, 892–906. ( 10.1016/j.drudis.2010.08.005) [DOI] [PubMed] [Google Scholar]
- 30.Charras GT. 2008. A short history of blebbing. J. Microsc. 231, 466–478. ( 10.1111/j.1365-2818.2008.02059.x) [DOI] [PubMed] [Google Scholar]
- 31.Charras GT, Coughlin M, Mitchison TJ, Mahadevan L. 2008. Life and times of a cellular bleb. Biophys. J. 94, 1836–1853. ( 10.1529/biophysj.107.113605) [DOI] [PMC free article] [PubMed] [Google Scholar]
- 32.Paluch E, Piel M, Prost J, Bornens M, Sykes C. 2005. Cortical actomyosin breakage triggers shape oscillations in cells and cell fragments. Biophys. J. 89, 724–733. ( 10.1529/biophysj.105.060590) [DOI] [PMC free article] [PubMed] [Google Scholar]
- 33.Chen X, Leow RS, Hu Y, Wan JMF, Yu ACH. 2014. Single-site sonoporation disrupts actin cytoskeleton organization. J. R. Soc. Interface 11, 20140071 ( 10.1098/rsif.2014.0071) [DOI] [PMC free article] [PubMed] [Google Scholar]
- 34.Hu Y, Wan JMF, Yu ACH. 2013. Membrane perforation and recovery dynamics in microbubble-mediated sonoporation. Ultrasound Med. Biol. 39, 2393–2405. ( 10.1016/j.ultrasmedbio.2013.08.003) [DOI] [PubMed] [Google Scholar]
- 35.McNeil PL, Vogel SS, Miyake K, Terasaki M. 2000. Patching plasma membrane disruptions with cytoplasmic membrane. J. Cell Sci. 113, 1891–1902. [DOI] [PubMed] [Google Scholar]
- 36.Babiychuk EB, Monastyrskaya K, Potez S, Draeger A. 2011. Blebbing confers resistance against cell lysis. Cell Death Diff. 18, 80–89. ( 10.1038/cdd.2010.81) [DOI] [PMC free article] [PubMed] [Google Scholar]
- 37.Ohl SW, Klaseboer E, Khoo BC. 2009. The dynamics of a non-equilibrium bubble near bio-materials. Phys. Med. Biol. 54, 6313–6336. ( 10.1088/0031-9155/54/20/019) [DOI] [PubMed] [Google Scholar]
- 38.Delalande A, Kotopoulis S, Rovers T, Pichon C, Postema M. 2011. Sonoporation at a low mechanical index. Bubble Sci. Eng. Tech. 3, 3–11. ( 10.1179/1758897911Y.0000000001) [DOI] [Google Scholar]
- 39.Chen X, Wan JMF, Yu ACH. 2013. Sonoporation as a cellular stress: induction of morphological repression and developmental delays. Ultrasound Med. Biol. 39, 1075–1086. ( 10.1016/j.ultrasmedbio.2013.01.008) [DOI] [PubMed] [Google Scholar]
- 40.Zhong W, Chen X, Jiang P, Wan JMF, Qin P, Yu ACH. 2013. Induction of endoplasmic reticulum stress by sonoporation: linkage to mitochondria-mediated apoptosis initiation. Ultrasound Med. Biol. 39, 2382–2392. ( 10.1016/j.ultrasmedbio.2013.08.005) [DOI] [PubMed] [Google Scholar]
- 41.Garbin V, Cojoc D, Ferrari E, Di Fabrizio E, Overvelde ML, van der Meer SM, de Jong N, Lohse D, Versluis M. 2007. Changes in microbubble dynamics near a boundary revealed by combined optical micromanipulation and high-speed imaging. Appl. Phys. Lett. 90, 114103 ( 10.1063/1.2713164) [DOI] [Google Scholar]
- 42.Kudo N, Tanaka Y, Uchida K. 2013. Basic studies on sonoporation with size- and position-controlled microbubbles adjacent to cells. Proc. IEEE Ultrason. Symp., 53–56. [Google Scholar]
- 43.Acconcia C, Leung BYC, Manjunath A, Goertz DE. 2014. Interactions between ultrasound-stimulated microbubbles and fibrin clots. Ultrasound Med. Biol. 40, 2134–2150. ( 10.1016/j.ultrasmedbio.2014.03.008) [DOI] [PubMed] [Google Scholar]
- 44.Zhou Y, Yang K, Cui J, Ye JY, Deng CX. 2012. Controlled permeation of cell membrane by single bubble acoustic cavitation. J. Control. Release 157, 103–111. ( 10.1016/j.jconrel.2011.09.068) [DOI] [PMC free article] [PubMed] [Google Scholar]
- 45.Guzman HR, McNamara AJ, Nguyen DX, Prausnitz MR. 2003. Bioeffects caused by changes in acoustic cavitation bubble density and cell concentration: a unified explanation based on cell-to-bubble ratio and blast radius. Ultrasound Med. Biol. 29, 1211–1222. ( 10.1016/S0301-5629(03)00899-8) [DOI] [PubMed] [Google Scholar]
- 46.McLaughlan J, Ingram N, Smith PR, Harput S, Coletta PL, Evans S, Freear S. 2013. Increasing the sonoporation efficiency of targeted polydisperse microbubble populations using chirp excitation. IEEE Trans. Ultrason. Ferroelec. Freq. Contr. 60, 2511–2520. ( 10.1109/TUFFC.2013.2850) [DOI] [PubMed] [Google Scholar]
- 47.Zinin PV, Allen JS., III 2009. Deformation of biological cells in the acoustic field of an oscillating bubble. Phys. Rev. E 79, 021910 ( 10.1103/PhysRevE.79.021910) [DOI] [PMC free article] [PubMed] [Google Scholar]
- 48.Krasovitski B, Frenkel V, Shoham S, Kimmel E. 2011. Intramembrane cavitation as a unifying mechanism for ultrasound-induced bioeffects. Proc. Natl Acad. Sci. USA 108, 3258–3263. ( 10.1073/pnas.1015771108) [DOI] [PMC free article] [PubMed] [Google Scholar]