Abstract
Limited drug distribution is partially responsible for the efficacy gap between preclinical and clinical studies of nano-sized drug carriers for cancer therapy. In this study, we examined the transport behavior of cationic micelles formed from a triblock copolymer of poly(D,L-lactide-co-glycolide)-block-branched polyethyleneimine-block-poly(D,L-lactide-co-glycolide) using a unique in vitro tumor model composed of a multilayered cell culture (MCC) and an Ussing chamber system. The Cy3-labeled cationic micelles showed remarkable Cy3 distribution in the MCC whereas charge-shielded micelles with a poly(ethylene glycol) surface accumulated on the surface of the MCC. Penetration occurred against convectional flow caused by a hydraulic pressure gradient. The study using fluorescence resonance energy transfer (FRET) showed that the cationic micelles dissociate at the interface between the culture media and the MCC or possibly inside of the first-layer cells and penetrates into the MCC as unimers. The penetration and distribution were energy-dependent and suppressed by various endocytic inhibitors. These suggest that cationic unimers mainly utilized clathrin-mediated endocytosis and macropinocytosis for cellular entry and a significant fraction were exocytosed by an unknown mechanism.
Keywords: intratumoral distribution, penetration, multilayered cell culture, micelle, cationic surface, endocytosis
1. Introduction
A handful of intravenously injectable nano-sized drug carriers including liposomes and polymeric micelles, are currently in clinical use for cancer treatment [1,2]. The carriers are expected to improve drug solubility, pharmacokinetics and toxicity profiles; however, in contrast to the promising preclinical results of anti-tumor activity in small animal models, clinical efficacy has not proven to be as significant as anticipated [3–5]. Limited intratumoral distribution of nanoparticles could be partly responsible for the gap between preclinical and clinical outcomes[6,7]. The mobility of nanoparticles in solid tumors is intrinsically limited by their large size, interactions with biological components, and physical barriers of the extracellular matrix [8,9]. In tumor tissues, excess leakage from blood vessel and nonfunctional lymphatic vessels are thought to induce the enhanced permeability and retention (EPR) effect [10]. On the other hand, these same factors contribute to elevated interstitial fluid pressure (IFP), which can hinder nanoparticle penetration. The hydraulic pressure gradient between the core and periphery of a tumor induces convective flow to proximal blood vessels and surrounding normal tissue where functional lymphatic vessels are present [11,12]. Nanoparticles that extravasate into the tumor interstitial space must travel long distances against this flow to encounter and treat regions of the tumor with low vascular density. This is in contrast to normal tissues where most cells are located within a few cell layer from a nearest blood vessel [13].
In previous studies, we have developed a pH-responsive charge-shielded cationic micelle system [14]. The cationic micelles were formed from a block copolymer of a poly(L-histidine) and a short branched polyethyleneimine (PEI). Their cationic surface was shielded by the pH-responsive polymer, mPEG-block-polysulfadimethoxine, resulting in a poly(ethylene glycol) (PEG) surface. This system was designed to allow prolonged blood circulation and expose the cationic surface under slightly acidic conditions in a tumor. In the in vivo study using mice bearing xenografts of a human tumor, the cationic micelles loaded with paclitaxel showed greater tumor suppression activity than free paclitaxel. Furthermore, an in vivo study using Cy3-labeled cationic micelles showed wide intratumoral distribution. Similar results have been provided by an affiliate group [15]. They prepared cationic nanogels from acetylated pullulan and short branched PEI and then coated the nanogel with hyaluronic acid which is supposed to be degraded by hyaluronidase in tumors. Their in vivo study also showed greater anti-tumor activity of the drug-loaded cationic nanogels compared to free drugs and a wide distribution of cationic nanogels by fluorescent imaging.
Several studies revealed that cationic nanoparticles significantly extravasated and accumulated in tumors [16–18]. However, their ability to penetrate tumor tissue has remained to be clarified. It was suggested that the penetration of cationic nanoparticles is hindered by their surface charge [19,20]. Indeed, cationic liposomes accumulated around tumor vessels but hardly penetrated into tumor tissues [21]. In contrast, cationic liposomes penetrate more deeply in spheroids than do pegylated liposomes [22].
In this study, we observed the penetration of Cy3-labeled poly(D,L-lactide-co-glycolide)-block-branched polyethyleneimine-block-poly(D,L-lactide-co-glycolide) (PLGA-b-bPEI-b-PLGA), cationic micelles into a multilayered cell culture (MCC; a cultured flat tumor tissue) . These findings become indicative for designing new nano-sized drug carriers. We used an in vitro transport model instead of an animal model to see the penetration of cationic micelles as sole event. The in-house model consisted of a MCC and an Ussing chamber, a two-chamber type diffusion cell. Studies were further conducted to clarify the mechanisms of micelle distribution in model tumor tissues.
2. Materials & Methods
2.1. Materials
Poly(D,L-lactide-co-glycolide) (PLGA 36kDa; Resomer® RG503H; lactide:glycolide = 1:1 (mole/mole); approximate MW 36 kDa), branched polyethyleneimine (bPEI 25kDa; Mn 10 kDa), dimethyl sulfoxide (DMSO), HEPES, McCoy’s 5A medium, alpha modified Eagle's medium (αMEM), Collagen type I from calf skin, FITC–phalloidin, Hoechst 33258 and inhibitors of endocytosis, including chlorpromazine (CPZ), methyl-β-cyclodextrin (MβCD), genestein, amiloride, and tannic acid, were purchased from Sigma-Aldrich (St.Louis, MO, USA).
Penicillin–streptomycin antibiotics and fetal bovine serum were purchased from Life Technologies (Carlsbad, CA, USA). Culture inserts (CostarR 12 mm snapwell insert, 0.4 μm, polycarbonate membrane) were purchased from Corning Inc. (Corning, NY, USA). Dialysis membranes (Spectra/Por® dialysis membrane MWCO: 15 kDa) were purchased from Spectrum Laboratories, Inc. (Rancho Dominguez, CA, USA). Cy3-NHS ester and Cy5-NHS ester were purchased from Combinix, Inc. (Sunnyvale, CA, USA).
2.2. Preparation of probes
2.2.1 Micelle formation and characterization
PLGA-b-bPEI-b-PLGA (PLGA MW 36kDa, bPEI Mw 25kDa) was synthesized and used for preparation of the cationic micelles as previously described [23,24]. PLGA-b-bPEI-b-PLGA was dissolved in DMSO at a concentration of 10 mg/mL and stirred for 4 hours at room temperature. HEPES buffer (20 mM, pH 7.4) was then added dropwise at an equivalent volume to DMSO and stirred for an additional 2 hours. The mixture was dialyzed against distilled water (MWCO 15 kDa) for 24 hours. The resulting solution was filtered through a 0.22 μm filter and subsequently lyophilized. In order to detect micelles or polymer distribution, the cationic micelles were labeled with Cy3 at the primary amine group of bPEI. Particle size and surface charge of the cationic micelles were determined by dynamic laser scattering and laser Doppler velocimetry (Zetasizer 3000HSA, Malvern Instruments Inc.) with a fixed wavelength of 677 nm and a constant angle of 90°.
2.2.2 Micelle charge shielding with mPEG-b-polysulfadimethoxine
Shielded micelles were prepared by coating the cationic micelles with mPEG-block-polysulfadimethoxine (mPEG-b-PSDM, mPEG Mw 2kDa, PSDM Mw 3kDa). mPEG-b-PSDM was synthesized as previously described [25]. mPEG-b-PSDM was dissolved in HEPES buffer (10 mM, pH 8.0) at a concentration of 1-10 mg/mL. An equivalent volume of cationic micelles in HEPES buffer (10 mM, pH 7.4) at a concentration of 1 mg/mL was added dropwise and stirred for 3 hours. The mixture was dialyzed against HEPES buffer (10 mM, pH 7.4) and filtered through a 0.22 μm filter.
2.2.3 Preparation of FRET micelle
Fluorescence resonance energy transfer (FRET) is a phenomenon that an excited dye molecule directly transfers energy to the other dye molecule. Since the efficiency of this energy transfer is inversely proportional to the distance between molecules, FRET is useful to gauge the spatial relationship of two molecules. The FRET micelles were prepared using two dyes: Cy3-NHS ester and Cy5-NHS ester. The emission wavelength of Cy3 overlaps the excitation wavelength of Cy5. When these two dyes are in close proximity (less than 10 nm), an emission from Cy5 was observed through FRET when exciting Cy3. Thus, micelles conjugated with Cy3 and Cy5 show a FRET signal and their dissociation causes the disappearance of the FRET signal. PLGA-b-bPEI-b-PLGA was respectively conjugated with Cy3 and Cy5 at a 2:1 molar ratio of PLGA-b-bPEI-b-PLGA to the dye in DMSO. The procedures for micelle preparation described in Section 2.2.1 were subsequently performed to prepare the FRET micelles composed of Cy3-conjugated polymers and Cy5-conjugated polymers at a 1:1 molar ratio of Cy3 to Cy5. FRET was confirmed by a fluorescence spectrophotometer (SpectraMax M2/Molecular devices).
2.3. In vitro tumor model
2.3.1. Multilayered cell culture
A multilayered cell culture (MCC) is composed of cancer cells grown on a permeable support membrane [26,27]. MCCs were prepared by conventional methods using a human colon adenocarcinoma cell line (HT29), the most widely used cell line for MCCs [26,27]. In brief, cells were seeded on a culture insert (CostarR 12 mm snapwell insert, 0.4 μm, polycarbonate membrane / Corning) with a collagen-coated membrane at a cell density 1.8 × 10⁶ cells/cm2. After 4 hours, the culture insert was submerged in excess of αMEM supplemented with 10% fetal bovine serum, and cultured for 4 days while stirring.
2.3.2. Modified Ussing chamber system
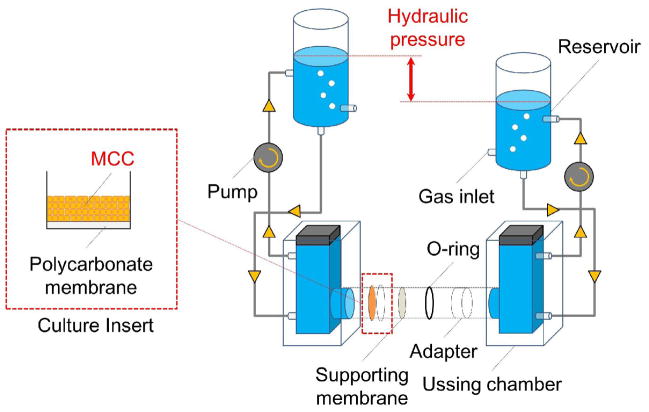
The Ussing chamber system is two-chamber type diffusion cells. A MCC can be tightly mounted into the system without any leakage. The side of the Ussing chamber system containing the probes was defined as a ‘donor’, and another side was defined as the ‘receptor’. We have modified the Ussing chamber system to allow application of a hydraulic pressure gradient mimicking the tumor microenvironment (Fig. 1). Each chamber was connected to an isovolumetric reservoir with silicone tubing and filled with a test solution. The test solution can be circulated by a pump. The hydraulic pressure gradient can be established through the MCC by adjusting the height of a water column in the reservoir.
Figure 1.
Modified Ussing chamber system. The multilayered cell culture (MCC) was secured into the Ussing chamber by an O-ring and an adapter and the top of the MCC was faced to donor chamber. Each chamber was connected to the reservoir with silicone tubing. The culture medium in each chamber was circulated by a pump. The supporting membrane with a mesh size of 40 μm was used to prevent the separation of the MCC from the culture insert by pressure gradients. The whole system was maintained at 37 °C by a heat block (not shown in the figure).
2.3.3. Distribution assay
The MCC was mounted into the modified Ussing chamber system and filled with serum-free αMEM. The medium was constantly bubbled with pre-mix gas of 5% CO2, 5% O2, and 90% N2. The system was maintained at 37 °C by a heat block. After equilibrating for 30 minutes, the assay was started by adding probes into the donor side. After one hour the MCC was fixed with 4% paraformaldehyde at 37 °C for one hour and subsequently submerged in 30% sucrose aqueous solution at 37 °C for 30 minutes for cryoprotection. The cryoprotected MCC was embedded in Tissue-Tek® O.C.T™ compound (Sakura Finetek) and cryo-sections were prepared by the cryotome (HM 505 EVP Cryostat / Microm GmbH). Images of the micelle distribution in the MCC were obtained by confocal microscopy (FV1000 Confocal Microscope / Olympus). The individual experiment was performed 3 times to confirm reproducibility. Hoechst 33258, FITC, Cy3 and Cy5 were excited with a diode laser (405 nm), a Ar laser (488 nm), a HeNe laser (543 nm) and a HeNe laser (633 nm) and collected with 420–475 nm, 500–530 nm, 555–655 nm and 645–745 nm. For FRET detection, Cy3 and FRET images were recorded simultaneously with the excitation at 543 nm and the emission was split with a SDM640 dichroic mirror onto two detectors with a 555–625 nm filter for Cy3 emission and a BA650IF filter for FRET signal, respectively
2.3.4. Inhibition study
A number of inhibitors against various endocytic mechanisms are available [28–30]. We used inhibitors listed in Table 1 alone or in combination. Prior to exposure of the MCC to probes, the MCC was treated with inhibitors for 30 minutes at the concentrations described in Table 1. The distribution assay was subsequently started by adding probes as described in Section 2.3.3. For tannic acid, they could interact with cationic probes due to their acidic properties; they were removed by washing with the fresh medium three times before adding probes.
Table 1.
Inhibitors against various endocytic mechanisms
| Inhibitors | Target endocytic mechanism | Treatment concentration |
|---|---|---|
| Chlorpromazine | Clathrin-mediated endocytosis | 30 μM |
| Methyl-β-cyclodextrin | Caveolae-mediated endocytosis, Clathrin & Caveoae-independent endocytosis | 8 mM |
| Genistein | Caveolae-mediated endocytosis, Clathrin & Caveoae-independent endocytosis | 50 μM |
| Amiloride | Macropinocytosis | 50 μM |
| Tannic acid | Fixative of cellular membrane | 0.25 % |
3. Results & Discussion
3.1. Micelle characterization
PLGA-b-bPEI-b-PLGA micelles were prepared with a size of ~ 50 nm and zeta potential of ~ +30 mV (Table 2 and Supplementary Fig. S1). The cationic micelles were then labeled with Cy3 on bPEI. There were no observable changes in sizes and zeta potentials by fluorescent labeling. The shielded micelles were also made by coating of the micelle with mPEG-b-PSDM at a 1:10 weight ratio (mPEG-b-PSDM to micelles); these averaged 57 nm in diameter with a zeta potential of −31 mV (Table 2). The weight ratio was optimized after varying the mixing ratio (Supplementary Table S1). Considering that the PEG chains on the surface are supposed to hinder electrostatic interactions with biological components, the shielded micelles were employed as a control.
Table 2.
Average size and zeta potential of the cationic micelles and the shielded micelles
| Sample | Average size (nm) | PDI | Zeta potential (mV)* |
|---|---|---|---|
| Cationic micelles | 50.5 | 0.2 | +31.5±2.5 |
| Shielded micelles | 57.1 | 0.2 | −30.9±2.4 |
Zeta potential was measured in 10 mM HEPES (pH7.4)
3.2. The penetration and distribution of cationic and shielded micelles
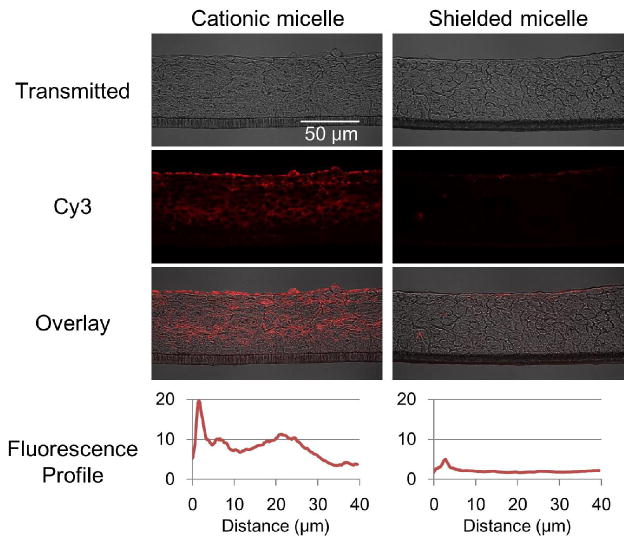
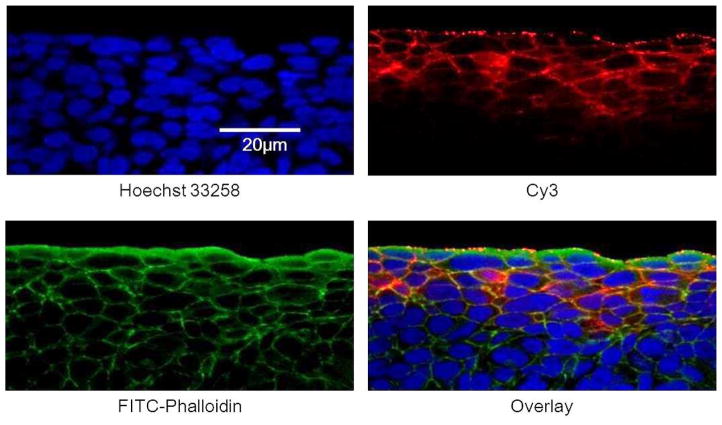
The Cy3-labeled cationic and shielded micelles described in Section 3.1 were added to the donor side of the Ussing chamber at a concentration of 0.15 mg/mL. Cy3 from the cationic micelles distributed throughout the MCC, but the shielded micelles were not detectable except for trace amounts accumulated on the surface of the MCC (Fig. 2). Considering that PLGA-b-PEG micelles also showed no penetration (Supplementary Fig. S2), this difference seems to be caused by their surface features. Cy3 from the cationic micelles was found mostly in the cell membranes or extracellular space, but was also detected inside of cells (Fig. 3). Micelles or polymers are generally assumed to penetrate the MCC via two pathways; the extracellular pathway, which is governed by passive diffusion, and the intracellular pathway, which is based on the endocytic and exocytic activities of cells [31]. A fraction of the micelles taken by endocytosis are transported to the other side of the cell by exocytosis. Iterated endocytosis and exocytosis, which are not directional, would advance the transport into the tumor tissue in a manner similar to that the random walk Brownian motion of molecules causes diffusion.
Figure 2.
Distribution of cationic micelles and shielded micelles in the MCC. MCCs were exposed to the cationic and shielded micelles labeled with Cy3 (red) at 37 °C for one hour. Cryo-sections were prepared and imaged by confocal microscopy. Fluorescence was presented as an intensity profile over distance from the MCC surface using ImageJ [66]. The images are representative and the profiles are average of data set from three different cross sections.
Figure 3.
Localization of Cy3 from cationic micelles in the MCC. The MCC was exposed to the cationic micelles labeled with Cy3 (red) at 37 °C for one hour. Cryo-sections were prepared and stained with Hoechst 33258 for the nucleus (blue), FITC-phalloidin for the cytoskeleton (green).
The distribution of the cationic micelles can be partially explained by the surface charge which allows micelles stick to a cell membrane. The locally elevated micelle concentration at the cell membrane should accelerate both extracellular and intracellular penetration. Indeed, studies of the MCC and spheroid models reveal that accelerated cellular uptake of nanoparticles and proteins result in deep penetration [22,31,32]. On the other hand, the pegylated surface of the shielded micelle hinders interaction with the cell membrane resulting in poor cellular uptake. In addition, MCCs consisting of HT29 shows a more tightly packed structure. Hence, penetration via the extracellular pathway, the most likely way to penetrate for shielded micelles, is potentially limited. One study (by El-Dakdouki MH et. al.) showed that pegylated proteins appear to penetrate more deeply in a MCC rather than non-pegylated proteins [34]. This can be explained by reduced protein aggregation rather than cell-dependent mechanisms.
3.3. Effect of hydraulic pressure gradient
In healthy tissues, the microvascular pressure (MVP) varies from 10 to 25 mmHg and the IFP is close to zero [33]. However, the IFP is uniformly elevated in the core of a solid tumor and approaches the MVP [34,35]. Close to the tumor margin, however, the IFP drops rapidly to zero establishing a hydraulic pressure gradient from the center to the margin of the tumor [36,37]. This hydraulic pressure gradient is assumed to cause a convectional flow counteracting nanoparticle penetration.
The distribution assay was performed with a hydraulic pressure gradient of 15 mmHg ( 200mmH2O) from the receptor side to the donor side in order to examine the influence of the hydraulic pressure gradient on micelle penetration. In this study, the Cy3 dye molecule and Cy3-labeled albumin were used as controls. Both controls uniformly penetrated throughout the MCC without a pressure gradient (Fig. 4). With the pressure gradient applied, the penetration of Cy3 dye molecules was slightly inhibited; however, albumin penetration was seriously inhibited. This penetration retardation is seemingly caused by the convectional flow resulting from the hydraulic pressure gradient. Since small molecules, such as Cy3, have high diffusivity and capability of penetration through a cell membrane (resulting in intracellular penetration), their penetration might be less affected by the hydraulic pressure gradient. On the other hand, large molecules, such as albumin, have low diffusivity and likely penetrate through the extracellular space. Therefore, their penetration is more affected by the hydraulic pressure gradient. The penetration of Cy3-labeled micelles was minimally affected by the hydraulic pressure gradient while they were larger than albumin (Fig. 4). The result suggests that the micelles are actively transported.
Figure 4.
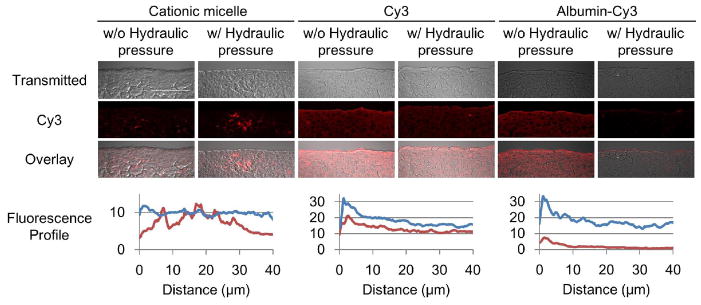
Influence of hydraulic pressure on the penetration of the Cy3 labeled micelles and albumins. The MCCs were exposed to the cationic micelles conjugated with Cy3 (red) and control molecules: free Cy3 (1 μg/mL) and Cy3 conjugated albumins (2.5 mg/mL) at 37 °C for one hour with or without a hydraulic pressure gradient. Cryo-sections were prepared and then imaged by confocal microscopy. Fluorescence was presented as an intensity profile over distance using ImageJ [66]. The profiles for distribution without the hydraulic pressure gradient are shown in blue, and with the hydraulic pressure gradient in red. Scale bar = 50 μm. The images are representative and the profiles are average of data set from three different cross sections.
3.4. Determination of penetrating entity
The results from scientific studies indicate that some micelles are dissociated after extravasation by many factors, such as interactions with biological components [38–40], micelle-cell membrane fusion [41] and microenvironment in late endosome or lysosome [42,43]. FRET micelles conjugated with Cy3 and Cy5 were used to determine the state of the cationic micelles. When a micelle is intact, emission from Cy5 is observed when using the excitation wave length of Cy3 as a FRET signal. On the other hand, the FRET signal disappears when the micelle dissociates. The FRET micelles were prepared with a size of around 45 nm (Supplementary Fig. S3A). The FRET signal was observed by fluorescence spectrophotometer. Moreover, disappearance of the FRET signal and recovery of Cy3 fluorescence was observed by addition of DMSO (Supplementary Fig. S3B).
The distribution assay was performed using the FRET micelles. The FRET signal was mostly detected on the surface of the MCC while the Cy3 and Cy5 signals were detected throughout the MCC (Fig. 5). The result suggests that the cationic micelle dissociates and then the polymers dissociated from the micelle (unimers) in order to penetrate the MCC. The cationic micelle appeared to dissociate after encountering superficial cells; however, the trigger and an exact location of micelle dissociation was still not clear. The strong interaction between the cationic surface charge and anionic charge of cell membrane could facilitate the dissociation by the micelle-cell membrane fusion.
Figure 5.
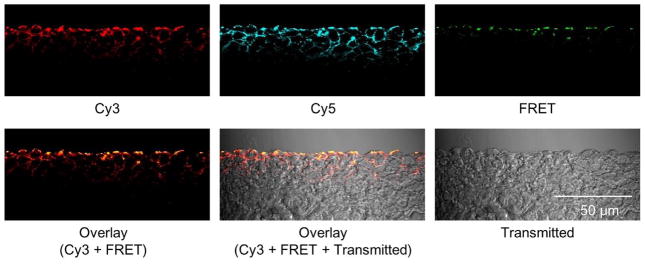
The penetration of the cationic micelles in the MCC. The MCC was exposed to the FRET micelles at 37 °C for one hour. The emission of Cy5 (λEm= >650 nm) was detected as a FRET signal using the excitation wave length of Cy3 (λEx=543 nm). The images are representative.
3.5. Inhibition of endocytosis
As mentioned in Section 3.2, the unimers dissociated from the cationic micelle are assumed to penetrate the MCC via the intracellular or the extracellular pathways. In order to determine the contribution of each pathway to the penetration, the influence of endocytosis inhibition on the penetration of the cationic micelles was studied. Tannic acid is known as a fixative of cell membranes by cross-linking proteins, resulting in inhibition of endocytic and exocytic activities [44]. The MCC was pre-incubated with a low concentration of tannic acid and then exposed to the cationic micelles. Tannic acid fully inhibited unimer penetration (Fig. 6). Furthermore, the influence of temperature on unimer penetration was studied. A temperature control is a useful approach to determine energy-dependency since all energy-dependent activity of cells including endocytic activity are hindered at low temperatures [45,46]. Unimer penetration was significantly inhibited when the distribution assay was performed at 4 °C (Fig. 6). The combined results suggest that unimer penetration was primarily via the intracellular pathway in which energy-dependent endocytosis is involved. Previous studies indicate that the extracellular penetration of nanoparticles is hindered with a surface charge [19,20]. Herein, the intracellular penetration of cationic unimers can explain the great distribution of the cationic micelles in the MCC and in vivo models.
Figure 6.

Inhibition of unimer penetration by tannic acid and low temperature. The MCC was exposed to cationic micelles conjugated with Cy3 (red) for one hour at 37 or at 4 °C with or without pretreatment of tannic acid. Cryo-sections were prepared and then imaged by confocal microscopy. Fluorescence was presented as an intensity profile over distance using ImageJ [66]. Unimer penetration profile at 37 °C is shown in blue, and the Cy3 profiles by treating the MCC with tannic acid and a low temperature (4 °C) are in red. The images are representative and the profiles are average of data set from three different cross sections.
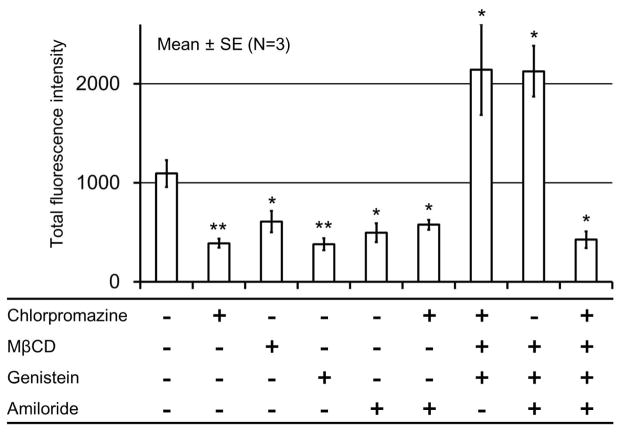
The mechanisms of endocytosis can be divided into two broad categories, phagocytosis and pinocytosis [29]. Pinocytosis is likely to be involved in the unimer penetration since phagocytosis is a specialized function of phagocytes, such as macrophages, neutrophils, monocytes and dendritic cells. Furthermore, pinocytosis can be classified into four groups, clathrin-mediated endocytosis (CME), caveolae-mediated endocytosis, clathrin- and caveolae-independent endocytosis and macropinocytosis—based on the involved proteins. The cellular uptake of various nanoparticles via endocytosis have been reported by several studies and widely accepted [46–49]. In particular, cationic micelles are generally thought to enter cells by non-specific adsorptive endocytosis due to their cationic surface, which can interact with a cell membrane. However, the endocytic mechanisms involved in the adsorptive endocytosis of cationic nanoparticles has not been fully identified. There are many reports indicating that clathrin-mediated endocytosis [50–56], caveolae-mediated endocytosis [56,57] and clathrin- and caveolae-independent endocytosis [56,58] are all involved in the adsorptive endocytosis. In order to determine the endocytic mechanism involved in the penetration of the cationic unimers, we used inhibitors against various endocytic mechanisms (Table 1). The MCC was pre-incubated with single or multiple inhibitors, and then exposed to the cationic micelles. Inhibitors seriously inhibited unimer penetration when used alone or in combinations with Chlorpromazine and Amiloride (Fig. 6 and Supplementary Fig. S3). Interestingly, unimer penetration was enhanced by the inhibitors when used in combinations without either Chlorpromazine or Amiloride (Fig. 7 and Supplementary Fig. S4). The stimulation of compensatory endocytic mechanisms have been observed in other studies using the cell line where clathrin- and caveolin-dependent endocytosis were genetically inhibited [59][60]. The cells are assumed to stimulate the compensatory endocytic mechanisms to maintain homeostasis. In that study, inhibition of both clathrin- and caveolae-mediated endocytosis resulted in the stimulation of macropinocytosis. Considering this endocytic modulation, the inhibition of one endocytic mechanism by the inhibitor likely stimulates other endocytic mechanisms. In our results, clathrin-mediated endocytosis would be stimulated by inhibiton of macropinocytosis and macropinocytosis would be stimulated by inhibition of clathrin-mediated endocytosis. However, caveolae-mediated endocytosis and clathrin-and caveolae-independent endocytosis would not be stimulated by any other inhibitors. From these findings, we postulate that the cationic micelles or the unimers enter cells by endocytosis and that all endocytic mechanisms can be involved as described in previous studies [50–58]. Furthermore, a study using multiple inhibitors suggests that clathrin-mediated endocytosis and macropinocytosis are the preferred endocytic mechanisms for cationic micelles or unimers. In addition, cationic unimers dissociated from the cationic micelle may behave similarly to cationic cell-penetrating peptides, such as the TAT peptide. Our results are consistent with those suggesting that the cationic cell-penetrating peptide enters cells by macropinocytosis [45] .
Figure 7.
Inhibition of cationic unimer penetration by various inhibitors. The MCC was exposed to the cationic micelles labeled with Cy3 (red) at 37 °C for one hour with or without pretreatment of inhibitiors. Cryo-sections were prepared and then imaged by confocal microscopy. Total fluorescence intensity is presented as the area under the curve of fluorescence profiles shown in Supplementary Fig. S5. *p<0.05, **p<0.01
On the other hand, intracellular penetration should require endocytosis and exocytosis as well. There are a few articles describing the exocytosis of nanoparticles. They all conclude that exocytosis of nanoparticles is much slower than endocytosis [61,62]. Nanoparticles ranging between 20 nm and 50 nm show the fastest endocytosis [61–63] and the rate of exocytosis is inversely related to the size of nanoparticles [62]. In our study, cationic micelles could dissociate into unimers inside or on the surface of cells; therefore, exocytosis of unimers might be relatively rapid.
Transcytosis may play a role in the penetration of particles into a tissue. It has been studied mainly in epithelial tissues which form cellular barriers between two compartments [64]. The direction of transport mediated by transcytosis is limited to be either apical to basolateral or the reverse. It is notable that endocytosis and exocytosis govern the penetration of cationic micelles or unimers in the MCC, whereas the cells inside of the MCC do not have apical-basal polarity. Considering that a given micelle has a certain probability to exocytose in the forward direction, the cationic surface causes the accelerated endocytosis and may be in part responsible for the penetration.
4. Conclusion
Examining the penetration and distribution of cationic micelles using a MCC and modified Ussing chamber system showed that the cationic micelles penetrated the MCC against a hydraulic pressure gradient, suggesting active transport mechanisms. The FRET approach revealed that PLGA-b-bPEI-b-PLGA micelles primarily penetrate and distribute in the MCC as unimers via intracellular pathways that involve clathrin-mediated endocytosis and macropinocytosis for the cellular entry (Fig. 8). However, the mechanisms that the unimers use for exocytosis, as part of the intracellular pathway, remain to be clarified. A previous study suggested that cationic nanoparticles penetrate through extracellular space opened by necrosis [14,15]. However, this model study did not show any sign of necrosis of the cells in the MCC most likely due to the short duration of the experiment. The roles of the findings from this study in drug delivery will be further investigated.
Figure 8.
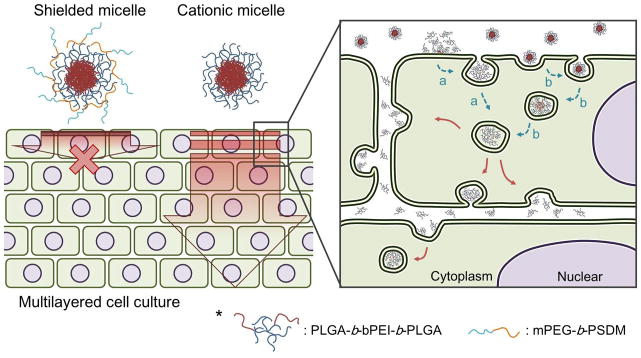
Proposed penetration mechanism of cationic micelles through a multilayered cell culture. The cationic micelles penetrate through a multilayered cell culture as unimers. Dissociation of micelles is possibly caused on a surface of cell membranes (a) or inside of first layer cells.
The cationic micelles we used in this study would not transport drugs loaded in the core by hydrophobic interactions since the micelles are dissociated after encountering the cells. One possible way to fully enjoy their improved capability of penetration is by conjugating the drugs with the polymers with a biodegradable linkage. However, their accumulation on the first layer of cells could increase drug concentration locally around the tumors. We have tried preliminary experiments using cationic micelles loaded with doxorubicin (Dox). Unexpectedly, the results indicate that the cationic micelles inhibit the penetration of Dox (Supplementary Fig. S5). There are many possible reasons of this inhibition. Therefore, we need more investigations to conclude the usefulness of the cationic micelles.
Supplementary Material
Highlights.
Cationic micelles showed a noticeable distribution in a multilayered cell culture.
Penetration occurred against convective flow caused by a hydraulic pressure gradient.
Most of cationic micelles penetrated as unimers via intracellular pathways.
Clathrin-mediated endocytosis and macropinocytosis are seemingly responsible for penetration.
Acknowledgments
This work partially supported by NIH CA101850 and CA122356 and Kowa Co. Ltd. The authors thank Darren Lars Stirland and Joseph W. Nichols for their proof reading and discussion.
Biographies
 Seiji Miura has worked for Kowa Company Ltd. since 2005. He was also a research scholar at Department of Pharmaceutics and Pharmaceutical Chemistry in University of Utah between 2011 and 2014. He has been working on drug delivery systems for 10 years and currently focuses on nanomedicines for cancer. He received his B.S. (2003), M.S. (2005) and Ph.D. (2008) in biochemistry from Tokyo University of Agriculture and Technology.
 Hidenori Suzuki is a research scholar at Department of Pharmaceutics and Pharmaceutical Chemistry in University of Utah since 2013. He received his B.S.(2002), and M.S.(2004) in Agricultural Science from Nagoya University. He has worked for Fuji Research Laboratories, Pharmaceutical Division, Kowa company, Ltd. since 2004. His current research interests are nanomedicines for cancer.
 You Han Bae is Professor in Pharmaceutics, University of Utah. He published over 250 peer-reviewed scientific articles (citation>18,000; Google Scholar), book chapters and U.S. Patents in the areas of stimuli sensitive polymers and drug delivery. He has been elected Fellows of AIMBE, AAPS and CRS. His current research interests are: understanding of extravasation, EPR effect, intratumoral transport of nanoparticles; predictable preclinical cancer models; specific nanoparticle absorption in the GI track; and non-viral nucleic acid delivery for various diseases. He is serving Journal of Controlled Release as an America Associate Editor and the Editor of Concept
Footnotes
Publisher's Disclaimer: This is a PDF file of an unedited manuscript that has been accepted for publication. As a service to our customers we are providing this early version of the manuscript. The manuscript will undergo copyediting, typesetting, and review of the resulting proof before it is published in its final citable form. Please note that during the production process errors may be discovered which could affect the content, and all legal disclaimers that apply to the journal pertain.
References
- 1.Wang AZ, Langer R, Farokhzad OC. Annu Rev Med. 2012;63:185–198. doi: 10.1146/annurev-med-040210-162544. [DOI] [PubMed] [Google Scholar]
- 2.Zhang L, Gu FX, Chan JM, Wang AZ, Langer RS, Farokhzad OC. Clin Pharmacol Ther. 2008;83:761–769. doi: 10.1038/sj.clpt.6100400. [DOI] [PubMed] [Google Scholar]
- 3.Stirland DL, Nichols JW, Miura S, Bae YH. J Control Release. 2013;172:1045–1064. doi: 10.1016/j.jconrel.2013.09.026. [DOI] [PMC free article] [PubMed] [Google Scholar]
- 4.Lammers T, Kiessling F, Hennink WE, Storm G. J Control Release. 2012;161:175–187. doi: 10.1016/j.jconrel.2011.09.063. [DOI] [PubMed] [Google Scholar]
- 5.Adams DJ. Trends Pharmacol Sci. 2012;33:173–180. doi: 10.1016/j.tips.2012.02.001. [DOI] [PMC free article] [PubMed] [Google Scholar]
- 6.Tannock IF, Lee CM, Tunggal JK, Cowan DSM, Egorin MJ. Clin Cancer Res. 2002;8:878–884. [PubMed] [Google Scholar]
- 7.Marcucci F, Corti A. Adv Drug Deliv Rev. 2012;64:53–68. doi: 10.1016/j.addr.2011.09.007. [DOI] [PubMed] [Google Scholar]
- 8.Holback H, Yeo Y. Pharm Res. 2011;28:1819–1830. doi: 10.1007/s11095-010-0360-y. [DOI] [PMC free article] [PubMed] [Google Scholar]
- 9.Chauhan VP, Stylianopoulos T, Boucher Y, Jain RK. Annu Rev Chem Biomol Eng. 2011;2:281–298. doi: 10.1146/annurev-chembioeng-061010-114300. [DOI] [PubMed] [Google Scholar]
- 10.Maeda H, Wu J, Sawa T, Matsumura Y, Hori K. J Control Release. 2000;65:271–284. doi: 10.1016/s0168-3659(99)00248-5. [DOI] [PubMed] [Google Scholar]
- 11.Baxter LT, Jain RK. Microvasc Res. 1989;37:77–104. doi: 10.1016/0026-2862(89)90074-5. [DOI] [PubMed] [Google Scholar]
- 12.Stapleton S, Milosevic M. In: Cancer Target Drug Deliv. Bae Y, Mrsny R, Park K, editors. Springer Science+Business Media; 2013. pp. 241–272. [Google Scholar]
- 13.Mikhail AS, Allen C. J Control Release. 2009;138:214–223. doi: 10.1016/j.jconrel.2009.04.010. [DOI] [PubMed] [Google Scholar]
- 14.Hu J, Miura S, Na K, Bae YH. J Control Release. 2013;172:69–76. doi: 10.1016/j.jconrel.2013.08.007. [DOI] [PubMed] [Google Scholar]
- 15.Yim H, Park S, Bae YH, Na K. Biomaterials. 2013;34:7674–7682. doi: 10.1016/j.biomaterials.2013.06.058. [DOI] [PubMed] [Google Scholar]
- 16.Stylianopoulos T, Soteriou K, Fukumura D, Jain RK. Ann Biomed Eng. 2013;41:68–77. doi: 10.1007/s10439-012-0630-4. [DOI] [PMC free article] [PubMed] [Google Scholar]
- 17.Dellian M, Yuan F, Trubetskoy VS, Torchilin VP, Jain RK. Br J Cancer. 2000;82:1513–1518. doi: 10.1054/bjoc.1999.1171. [DOI] [PMC free article] [PubMed] [Google Scholar]
- 18.Schmitt-Sody M, Strieth S, Krasnici S, Sauer B, Schulze B, Teifel M, Michaelis U, Naujoks K, Dellian M. Clin Cancer Res. 2003;9:2335–2341. [PubMed] [Google Scholar]
- 19.Stylianopoulos T, Poh MZ, Insin N, Bawendi MG, Fukumura D, Munn LL, Jain RK. Biophys J. 2010;99:1342–1349. doi: 10.1016/j.bpj.2010.06.016. [DOI] [PMC free article] [PubMed] [Google Scholar]
- 20.Lieleg O, Baumgärtel RM, Bausch AR. Biophys J. 2009;97:1569–1577. doi: 10.1016/j.bpj.2009.07.009. [DOI] [PMC free article] [PubMed] [Google Scholar]
- 21.Krasnici S, Werner A, Eichhorn ME, Schmitt-Sody M, Pahernik SA, Sauer B, Schulze B, Teifel M, Michaelis U, Naujoks K, Dellian M. Int J Cancer. 2003;105:561–567. doi: 10.1002/ijc.11108. [DOI] [PubMed] [Google Scholar]
- 22.Kostarelos K, Emfietzoglou D, Papakostas A, Yang WH, Ballangrud A, Sgouros G. Int J Cancer. 2004;112:713–721. doi: 10.1002/ijc.20457. [DOI] [PubMed] [Google Scholar]
- 23.Mishra D, Kang HC, Bae YH. Biomaterials. 2011;32:3845–3854. doi: 10.1016/j.biomaterials.2011.01.077. [DOI] [PMC free article] [PubMed] [Google Scholar]
- 24.Kang HC, Lee JE, Bae YH. J Control Release. 2012;160:440–450. doi: 10.1016/j.jconrel.2012.02.024. [DOI] [PMC free article] [PubMed] [Google Scholar]
- 25.Sethuraman VA, Bae YH. J Control Release. 2007;118:216–224. doi: 10.1016/j.jconrel.2006.12.008. [DOI] [PMC free article] [PubMed] [Google Scholar]
- 26.Cowan DS, Hicks KO, Wilson WR. Br J Cancer Suppl. 1996;27:S28–31. [PMC free article] [PubMed] [Google Scholar]
- 27.Minchinton AI, Wendt KR, Clow KA, Fryer KH. Acta Oncol. 1997;36:13–16. doi: 10.3109/02841869709100724. [DOI] [PubMed] [Google Scholar]
- 28.Dutta D, Donaldson JG. Cell Logist. 2012;2:203–208. doi: 10.4161/cl.23967. [DOI] [PMC free article] [PubMed] [Google Scholar]
- 29.Sahay G, Alakhova DY, Kabanov AV. J Control Release. 2010;145:182–195. doi: 10.1016/j.jconrel.2010.01.036. [DOI] [PMC free article] [PubMed] [Google Scholar]
- 30.Iversen TG, Skotland T, Sandvig K. Nano Today. 2011;6:176–185. doi: 10.1021/nn2021953. [DOI] [PubMed] [Google Scholar]
- 31.El Dakdouki MH, Puré E, Huang X. Nanoscale. 2013;5:3904–3911. doi: 10.1039/c3nr90022c. [DOI] [PMC free article] [PubMed] [Google Scholar]
- 32.Kim SY, Kim TH, Choi JH, Lee KC, Park KD, Lee SJ, Kuh HJ. Arch Pharm Res. 2012;35:531–541. doi: 10.1007/s12272-012-0317-2. [DOI] [PubMed] [Google Scholar]
- 33.Zweifach BW. Handb Physiol Cardiovasc Syst. 1984:251–307. [Google Scholar]
- 34.Boucher Y, Jain RK. Cancer Res. 1992;52:5110–5114. [PubMed] [Google Scholar]
- 35.Boucher Y, Leunig M, Jain RK. Cancer Res. 1996;56:4264–4266. [PubMed] [Google Scholar]
- 36.Boucher Y, Baxter LT, Jain RK. Cancer Res. 1990;50:4478–4484. [PubMed] [Google Scholar]
- 37.Jain RK, Stylianopoulos T. Nat Rev Clin Oncol. 2010;7:653–664. doi: 10.1038/nrclinonc.2010.139. [DOI] [PMC free article] [PubMed] [Google Scholar]
- 38.Savić R, Azzam T, Eisenberg A, Maysinger D. Langmuir. 2006;22:3570–3578. doi: 10.1021/la0531998. [DOI] [PubMed] [Google Scholar]
- 39.Lu J, Owen SC, Shoichet MS. Macromolecules. 2011;44:6002–6008. doi: 10.1021/ma200675w. [DOI] [PMC free article] [PubMed] [Google Scholar]
- 40.Chen H, Kim S, He W, Wang H, Low PS, Park K, Cheng JX. Langmuir. 2008;24:5213–5217. doi: 10.1021/la703570m. [DOI] [PubMed] [Google Scholar]
- 41.Lee SY, Tyler JY, Kim S, Park K, Cheng JX. Mol Pharm. 2013;10:3497–3506. doi: 10.1021/mp4003333. [DOI] [PMC free article] [PubMed] [Google Scholar]
- 42.Sakai-Kato K, Un K, Nanjo K, Nishiyama N, Kusuhara H, Kataoka K, Kawanishi T, Goda Y, Okuda H. Biomaterials. 2014;35:1347–1358. doi: 10.1016/j.biomaterials.2013.11.027. [DOI] [PubMed] [Google Scholar]
- 43.Murakami M, Cabral H, Matsumoto Y, Wu S, Kano MR, Yamori T, Nishiyama N, Kataoka K. Sci Transl Med. 2011;3:64ra2. doi: 10.1126/scitranslmed.3001385. [DOI] [PubMed] [Google Scholar]
- 44.Polishchuk R, Di Pentima A, Lippincott-Schwartz J. Nat Cell Biol. 2004;6:297–307. doi: 10.1038/ncb1109. [DOI] [PubMed] [Google Scholar]
- 45.Kaplan IM, Wadia JS, Dowdy SF. J Control Release. 2005;102:247–253. doi: 10.1016/j.jconrel.2004.10.018. [DOI] [PubMed] [Google Scholar]
- 46.He B, Lin P, Jia Z, Du W, Qu W, Yuan L, Dai W, Zhang H, Wang X, Wang J, Zhang X, Zhang Q. Biomaterials. 2013;34:6082–6098. doi: 10.1016/j.biomaterials.2013.04.053. [DOI] [PubMed] [Google Scholar]
- 47.Zhang A, Guan Y, Xu LX. J Biomech Eng. 2011;133:124502–124508. doi: 10.1115/1.4005481. [DOI] [PubMed] [Google Scholar]
- 48.Ma YJ, Gu HC. J Mater Sci Mater Med. 2007;18:2145–2149. doi: 10.1007/s10856-007-3015-8. [DOI] [PubMed] [Google Scholar]
- 49.Guan Y, Zhang A, Xu LX. ASME 2011 Summer Bioeng. Conf. Parts A B, ASME; 2011; p. 1057. [Google Scholar]
- 50.Huang M, Ma Z, Khor E, Lim LY. Pharm Res. 2002;19:1488–1494. doi: 10.1023/a:1020404615898. [DOI] [PubMed] [Google Scholar]
- 51.Panyam J, Zhou WZ, Prabha S, Sahoo SK, Labhasetwar V. FASEB J. 2002;16:1217–1226. doi: 10.1096/fj.02-0088com. [DOI] [PubMed] [Google Scholar]
- 52.Huang DM, Hung Y, Ko BS, Hsu SC, Chen WH, Chien CL, Tsai CP, Kuo CT, Kang JC, Yang CS, Mou CY, Chen YC. FASEB J. 2005;19:2014–2016. doi: 10.1096/fj.05-4288fje. [DOI] [PubMed] [Google Scholar]
- 53.Ma Z, Lim LY. Pharm Res. 2003;20:1812–1819. doi: 10.1023/b:pham.0000003379.76417.3e. [DOI] [PubMed] [Google Scholar]
- 54.Berry CC, Rudershausen S, Teller J, Curtis ASG. IEEE Trans Nanobioscience. 2002;1:105–109. doi: 10.1109/tnb.2003.809467. [DOI] [PubMed] [Google Scholar]
- 55.Chung TH, Wu SH, Yao M, Lu CW, Lin YS, Hung Y, Mou CY, Chen YC, Huang DM. Biomaterials. 2007;28:2959–2966. doi: 10.1016/j.biomaterials.2007.03.006. [DOI] [PubMed] [Google Scholar]
- 56.Nam HY, Kwon SM, Chung H, Lee SY, Kwon SH, Jeon H, Kim Y, Park JH, Kim J, Her S, Oh YK, Kwon IC, Kim K, Jeong SY. J Control Release. 2009;135:259–267. doi: 10.1016/j.jconrel.2009.01.018. [DOI] [PubMed] [Google Scholar]
- 57.Huth S, Lausier J, Gersting SW, Rudolph C, Plank C, Welsch U, Rosenecker J. J Gene Med. 2004;6:923–36. doi: 10.1002/jgm.577. [DOI] [PubMed] [Google Scholar]
- 58.Qaddoumi MG, Gukasyan HJ, Davda J, Labhasetwar V, Kim KJ, Lee VHL. Mol Vis. 2003;9:559–568. [PubMed] [Google Scholar]
- 59.Meier O, Boucke K, Hammer SV, Keller S, Stidwill RP, Hemmi S, Greber UF. J Cell Biol. 2002;158:1119–1131. doi: 10.1083/jcb.200112067. [DOI] [PMC free article] [PubMed] [Google Scholar]
- 60.Harush Frenkel O, Debotton N, Benita S, Altschuler Y. Biochem Biophys Res Commun. 2007;353:26–32. doi: 10.1016/j.bbrc.2006.11.135. [DOI] [PubMed] [Google Scholar]
- 61.Jin H, Heller DA, Sharma R, Strano MS. ACS Nano. 2009;3:149–158. doi: 10.1021/nn800532m. [DOI] [PubMed] [Google Scholar]
- 62.Chithrani BD, Chan WCW. Nano Lett. 2007;7:1542–1550. doi: 10.1021/nl070363y. [DOI] [PubMed] [Google Scholar]
- 63.Jiang W, Kim BYS, Rutka JT, Chan WCW. Nat Nanotechnol. 2008;3:145–150. doi: 10.1038/nnano.2008.30. [DOI] [PubMed] [Google Scholar]
- 64.Tuma PL, Hubbard AL. Physiol Rev. 2003;83:871–932. doi: 10.1152/physrev.00001.2003. [DOI] [PubMed] [Google Scholar]
- 66. [Accessed: 07-May-2014];ImageJ. [Online], Available at http://imagej.nih.gov/ij.
Associated Data
This section collects any data citations, data availability statements, or supplementary materials included in this article.


