

Abstract
Objective
To describe the prevalence of noncommunicable disease (NCD) risk factors (overweight/obesity, tobacco smoking, and alcohol consumption) and identify correlations between these and sociodemographic characteristics in western and central Nicaragua.
Methods
This was a cross-sectional study of 1 355 participants from six communities in Nicaragua conducted in September 2007–July 2009. Demographic and NCD risk-related health behavior information was collected from each individual, and their body mass index (BMI), blood pressure, diabetes status, and renal function were assessed. Data were analyzed using descriptive statistics, bivariate analyses, and (non-stratified and stratified) logistic regression models.
Results
Of the 1 355 study participants, 22.0% were obese and 55.1% were overweight/obese. Female sex, higher income, and increasing age were significantly associated with obesity. Among men, lifelong urban living correlated with obesity (Odds Ratio [OR] = 4.39, 1.18–16.31). Of the total participants, 31.3% reported ever smoking tobacco and 47.7% reported ever drinking alcohol. Both tobacco smoking and alcohol consumption were strikingly more common among men (OR = 13.0, 8.8–19.3 and 15.6, 10.7–22.6, respectively) and lifelong urban residents (OR = 2.42, 1.31–4.47 and 4.10, 2.33–7.21, respectively).
Conclusions
There was a high prevalence of obesity/overweight across all income levels. Women were much more likely to be obese, but men had higher rates of tobacco and alcohol use. The rising prevalence of NCD risk factors among even the poorest subjects suggests that an epidemiologic transition in underway in western and central Nicaragua whereby NCD prevalence is shifting to all segments of society. Raising awareness that health clinics can be used for chronic conditions needs to be priority.
Keywords: Chronic disease, obesity, alcohol drinking, poverty, tobacco smoking, Nicaragua
Non-communicable diseases (NCDs) are the global leading cause of death. Prevalence continues to rise in developed and developing nations alike. Widespread NCDs, namely cancer, cardiovascular diseases, chronic respiratory diseases, and diabetes account for 35 million deaths per year, 60% of the annual worldwide total (1).
During the last decade in Latin America, much has been learned about NCDs and their risk factors, yet much remains unknown. Metabolic Syndrome (MS) (2) and risk factors for NCDs are at least as prevalent in parts of Latin America as in developed nations (3). According to one theory, childhood exposure to low-caloric intake predisposes to the development of overweight and obesity later in life if access to hyper-nutrition becomes available. This phenomenon is known as “stunting,” and in these settings is generally defined as both short height (women < 150 cm; men < 162 cm) and overweight/obesity (4, 5). Cigarette smoking (6) and alcohol use (7) are also common in parts of Latin America. Most of the published data on these risk factors focuses on Latin America’s upper-middle income nations (8–11) and often, regardless of the economic status of the nation, focuses on pediatric (12), young adult (10), and urban (12–14) populations.
Broad questions remain about NCDs and their associated risk factors among rural populations in Latin America, especially among middle-age adults and the elderly in low and low-middle income nations. For instance, some Latin American rural populations have not been less at-risk for chronic disease than their urban counterparts (10), and unlike in the developed world, where the poorest members of society are often most afflicted by NCDs and their associated risk factors (15), in Latin America there has been no consistent relationship between NCD prevalence and socioeconomic status (14, 16).
To the authors’ knowledge, there have not been any studies of risk factors in Nicaragua published in English, apart from the World Health Organization’s (WHO) Noncommunicable Disease Country Profiles 2011 (17), which provides only a single page of data per country. Among low-middle income countries in Central America, only Guatemala has such a study available in English (5, 12). Responding to this gap, the present study aimed to first, describe the prevalence of overweight/obesity, tobacco smoking, and alcohol consumption among adults in six communities in Nicaragua; and second, to examine any independent correlations between these risk factors and age, sex, medical comorbidities, socioeconomic data, and urban or rural living history.
MATERIALS AND METHODS
Sample
Five communities in Nicaragua’s northwestern departments of León and Chinandega, and one community in the centrally-located Matagalpa department were selected—by convenience—because they represented five distinct economies: gold mining and subsistence farming; large-scale banana and sugar-cane production; small-scale fisheries near the Pacific Ocean; small-scale coffee farming; and the service industry. Five were rural; while one, the service industry community, was in an urban section of the Chinandega department. Coffee farming was the only duplicated economy, however the two communities were located in different departments and were isolated from one another. All of the communities selected had fewer than 800 inhabitants, a size that allows manageable, extensive sampling.
Data collection process
Data were collected from September 2007–July 2009, with the majority compiled in late 2007–early 2008. All men and women 20–60 years of age in these communities were eligible to participate in this cross-sectional study (no other exclusion criteria). Trained university medical personnel with community representatives performed a census in each community to accurately quantify the size of the total (and study-eligible) population while simultaneously completing the interviews.
The study was approved by the Bio-ethics Committee of Universidad Nacional Autónoma de Nicaragua in León (UNAN-León). All participants signed a written consent for study procedures.
Potential participants were contacted at their homes and, if amenable to study participation, were interviewed there; if not at home, they were revisited once or twice toward the end of data collection period.
Study instrument
The questionnaire was administered by trained university staff to each individual. Each interview took approximately 45 minutes, literacy not being an issue since the staff read the questions aloud and recorded the responses. The questionnaire covered demographic information, lifestyle, diseases, and medications to establish the prevalence of the various noncommunicable disease risk factors outlined in the Conjunto de Acciones para la Reducción Multifactorial de Enfermedades No transmisibles (CARMEN) published by the Pan American Health Organization (PAHO) (18).
Measurements and samples
Within 2 weeks of the interview, participants came to a centrally-located mobile laboratory for the following measurements/tests: blood pressure; height and weight; urinalysis; and blood sample or capillary finger-stick.
Blood pressure was measured using a calibrated M7 sphygmomanometer (Omron Healthcare Inc., Kyoto, Japan) after 5 minutes of quiet, seated rest.
Weight and height were recorded barefoot using a calibrated clinical weight scale and measuring tape, respectively.
Participants provided a random urine sample (50 mL) in a sterile collector. Two study personnel independently tested each urine sample for glucosuria (glucose levels ≥100 mg/dL) and three degrees of proteinuria (none = negative − trace; microalbuminuria = 30[+] − 100[++] mg/dL; macroalbuminuria ≥ 300[+++ or ++++] mg/dL) using Bayer’s Multistix 10SG urine dipsticks (Bayer AG, Leverkusen, Germany; sensitivity 97%, specificity 62%) (19).
Participants in the departments of León and Chinandega provided a blood sample that was stored at −20°C at UNAN-León and transported to the Centro Nacional de Diagnóstico y Referencia, Managua, Nicaragua (National Diagnostic and Reference Center, Managua, Nicaragua) where creatinine was measured using the compensated Jaffe method. In the more remote Matagalpa department, where blood samples could not be adequately refrigerated and delivered to the laboratory, creatinine levels were measured with a capillary finger-stick using a portable StatSensor™ device (Nova Biomedical Corp., Waltham, Massachusetts, United States; sensitivity 59%, specificity 88%) (20). The glomerular filtration rate (GFR) of each participant was calculated using the Modification of Diet in Renal Disease (MDRD) equation (21). GFR was used to characterize each participant’s kidney function by chronic kidney disease (CKD) stage (22).
Study definitions
Overweight was defined as body mass index (BMI) of 25–30 kg/m2; obesity was defined as a BMI ≥ 30 kg/m2. Stunting was defined as a height for women ≤ 150 cm, and for men ≤ 162 cm (5).
Hypertension was defined as either systolic blood pressure ≥140 mmHg, diastolic pressure ≥90 mmHg, or self-reported medical history with diagnosis by a health care professional.
Diabetes mellitus was defined as glucosuria (glucose excretion ≥100 mg/dL) or self-reported medical history of diabetes mellitus diagnosed by a health care professional. Glucosuria has been previously validated for diabetes screening (23).
Household incomes were categorized into extreme poverty (< US$ 1/dependent/day); poverty (US$ 1–2/dependent/day); and not impoverished (> US$ 2/dependent/day) according to pre-2008 classifications by the World Bank, after which extreme poverty was adjusted to < US$ 1.25/dependent/day (24). The prior definitions were employed because collection of the study data was begun before 2008. Although Nicaragua does maintain a national poverty line (25), it does not use the absolute poverty data above. The World Bank classification system was used to allow for international comparisons.
Education was classified both as a dichotomous and continuous variable. Study participants were classified as ever attending school, and if so, average total years of schooling.
Personal health habits included a history of ever smoking tobacco, ever drinking alcohol, ever smoking marijuana, ever using cocaine/crack, or drinking coffee.
Tobacco smoking was quantified in “pack years” (packs smoked daily per years of smoking), assuming a pack-size of 20 cigarettes.
Alcohol consumption was quantified by frequency of use and average amount consumed when drinking, a two-pronged approach used to accurately quantify drinking among both daily drinkers and binge drinkers (common practice among men in Nicaragua). The known percentages of alcohol content for the more popular beverages in Nicaragua were used to calculate past or current average annual consumption of alcohol in grams (g). Conversions included: beer, 8 g/bottle; chicha or cuzuza, 8 g/drink; rum, 8.4 g/drink; and caballito and guaro lija, 9.6 g/drink.
Marijuana and cocaine/crack use were self-reported by study participants. Participants were asked if they had ever used any of these substances.
Coffee use was also self-reported as ever drinking coffee, and if so, quantity and frequency.
Residency history included only participants from the five of the six communities (1 088 people), who were asked if they had ever lived in an urban area.
Family history was reported by participants when asked if any relatives had been diagnosed with diabetes, hypertension, and/or renal disease.
Participant followup
All study participants were given their blood pressure measurements, BMI calculation, and urinalysis results in real time. Any participant with abnormal results was referred to the nearest health clinic. Researchers did not have access to medications, per study protocol. In five of the six communities, GFR results were not immediately available, but following analysis, any participants with CKD Stage III or higher was revisited and advised to seek medical attention promptly.
Statistical analysis
All data collected were examined using descriptive statistics, including frequency distributions, mean, and standard deviation. Bivariate analyses (chi-squared) were conducted to examine the strength of associations between dichotomous independent and dependent variables. Variables demonstrating significance with P < 0.05, or deemed to be of interest to the outcome based on prior research, were placed into multiple logistic regression models.
Regarding obesity, regression models that controlled for age (stratified by decade), sex, stunting, comorbidities, schooling, poverty, and living history were built and run for all participants. These analyses were also examined after stratifying by sex.
For smoking or alcohol consumption, logistic regression models were performed to adjust for age (stratified by decade), sex, poverty, and living history.
The logistic regression models that adjusted for urban/rural living history and poverty level included 1 088 and 824 participants for whom these data were available, respectively. After stratification of obese individuals by poverty level, continuous variables were analyzed with analysis of variance (ANOVA).
Statistical analyses were performed using IBM SPSS Statistics software, version 19 (SPSS Inc., an IBM company, Chicago, Illinois, United States).
RESULTS
Participation rates among the six communities ranged from 76.9%–86.2% of those eligible, with a total study sample of 1 355 adults. The demographic characteristics of the study population, organized by BMI classification, are shown in Table 1. Overweight and obesity now affect more than half of Nicaraguans in these six communities, while underweight is comparatively rare, affecting only 1 in 40 individuals.
TABLE 1.
Attributes of 1 355 study participants from six communities, by body mass index (BMI), Nicaragua, 2007–2009
| Attribute | BMI (kg/m2)
|
P c | |||||||||
|---|---|---|---|---|---|---|---|---|---|---|---|
| Overall
|
< 18.5
|
18.5–25.0
|
25.0–30.0
|
≥ 30.0
|
|||||||
| No.a | %b | No. | % | No. | % | No. | % | No. | % | ||
| Total | 1 355 | 100 | 33 | 2.4 | 576 | 42.5 | 448 | 33.1 | 298 | 22.0 | NAd |
| Age (years) | |||||||||||
| 20–29 | 543 | 40.1 | 17 | 3.1 | 297 | 54.7 | 158 | 29.1 | 71 | 13.1 | |
| 30–39 | 379 | 28.0 | 5 | 1.3 | 147 | 38.8 | 124 | 32.7 | 103 | 27.2 | < 0.01 |
| 40–49 | 272 | 20.1 | 5 | 1.8 | 85 | 31.3 | 101 | 37.1 | 81 | 29.8 | |
| 50–60 | 161 | 11.9 | 6 | 3.7 | 47 | 29.2 | 65 | 40.4 | 43 | 26.7 | |
| Sex | |||||||||||
| Men | 589 | 43.5 | 13 | 2.2 | 324 | 55.0 | 182 | 30.9 | 70 | 11.9 | < 0.01 |
| Women | 766 | 56.5 | 20 | 2.6 | 252 | 32.9 | 266 | 34.7 | 228 | 29.8 | |
| BMI (mean, standard deviation) | 26.5 | 6.2 | 17.3 | 1.0 | 22.4 | 1.6 | 27.3 | 1.5 | 34.6 | 7.7 | NA |
| Stunting | 364 | 26.9 | 6 | 1.6 | 141 | 38.7 | 126 | 34.6 | 91 | 25.0 | 0.15 |
| Hypertension | 298 | 22.0 | 4 | 1.3 | 88 | 29.5 | 101 | 33.9 | 105 | 35.2 | < 0.01 |
| Blood pressure (in mmHg, mean, standard deviation) | |||||||||||
| Systolic | 119.7 | 16.0 | 110.6 | 12.0 | 116.5 | 14.9 | 120.5 | 16.7 | 125.5 | 17 | < 0.01 |
| Diastolic | 73.2 | 10.0 | 69.2 | 10.3 | 71.2 | 9.4 | 73.3 | 9.3 | 77.4 | 10.7 | < 0.01 |
| Mean arterial pressure | 88.7 | 11.2 | 83.0 | 9.5 | 86.3 | 10.2 | 89.0 | 10.7 | 93.5 | 12.0 | < 0.01 |
| Diabetes | 40 | 3.0 | 1 | 2.5 | 8 | 20.0 | 18 | 45.0 | 13 | 32.5 | 0.03 |
| Chronic kidney disease by stagee | |||||||||||
| No disease | 820 | 63.5 | 19 | 2.3 | 345 | 42.1 | 269 | 32.8 | 187 | 22.8 | |
| I–II | 399 | 30.9 | 11 | 2.8 | 169 | 42.4 | 129 | 32.3 | 90 | 22.6 | 0.29 |
| III–V | 72 | 5.6 | 0 | 0 | 40 | 55.6 | 22 | 30.6 | 10 | 13.9 | |
| Schooling ever | 1 086 | 80.0 | 24 | 2.2 | 458 | 42.2 | 358 | 33.0 | 246 | 22.7 | 0.50 |
| Schooling yearse (mean, standard deviation) | 4.6 | 3.9 | 4.6 | 4.5 | 4.5 | 4.0 | 4.4 | 3.6 | 5.1 | 4.1 | 0.09 |
| Poverty (US$/d/day) e,f | |||||||||||
| < $1 | 434 | 52.7 | 11 | 2.5 | 179 | 41.2 | 144 | 33.2 | 100 | 23.0 | |
| $1–2 | 270 | 32.8 | 8 | 3.0 | 106 | 39.3 | 90 | 33.3 | 66 | 24.4 | 0.44 |
| ≥ $2 | 120 | 14.6 | 4 | 3.3 | 36 | 30.0 | 43 | 35.8 | 37 | 30.8 | |
| Urban living historye | |||||||||||
| Always | 120 | 11.0 | 22 | 3.0 | 313 | 42.6 | 227 | 30.9 | 173 | 23.5 | |
| Sometimes | 233 | 21.4 | 8 | 3.4 | 90 | 38.6 | 83 | 35.6 | 52 | 22.3 | 0.38 |
| Never | 735 | 67.6 | 1 | 0.8 | 51 | 42.5 | 33 | 27.5 | 35 | 29.2 | |
| Tobacco use | 424 | 31.3 | 11 | 2.6 | 223 | 52.6 | 125 | 29.5 | 65 | 15.3 | < 0.01 |
| Alcohol use | 647 | 47.7 | 13 | 2.0 | 313 | 48.4 | 198 | 30.6 | 123 | 19.0 | <0.01 |
| Illicit drug use | 69 | 5.1 | 2 | 2.9 | 40 | 58.0 | 18 | 26.1 | 9 | 13.0 | 0.05 |
| Family medical history | |||||||||||
| Hypertension | 609 | 44.9 | 14 | 2.3 | 252 | 41.4 | 197 | 32.3 | 146 | 24.0 | 0.46 |
| Diabetes | 220 | 16.2 | 7 | 3.2 | 72 | 32.7 | 68 | 30.9 | 73 | 33.2 | < 0.01 |
| Chronic kidney disease e | 170 | 12.6 | 3 | 1.8 | 68 | 40.0 | 48 | 28.2 | 51 | 30.0 | 0.05 |
Or mean where specified.
Or standard deviation where specified.
For categorical variables, P values calculated using chi-squared bivariate analyses and logistic regressions. For continuous variables, P values calculated using linear regressions.
Not applicable.
These categories have < 1 355 participants due to variations in participant responses. Response rates were > 95% for presence of CKD, mean schooling, and family history of CKD. Some participants chose not to answer income questions (824 total responses) and in one of five villages urban residency history was not asked (1 088 total responses).
US$/d/day = United States Dollars per dependent per day. These are the World Bank absolute poverty cut-offs from pre-2008 and are not equivalent to Nicaragua’s national 1998 poverty classification that classified extreme poverty as less than US$ 100/year (US$ 0.27/day) and poverty as less than US$ 185/year (US$ 0.50/day) (25).
The factors associated with obesity (BMI ≥30.0 kg/m2) in this study sample are outlined in Table 2, for all participants and by sex. Stunting correlated with obesity in men (P = 0.05), but not in women. Compared to women, increasing age was a much larger risk factor for obesity among men, which likely reflects diminishing physical activity over time. The same pattern manifested among men with lifelong urban residency and men who had attended school—both groups were less likely to perform physical labor. Interestingly, schooling did not increase a woman’s likelihood of being obese.
TABLE 2.
Risk factors associated with obesity among all male and female study participants in six communities, Nicaragua, 2007–2009
| Risk factor | Adjusted odds ratiosa
|
|||||
|---|---|---|---|---|---|---|
| Total | 95% CIa | Males | 95%CI | Females | 95% CI | |
| Age group (years) | ||||||
| 20–29 (referent) | 1 | 1 | 1 | |||
| 30–39 | 2.09 | 1.35–3.25 | 9.28 | 2.88–29.9 | 1.55 | 0.94–2.55 |
| 40–49 | 2.94 | 1.84–4.71 | 12.6 | 3.98–40.1 | 2.10 | 1.19–3.70 |
| 50–60 | 2.19 | 1.21–3.98 | 9.63 | 2.53–36.7 | 1.39 | 0.69–2.82 |
| Sex (female as referent) | 0.34 | 0.23–0.50 | NAb | NA | ||
| Stunting | 1.37 | 0.92–2.02 | 2.23 | 1.01–4.92 | 1.20 | 0.75–1.92 |
| Hypertension | 2.21 | 1.50–3.24 | 2.86 | 1.33–6.14 | 2.19 | 1.37–3.48 |
| Diabetes | 0.62 | 0.24–1.62 | 0.75 | 0.06–10.02 | 0.64 | 0.23–1.77 |
| Schooling, ever | 1.71 | 1.05–2.78 | 3.07 | 1.04–9.07 | 1.29 | 0.73–2.30 |
| Povertyc | ||||||
| < $1 (referent) | 1 | 1 | 1 | |||
| $1–2 | 1.05 | 0.72–1.54 | 2.37 | 1.05–5.36 | 0.78 | 0.50–1.21 |
| ≥ $2 | 1.78 | 1.09–2.90 | 1.49 | 0.53–4.21 | 1.98 | 1.09–3.59 |
| Urban living history | ||||||
| Always | 1.02 | 0.58–1.81 | 4.39 | 1.18–16.31 | 0.77 | 0.40–1.50 |
| Sometimes | 1.00 | 0.65–1.54 | 0.65 | 0.27–1.59 | 1.19 | 0.72–1.99 |
| Never (referent) | 1 | 1 | 1 | |||
95% Confidence Interval.
Not applicable.
US$ per dependent per day.
Figure 1(a) plots the relationship between income (US$/dependent/day) and BMI (kg/m2) among study participants providing both data metrics. There was a statistically significant predominance of women with BMI > 35 kg/m2 (P < 0.01) and > 40 kg/m2 (P < 0.01). Male study participants were wealthier (P = 0.03). The trend line in Figure 1(b) demonstrates a small positive correlation between income level and BMI. Despite this overall, small, positive association between income and BMI, which trended towards significance, at BMIs > 35 kg/m2 and BMIs > 40 kg/m2 there was no significant difference between income levels. While 52.7% of the total sample lived in extreme poverty, 53.2% of those with a BMI > 35 kg/m2 and 57.1% of those with a BMI > 40 kg/m2 lived in extreme poverty.
FIGURE 1. Relationship between income (US$/dependent/day) and body mass index (BMI, kg/m2) among 817 study participants in six communities, Nicaragua, 2007–2009.
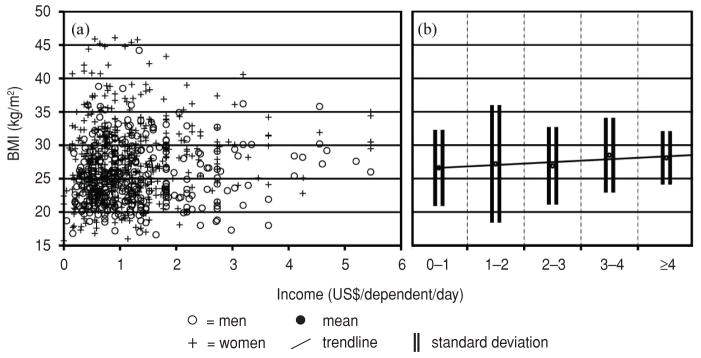
Note: (a) Seven participants for whom this data was available had incomes > US$ 6/dependent/day and were excluded. (b) Trendline for BMI (kg/m2) at discrete US$ 1 income brackets. Trendline Jonckheere–Terpstra STD J–T statistic = 1.78 with a two-tailed significance = 0.08 (0.07–0.08).
Table 3 and Figure 2 further delineate who was obese in each poverty category. Figure 2 demonstrates the prevalence of various other risk factors for chronic disease, sorted by poverty level. Only a history of ever consuming alcohol—Figure 2(e)—was significant (P < 0.01), with those living in poverty or not impoverished much more likely to have ever consumed alcohol than those in extreme poverty. This was likely confounded by sex since women in the study sample drank less and had lower incomes than men. The prevalence of obesity among women at the lowest income levels trended towards significance—Figure 2(a), P = 0.06. Figure 2 demonstrates that obesity had a high prevalence at all socioeconomic levels.
TABLE 3.
Select behaviors and clinical characteristics of obese study participants (n = 203) by income level, in six communities, Nicaragua, 2007–2009
| Income level
|
Pd | ||||||
|---|---|---|---|---|---|---|---|
| < US$ 1/d/daya
|
US$ 1–$ 2/d/day
|
≥ US$ 2/d/day
|
|||||
| Meanb | SDc | Mean | SD | Mean | SD | ||
| Obese participants (n, %) | 100 | 49.3 | 66 | 32.5 | 37 | 18.2 | NAe |
| Body mass index (kg/m2) | 34.5 | 5.2 | 35.8 | 13.7 | 33.5 | 4.0 | 0.83 |
| Blood pressure (mmHg) | |||||||
| Systolic | 127 | 18 | 128 | 18 | 123 | 13 | 0.31 |
| Diastolic | 78 | 10 | 79 | 11 | 78 | 9 | 0.88 |
| Mean arterial pressure | 95 | 13 | 95 | 12 | 93 | 9 | 0.63 |
| Lifetime pack yearsf | 4.1 | 4.0 | 7.4 | 11.7 | 4.9 | 5.4 | 0.71 |
| Annual alcohol consumption (in grams)g | 10 212 | 29 780 | 8 252 | 18 720 | 6 103 | 8 934 | 0.56 |
United States Dollars per dependent per day.
Or n as specified.
Or percent (%) as specified.
Calculated using ANOVA analyses.
Not applicable.
Among past and present smokers.
Among past and present drinkers.
FIGURE 2.

Among obese (BMI ≥ 30.0 kg/m2) Nicaraguans in six communities, percentage (%) prevalence of selected characteristics, comorbidities, and noncommunicable disease risk factors by income classification, Nicaragua, 2007–2009
The sociodemographic factors associated with ever smoking tobacco or ever drinking alcohol are shown in Table 4, with male sex, increasing age, and urban living all independently correlating with tobacco use and alcohol consumption, particularly male sex. This trend likely reflects who has access to and can afford these products: 57.2% of the men versus only 11.4% of the women had ever smoked tobacco; likewise, 80.1% of men versus only 22.8% of women had ever consumed alcohol. Figure 3(a) illustrates the relationship between income (in US$/dependent/day) and total pack years for all former and current smokers (231 study participants) who provided income data. Among smokers, most had smoked < 10 pack years total at all income levels. Note that in Nicaragua, cigarettes are generally sold individually, not by the pack. Figure 3(b) shows a small inverse correlation among smokers between income and total pack years that trended towards significance, evidence that even the poorest smokers can access sufficient tobacco to smoke more frequently than their wealthier smoking counterparts.
TABLE 4.
Risk factors associated with history of ever smoking tobacco or ever drinking alcohol in six communities, Nicaragua, 2007–2009
| Risk factor | Smoking
|
Drinking alcohol
|
||
|---|---|---|---|---|
| AORa | 95% CI | AOR | 95% CI | |
| Age (years) | ||||
| 20–29 (referent) | 1 | 1 | ||
| 30–39 | 1.97 | 1.22–3.18 | 1.50 | 0.97–2.32 |
| 40–49 | 2.91 | 1.80–4.71 | 2.22 | 1.40–3.51 |
| 50–60 | 4.51 | 2.52–8.08 | 3.93 | 2.25–6.88 |
| Sex (female as referent) | 13.0 | 8.8–19.3 | 15.6 | 10.7–22.6 |
| Povertyb | ||||
| < 1 (referent) | 1 | 1 | ||
| 1–2 | 1.10 | 0.73–1.65 | 1.16 | 0.79–1.69 |
| > 2 | 0.91 | 0.54–1.53 | 1.20 | 0.72–1.99 |
| Urban living history | ||||
| Always | 2.42 | 1.31–4.47 | 4.10 | 2.33–7.21 |
| Sometimes | 1.77 | 1.15–2.74 | 1.88 | 1.22–2.88 |
| Never (referent) | 1 | 1 | ||
Adjusted Odds Ratios with 95% Confidence Intervals.
In United States Dollars/dependent/day.
FIGURE 3. Relationship between income (US$/dependent/day) and pack years of tobacco smoking among 231 male and female study participants who were past or current smokers, in six communities, Nicaragua, 2007–2009.
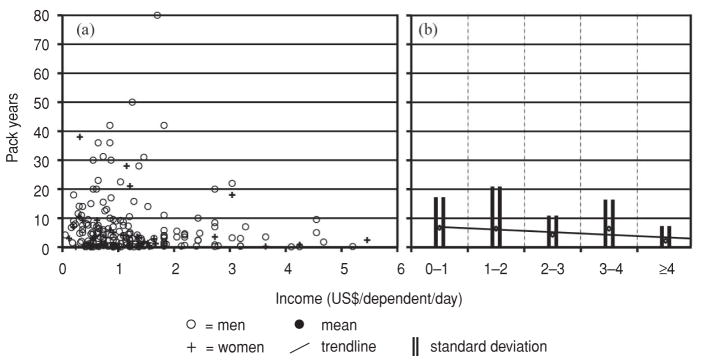
Note: In (b) trendline for pack years at discrete $1 USD income brackets. Trendline Jonckheere–Terpstra Test STD J–T statistic = −1.86 with a two-tailed significance = 0.07 (0.06–0.08).
Due to variations in the questionnaire, all 267 individuals for whom urban/rural living history was unavailable were from the rural village in the Matagalpa department. A full analyses that included this sixth community’s residents coded as “never urban” were also performed, and showed no substantial change from the results presented above. Sensitivity analyses were also performed defining hypertension solely as elevated systolic and/or diastolic reading during study measurement. The results of these analyses did not substantially change the interpretation of the study findings.
DISCUSSION
The prevalence of overweight/obesity has been rising steadily in Nicaragua. In the 1990s, the overweight/obesity rates were 10%–19% nationwide; by 2000–2004, the prevalence had climbed to 40%–49% (26). The current study closely mirrors the WHO data reported in 2008, 55.5% overweight, 22.2% obese (17). It is likely that rates are still trending upward today.
When compared to data collected with similar age inclusion criteria (25–64 years of age) in seven cities located in upper-middle income countries in Latin America (9), the overall prevalence of obesity in this Nicaraguan sample (22.0%) was higher than that of three cities in the other study. However, the prevalence of obesity in men (11.9%) was only higher than in one city (Quito, 10.3%), while the prevalence of obesity in women (29.8%) was higher than all but one of the cities (Mexico City, 30.4%) (9).
Additionally, comparing the prevalence rates of overweight and obesity among this study’s sample to that of Central Americans living in California in 2001 (27) is instructive. Though the Californian sample had fairly similar total rates (overweight/obesity, 61.5%; obesity, 22.2 %), there are marked differences between the sexes. Among the Central American men living in California, the prevalence of overweight was 50.6%, and of obesity, 17.8%. Among the Central American women living in California, the prevalence of overweight was 28.4%, and that of obesity, 26.5% (27).
Both of these comparisons—urban, upper-middle income Latin American and Central American immigrants to California—lend further credence to the idea that elevated BMI more greatly affected women in the Nicaraguan sample. This may be explained, in part, by gender roles in rural Nicaragua, where men tend to perform physical labor, often agricultural, and women tend to do work that is less physical. This would also explain why men with lifelong urban residency, where physical labor is less likely, are more obese.
NCDs have transitioned from impacting predominantly the health of society’s more affluent members to affecting health across the entire socioeconomic spectrum (28). The majority of deaths in Nicaragua (69%) can now be traced to NCDs (17) and the present study clearly demonstrates this trend among NCD risk factors. High BMI is seen at all income levels (Figure 1a), not surprising in a nation where > 95% of households, both rural and urban, use sugar, salt, and oil six to seven times per week. Nationally, fats and sugar account for approximately one-quarter of all caloric intake (14.75% and 11.68%, respectively), with slightly higher rates in urban settings (15.08% and 11.75%, respectively) and slightly lower rates in rural settings (13.93% and 11.51%, respectively). Only grain remains a larger portion of calories consumed, approximately 40% of the national total. Oil and salt are used liberally in fried rice and beans, a staple dish in Nicaragua; while sugar is present in high quantities in bottled sodas and is often used excessively to sweeten coffee and other drinks (29).
Among those who smoke tobacco, an inverse relationship exists between lifetime pack years and income status (Figure 3a), though this relationship only trends towards significance. Even though ever trying cigarettes or alcohol is correlated with some history of urban living, both cigarettes and alcohol tend to be sold in small quantities and consumed in binges, especially by men, in rural Nicaragua. As such, even poor, rural Nicaraguans can purchase these items and engage in these unhealthy behaviors regularly.
While most rural Nicaraguans have access to health care services, they are just beginning to use these services for chronic conditions. Many are unaccustomed to seeking care for anything other than acute conditions. In light of changing dietary patterns (29), deaths from chronic NCDs—whether from chronic deterioration or an acute decompensation linked to chronic deterioration from NCD risk factors—will likely increase among adults in rural Nicaragua until its health care facilities are used as frequently for chronic conditions as they are for acute health problems.
The strengths of this study include a high participation rate (76.9%–86.2% of the eligible adult population in the six communities) and a broad cross-section of Nicaraguan society—both urban and rural from three different departments (Chinandega, León, and Matagalpa) representing five distinct economies. In addition, this study gathered renal health data from all participants, allowing the analyses to be controlled for CKD, important for an area where recent research indicates CKD to be a serious health problem (30). Moreover, the study population was screened for other potential confounding comorbidities (i.e., hypertension and diabetes), which allowed these comorbidities to be correlated with the risk factors studied.
Study limitations
The findings of this study should be interpreted in light of several limitations. Due to logistical constraints, Hemoglobin A1c could not be measured, but instead a different diabetes screening technique was used. Neither hip nor waist circumference was measured and fasting blood work was not drawn, meaning neither serum glucose nor triglyceride/cholesterol level was quantified. However, BMI was carefully measured. Blood pressure measurements were only taken at one session for all study participants, though repeated for elevated values after additional seated rest. Previous diagnosis of hypertension was also carefully elucidated with each study participant. Dietary pattern information was not collected from study participants, though other research that has examined these trends in Nicaragua was consulted.
Conclusions
Of the 1 355 Nicaraguans in this community-based study, greater than one-half were overweight or obese, and approximately one-fifth were obese. Obesity was strikingly more prevalent among women; while smoking and alcohol use were much more common among men. Those not living in poverty (≥ US$ 2/dependent/day) were more likely to be obese. The prevalence of high BMI (both > 35 kg/m2 and > 40 kg/m2) insignificantly correlated with poverty level (extreme poverty, poverty, or not impoverished). Those who had lived in urban settings were more likely to have ever smoked tobacco or consumed alcohol, but urban living did not independently correlate with obesity, except in men with lifelong urban residency.
Chronic diseases and their associated risk factors are now well established in the areas of Nicaragua surveyed by this study. This is a concern because, as in most developing countries, the health clinics were generally built to focus on acute health issues (31). While this was once true in Nicaragua, treatment for chronic diseases is now widely available. Public awareness must be raised so that rural populations seek care for chronic health conditions in greater numbers. A possible catalyst for this change might be the training of local health workers focused on NCDs and their associated risk factors. A similar effort is already underway involving midwives in rural Nicaragua.
The development of low-cost, appropriate screening and risk prediction tools that are specific to Nicaragua could both guide the effort of local health workers and allow for longitudinal monitoring of NCD prevalence and risk factors. Further characterization of those NCD risk factors that this study did not assess would be helpful in planning future interventions.
Educational campaigns targeting the dangers of a diet high in fried foods, sodium, and sugar, and among men, binge drinking, would be useful. Finally, regulating food and beverage advertisers and discouraging access to tobacco and alcohol through financial disincentives—usually taxation—have been validated in settings similar to Nicaragua’s (32, 33).
Acknowledgments
Financial support was provided by: the National Institutes of Health (T35 Grant # 2 T35 DK065521-06; Bethesda, Maryland, United States); University of Pittsburgh, School of Medicine, Medical Alumni Association Scholarship (Pittsburgh, Pennsylvania, United States); University of Pittsburgh, Nationality Rooms Scholarships (Pittsburgh, Pennsylvania, United States); and the National Center for Research (Resources Grant # 5UL1 RR024153-05; Bethesda, Maryland, United States).
The authors wish to thank the people of the six communities in the Chinandega, León, and Matagalpa departments for their collaboration in this study.
Footnotes
Conflicts of interest. Mark Unruh has been a consultant to Abbot Laboratories (Abbot Park, Illinois, United States), Baxter Healthcare Medical Advisory Board (Deerfield, Illinois, United States), Sigma-Tau Pharmaceuticals (Gaithersburg, Maryland, United States), and UCB S.A. (Brussels, Belgium); however, these consulting roles were not related to any part of the study or manuscript preparation. No equipment or medicine made by the above companies was used at any point in the study.
References
- 1.World Health Organization. [Accessed 10 January 2012];2008–2013 Action plan for the global strategy for the prevention and control of noncommunicable diseases: prevent and control cardiovascular diseases, cancers, chronic respiratory diseases and diabetes. Available from: http://whqlibdoc.who.int/publications/2009/9789241597418_eng.pdf.
- 2.Albert KG, Eckel RH, Grundy SM, Zimmet PZ, Cleeman JI, Donato KA, et al. Harmonizing the metabolic syndrome: a joint interim statement of the International Diabetes Federation Task Force on Epidemiology and Prevention; National Heart, Lung, and Blood Institute; American Heart Association; World Heart Federation; International Atherosclerosis Society; and International Association for the Study of Obesity. Circulation. 2009;120(16):1640–5. doi: 10.1161/CIRCULATIONAHA.109.192644. [DOI] [PubMed] [Google Scholar]
- 3.Escobedo J, Schargrodsky H, Champagne B, Silva H, Boissonnet CP, Vinueza R, et al. Prevalence of the metabolic syndrome in Latin America and its association with sub- clinical carotid atherosclerosis: the CARMEL-Across-sectional study. Cardiovasc Diabetol. 2009;8:52. doi: 10.1186/1475-2840-8-52. [DOI] [PMC free article] [PubMed] [Google Scholar]
- 4.López-Jaramillo P. Cardiometabolic disease in Latin America: the role of fetal programming in response to maternal malnutrition. Rev Esp Cardiol. 2009;62(6):670–6. doi: 10.1016/s1885-5857(09)72231-5. [DOI] [PubMed] [Google Scholar]
- 5.Yount KM, Hoddinott J, Stein AD. Disability and self-rated health among older women and men in rural Guatemala: the role of obesity and chronic conditions. Soc Sci Med. 2010;71(8):1418–27. doi: 10.1016/j.socscimed.2010.06.046. [DOI] [PMC free article] [PubMed] [Google Scholar]
- 6.Champagne BM, Sebrié EM, Schargrodsky H, Pramparo P, Boissonnet C, Wilson E. Tobacco smoking in seven Latin American cities: the CARMELA study. Tob Control. 2010;19(6):457–62. doi: 10.1136/tc.2009.031666. [DOI] [PMC free article] [PubMed] [Google Scholar]
- 7.Rehm J, Mather C, Popova S, Thavorncharoensap M, Terrawattananon Y, Patra J. Global burden of disease and injury and economic cost attributable to alcohol use and alcohol-use disorders. Lancet. 2009;373(9682):2223–33. doi: 10.1016/S0140-6736(09)60746-7. [DOI] [PubMed] [Google Scholar]
- 8.The World Bank. [Accessed 13 January 2012];Country and Lending Groups. Available from: http://data.worldbank.org/about/country-classifications/country-and-lending-groups#Upper_middle_income.
- 9.Schargrodsky H, Hernández-Hernández R, Champagne BM, Silva H, Vinueza R, Silva Aycaguer LC, et al. CARMELA: assessment of cardiovascular risk in seven Latin American cities. Am J Med. 2008;121(1):58–65. doi: 10.1016/j.amjmed.2007.08.038. [DOI] [PubMed] [Google Scholar]
- 10.Bustos P, da Silva AA, Amigo H, Bettiol H, Barbieri MA. Metabolic syndrome in young adults from two socioeconomic Latin American settings. Nutr Metab Cardiovasc Dis. 2007;17(8):581–9. doi: 10.1016/j.numecd.2006.06.001. [DOI] [PubMed] [Google Scholar]
- 11.Medina-Lezama J, Morey-Vargas OL, Zea-Díaz H, Bolaños-Salazar JF, Corrales-Medina F, Cuba-Bustinza C, et al. Prevalence of lifestyle-related cardiovascular risk factors in Peru: the PREVENCION study. Rev Panam Salud Publica. 2008;24(3):169–79. doi: 10.1590/s1020-49892008000900003. [DOI] [PubMed] [Google Scholar]
- 12.Groeneveld IF, Solomons NW, Doak CM. Nutritional status of urban schoolchildren of high and low socioeconomic status in Quetzaltenango, Guatemala. Rev Panam Salud Publica. 2007;22(3):169–77. doi: 10.1590/s1020-49892007000800003. [DOI] [PubMed] [Google Scholar]
- 13.Hernández-Hernández R, Silva H, Velasco M, Pellegrini F, Macchia A, Escobedo J, et al. Hypertension in seven Latin America cities: the Cardiovascular Risk Factor Multiple Evaluation in Latin America (CARMELA) study. J Hypertens. 2010;28(1):24–34. doi: 10.1097/HJH.0b013e328332c353. [DOI] [PubMed] [Google Scholar]
- 14.Goldstein J, Jacoby E, del Aguila R, López A. Poverty is a predictor of non-communicable disease among adults in Peruvian cities. Prev Med. 2005;41(3–4):800–6. doi: 10.1016/j.ypmed.2005.06.001. [DOI] [PubMed] [Google Scholar]
- 15.Deaton A. Policy implications of the gradient of health and wealth. Health Aff (Millwood) 2002;21(2):13–30. doi: 10.1377/hlthaff.21.2.13. [DOI] [PubMed] [Google Scholar]
- 16.Fleischer NL, Diez Roux AV, Alazraqui M, Spinelli H. Social patterning of chronic disease risk factors in a Latin American city. J Urban Health. 2008;85(6):923–37. doi: 10.1007/s11524-008-9319-2. [DOI] [PMC free article] [PubMed] [Google Scholar]
- 17.World Health Organization. Noncommunicable diseases country profiles 2011: Nicaragua. Geneva: WHO; 2011. p. 139. [Google Scholar]
- 18.Organización Panamericana de la Salud. CARMEN: Una iniciativa para Conjunto de Acciones para la Reducción Multifactorial de Enfermedades No transmisibles. Washington, DC: OPS; 2003. pp. 3–4. [Google Scholar]
- 19.Collier G, Greenan MC, Brady JJ, Murray B, Cunningham SK. A study of the relationship between albuminuria, proteinuria, and urinary reagent strips. Ann Clin Biochem. 2009;46(3):247–9. doi: 10.1258/acb.2009.008189. [DOI] [PubMed] [Google Scholar]
- 20.Korpi-Steiner NL, Williamson EE, Karon BS. Comparison of three whole blood creatinine methods for estimation of glomerular filtration rate before radiographic contrast administration. Am J Clin Pathol. 2009;132(6):920–6. doi: 10.1309/AJCPTE5FEY0VCGOZ. [DOI] [PubMed] [Google Scholar]
- 21.Levey AS, Coresh J, Greene T, Steven LA, Zhang YL, Hendriksen S, et al. Using standardized serum creatinine values in the modification of diet in renal disease study equation for estimating glomerular filtration rate. Ann Intern Med. 2006;145(4):247–54. doi: 10.7326/0003-4819-145-4-200608150-00004. [DOI] [PubMed] [Google Scholar]
- 22.Levey AS, Coresh J, Balk E, Kausz ET, Levin A, Steffes MW, et al. National Kidney Foundation practice guidelines for chronic kidney disease: evaluation, classification, and stratification. Ann Intern Med. 2003;139(2):137–47. doi: 10.7326/0003-4819-139-2-200307150-00013. [DOI] [PubMed] [Google Scholar]
- 23.Davies MJ, Williams DR, Metcalfe J, Day JL. Community screening for non-insulin- dependent diabetes mellitus: self-testing for post-prandial glycosuria. Q J Med. 1993;86 (10):677–84. doi: 10.1093/qjmed/86.10.677. [DOI] [PubMed] [Google Scholar]
- 24.Ravallion M, Shaohua C, Sangraula P. Dollar a Day Revisited. World Bank Econ Rev. 2009;23(2):163–184. [Google Scholar]
- 25.Gobierno de Nicaragua Instituto de Estadísticas y Censos. Perfil y características de los pobres en Nicaragua. Encuesta Nacional de Hogares sobre Medición de Nivel de Vida; Proyetco MECOVI; 2001(Feb); 1998. pp. 1–91. [Google Scholar]
- 26.Rueda-Clausen CF, Silva FA, López-Jaramillo P. Epidemic of overweight and obesity in Latin America and the Caribbean. Int J Cardiol. 2008;125(1):111–2. doi: 10.1016/j.ijcard.2006.12.092. [DOI] [PubMed] [Google Scholar]
- 27.Bowie JV, Juon HS, Cho J, Rodriguez EM. Factors associated with overweight and obesity among Mexican Americans and Central Americans: results from the 2001 California Health Interview Survey. Prev Chronic Dis. 2007;4(1):A10. [PMC free article] [PubMed] [Google Scholar]
- 28.Biggs B, King L, Basu S, Stuckler D. Is wealthier always healthier? The impact of national income level, inequality, and poverty on public health in Latin America. Soc Sci Med. 2010;71(2):266–73. doi: 10.1016/j.socscimed.2010.04.002. [DOI] [PubMed] [Google Scholar]
- 29.Organización de las Naciones Unidas para la Alimentación y la Agricultura. [Accessed 8 January 2012];Seguridad Alimentaria y Nutricional — Nicaragua. 2004 Available at: www.rlc.fao.org/iniciativa/cursos/Curso%202006/Mod3/9e.pdf.
- 30.Torres C, Aragón A, González M, López I, Jakobsson K, Elinder CG, et al. Decreased kidney function of unknown cause in Nicaragua: a community based survey. Am J Kidney Dis. 2010;55(3):485–96. doi: 10.1053/j.ajkd.2009.12.012. [DOI] [PubMed] [Google Scholar]
- 31.Allotey P, Reidpath DD, Yasin S, Chan CK, de-Graft Aikins A. Rethinking health-care systems: a focus on chronicity. Lancet. 2011;377(9764):450–1. doi: 10.1016/S0140-6736(10)61856-9. [DOI] [PubMed] [Google Scholar]
- 32.Asaria P, Chisholm D, Mathers C, Ezzati M, Beaglehole R. Chronic disease prevention: health effects and financial costs of strategies to reduce salt intake and control tobacco use. Lancet. 2007;370(9604):2044–53. doi: 10.1016/S0140-6736(07)61698-5. [DOI] [PubMed] [Google Scholar]
- 33.Cecchini M, Sassi F, Lauer JA, Lee YY, Guajardo-Barron V, Chisholm D. Tackling of unhealthy diets, physical inactivity, and obesity: health effects and cost-effectiveness. Lancet. 2010;376(9754):1775–84. doi: 10.1016/S0140-6736(10)61514-0. [DOI] [PubMed] [Google Scholar]