

A large proportion of the natural variation in flowering in Arabidopsis thaliana accessions is due to noncoding cis polymorphisms that define distinct haplotypes of FLOWERING LOCUS C (FLC). Li et al. find that a single natural intronic polymorphism in one haplotype affects FLC expression and thus flowering by specifically changing splicing of the FLC antisense transcript COOLAIR. Altered antisense splicing increases FLC expression via a cotranscriptional mechanism involving capping of the FLC nascent transcript.
Keywords: FLOWERING LOCUS C, COOLAIR, alternative splicing, flowering time, RNA capping/decapping
Abstract
The extent to which natural polymorphisms in noncoding sequences have functional consequences is still unknown. A large proportion of the natural variation in flowering in Arabidopsis thaliana accessions is due to noncoding cis polymorphisms that define distinct haplotypes of FLOWERING LOCUS C (FLC). Here, we show that a single natural intronic polymorphism in one haplotype affects FLC expression and thus flowering by specifically changing splicing of the FLC antisense transcript COOLAIR. Altered antisense splicing increases FLC expression via a cotranscriptional mechanism involving capping of the FLC nascent transcript. Single noncoding polymorphisms can therefore be a major contributor to phenotypic evolution through modulation of noncoding transcripts.
Understanding the molecular basis of natural phenotypic change is a central question in biology (Alonso-Blanco and Mendez-Vigo 2014). We are studying the variation underpinning the adaptive evolution of Arabidopsis thaliana accessions focusing on flowering time, a trait with considerable fitness consequences (Dittmar et al. 2014). A large proportion of the natural variation in flowering maps to the floral repressor locus FLOWERING LOCUS C (FLC) (Shindo et al. 2006). Functionally distinct FLC haplotypes exist in the worldwide population, distinguished by polymorphisms in noncoding regions that influence expression level and the rate of epigenetic silencing of the gene (Li et al. 2014).
FLC regulation involves pathways that link different aspects of chromatin regulation with a set of antisense transcripts collectively called COOLAIR (Swiezewski et al. 2009; Liu et al. 2010; Castaings et al. 2014; Marquardt et al. 2014). Different FLC expression states are linked to alternative splicing and alternative polyadenylation of COOLAIR (Liu et al. 2007, 2010). Low FLC expression is associated with use of a small intron and polyadenylation at a proximal region, so-called class I COOLAIR variants (Liu et al. 2007; Hornyik et al. 2010; Marquardt et al. 2014; Wang et al. 2014). High FLC expression is associated with use of a large intron and polyadenylation at a distal region, the class II variants (Fig. 1). Cold exposure also influences COOLAIR splicing and polyadenylation (Swiezewski et al. 2009). This sense–antisense transcriptional circuitry raises the possibility that the noncoding cis polymorphism defining the FLC haplotypes might affect FLC function through changed COOLAIR processing. Here, we show that a single natural noncoding polymorphism can significantly change COOLAIR splicing. This SNP is a major contributor to the functional specialization of one of the FLC haplotypes. The study has significant implications for understanding the molecular basis of phenotypic evolution.
Figure 1.
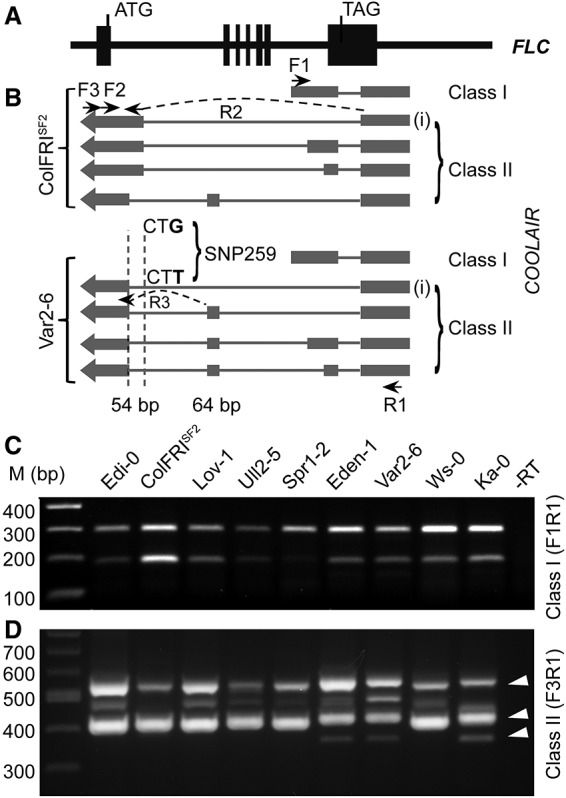
SNP259 in FLC influences COOLAIR splicing. (A,B) Schematic illustration of alternative COOLAIR splicing and polyadenylation in Col FRISF2 (FRI from SF-2 accession) and Var2-6. (Black boxes) FLC exons; (grey boxes) COOLAIR exons. The position of SNP259 (Col-0/Var2-6: G/T) is indicated; the nucleotides CT show the splice acceptor site for COOLAIR class II transcripts (“i” is marked). Arrows show PCR primers used to assay splicing; arrows plus a dashed line show primers that cover an exon–intron junction. The 54-base-pair (bp) shift of the COOLAIR acceptor site is highlighted with two vertical dashed lines, and the 64-bp additional exon is marked. (C) The COOLAIR class I splicing pattern is the same in a set of accessions representing the different FLC haplotypes. The RT–PCR primers F1 and R1 are as shown in B. For class I, the lower band is due to mispriming of the F1 oligo and represents unspliced class I COOLAIR. (D) COOLAIR class II is alternatively spliced in a set of accessions representing different FLC haplotypes. The RT–PCR primers F3 and R1 are as shown in B. The arrowheads indicate the characteristic COOLAIR splicing changes in accessions containing the SNP259T polymorphism.
Results and Discussion
A. thaliana accessions show variable COOLAIR processing
We surveyed different FLC haplotypes for altered splicing patterns of COOLAIR (Fig. 1A,B) and identified one haplotype characterized by the accessions Var2-6 and Eden-1 with a distinct COOLAIR class II splicing profile but unchanged class I profile (Fig. 1C,D). The accessions containing this haplotype are predominantly found in northern Sweden (Fig. 2A; Supplemental Table S1) and are generally later flowering than other A. thaliana accessions (Fig. 2B; Supplemental Table S1), and all consistently show higher than average FLC expression (Li et al. 2014). We introgressed one representative allele from this haplotype (from the Var2-6 accession) into Columbia and then compared expression levels in the presence and absence of FRIGIDA (FRI), the major up-regulator of FLC expression (Lee et al. 1994; Johanson et al. 2000). The Var2-6 allele was more strongly expressed than the Col allele in a common fri background, with the relative up-regulation by FRI higher for the Col (17.4-fold) than the Var-2-6 (5.2-fold) allele (Fig. 2C,D). This genetic interaction suggests that cis polymorphism in the Var2-6 FLC allele contributes to a higher expression level, potentially through a mechanism similar to FRI function.
Figure 2.
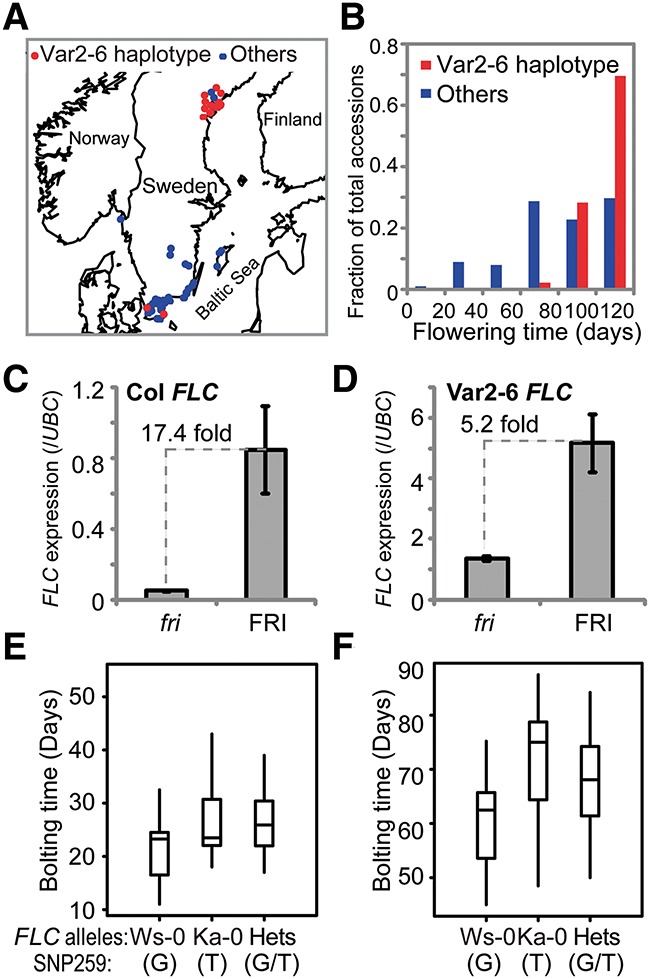
The Var2-6 FLC allele confers higher FLC expression and later flowering. (A) The Var2-6 FLC haplotype shows a distinct geographical distribution. Forty-six accessions carrying the Var2-6 haplotype are shown as red dots, and 101 accessions carrying other FLC haplotypes are shown as blue dots. The map was generated in R based on the latitude and longitude information of accessions (Supplemental Table S1). (B) Accessions carrying the Var2-6 FLC haplotype are later flowering than accessions carrying other FLC haplotypes. The flowering time of 120 d indicates that the plants did not flower when the experiment was finished. The Kolmogorov-Smirnov (KS) test indicated that the flowering time difference between Var2-6 haplotypes and the other accessions is significant (P < 0.001). (C) FLC expression of the Col allele in plants with and without active FRI. (D) FLC expression of the Var2-6 allele in plants with and without active FRI. Values in C and D are means ± SD from three biological repeats. The fold change in FLC expression between Col and Var2-6 FLC in fri is 28, and the fold change in FRI is 6. (E,F) SNP259T is associated with late flowering in an F2 population generated from a cross between Ka-0 and Ws-0 in fri (E) and FRI (F) homozygotes. The KS test indicated that the flowering time difference between plants containing the Ka-0 FLC allele and the Ws-0 allele is significant (P < 0.05).
SNP259 affects splicing of COOLAIR
DNA sequence comparison between the Var2-6 and Col-0 FLC alleles revealed 43 polymorphisms. One was in the FLC coding region and introduces a synonymous nucleotide change in exon 7, so the Var2-6 FLC allele encodes a protein identical to Col-0 (Supplemental Table S2). The other polymorphisms were in noncoding regions with one, SNP259 Col-0/Var2-6: G/T, located next to the acceptor splice site of the intron of class II-i COOLAIR (Fig. 1B; Supplemental Table S2; Liu et al. 2007, 2010; Marquardt et al. 2014). The functional relevance of SNP259 was explored through analysis of an F2 population from a cross between accessions Ka-0 and Ws-0. These accessions have highly related FLC alleles differing only in SNP259 (Ws-0/Ka-0: G/T) and five other polymorphisms within a 22-base-pair (bp) region (Ws-0/Ka-0: C-AAA/TTTTT). The T nucleotide at SNP259 associated with later flowering (Fig. 2E,F) and a COOLAIR splicing profile similar to that in Var2-6 (Fig. 1D). These analyses implicated SNP259T in the increased expression of FLC, potentially through an influence on COOLAIR splicing.
The SNP259T polymorphism was found to significantly reduce use of the splice acceptor site of the class II-i COOLAIR intron (Fig. 3A) and increase use of an acceptor site 54 bp downstream (Fig. 1B). This change caused additional alternative splicing of COOLAIR and inclusion of an additional 64-bp exon rarely found in COOLAIR transcripts of the Col haplotype (Fig. 1B). All of the accessions containing the SNP259T polymorphism showed this additional COOLAIR exon (Fig. 3A). To confirm that the G259T polymorphism adjacent to the COOLAIR splice acceptor site was the cause of these functional differences, we undertook mutagenesis experiments, reciprocally mutating Col-0 FLC to G259T and Var2-6 FLC to T259G (Fig. 3B). The Col-G259T mutation changed the pattern of COOLAIR splicing so that it contained the additional exon, resembling Var2-6 FLC (Fig. 3C; Supplemental Figs. S1, S2A). The Var-T259G changed the pattern of COOLAIR splicing so that it resembled Col FLC (Fig. 3D; Supplemental Figs. S1, S2B). No difference was detected in FLC sense transcript splicing (Fig. 3E,F). The G259T mutation caused an increase, and the T259G mutation caused a decrease in FLC expression in transgenic plants (Fig. 4A,B). Taken together, the results indicate that the single G259T polymorphism contributes to increased FLC expression through specific modulation of COOLAIR class II splicing (Fig. 1B).
Figure 3.
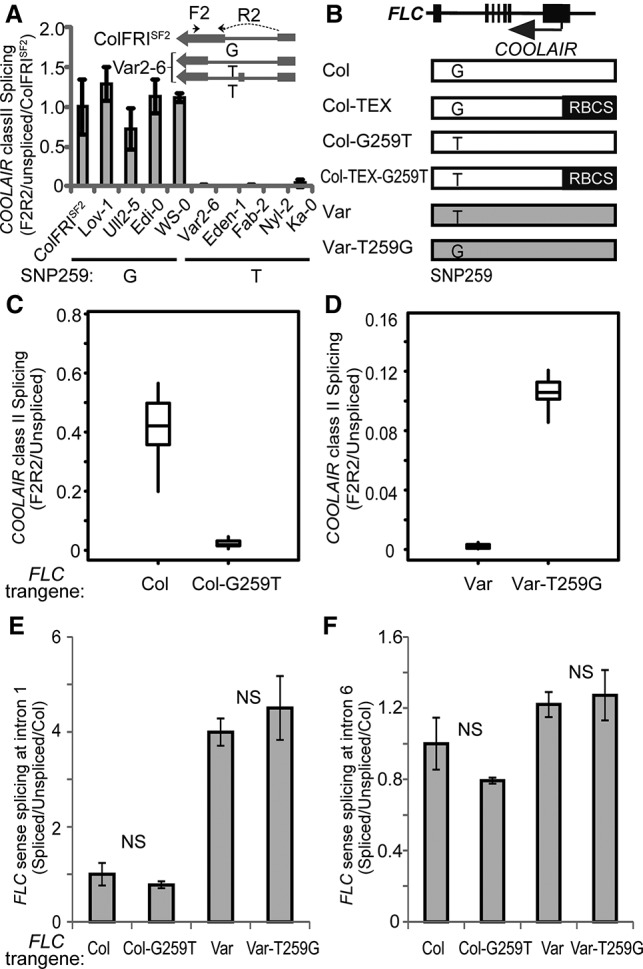
SNP259 specifically regulates COOLAIR alternative splicing. (A) Accessions with nucleotide SNP259T show reduced COOLAIR class II-i splicing compared with those containing SNP259G. Splicing efficiency was measured with quantitative PCR (qPCR) using the primers F2R2 and normalized to unspliced COOLAIR transcript levels at the same region. Next, the splicing efficiency was normalized to the value in ColFRISF2. The inset shows the position of primer F2R2 for qPCR analysis of COOLAIR variants in ColFRISF2 and Var2-6. Multiple accessions containing different FLC haplotypes are shown (Li et al. 2014). (B) Schematic illustration of the reciprocal SNP259 constructs in Col, Var2-6 FLC alleles, and Col FLC with RBCS terminator replacement at the COOLAIR promoter region. FLC and COOLAIR are illustrated at the top. RBCS in black bars shows the replacement of the COOLAIR promoter. The Col-0 and Var2-6 FLC alleles are indicated with white and grey boxes. (C) G259T mutation in Col FLC caused decreased COOLAIR class II-i splicing in multiple randomly selected transgenic lines. (D) T259G mutation in Var2-6 FLC caused increased COOLAIR class II-i splicing in multiple randomly selected transgenic lines. In C and D, each box plot shows the qPCR data of 10 randomly selected independent transgenic plants for each construct. (E) G259T heterogeneity did not influence FLC sense intron 1 splicing. The Student's t-tests indicated that the FLC sense intron 1 splicing between Col and Col-G259T or Var and Var-T259G are not significant ([NS]P > 0.05). (F) G259T heterogeneity did not influence FLC sense intron 6 splicing. Values in A, E, and F are means ± SD from three biological repeats. The Student's t-tests indicated that the FLC sense intron 6 splicing between Col and Col-G259T or between Var and Var-T259G is not significant ([NS] P > 0.05).
Figure 4.
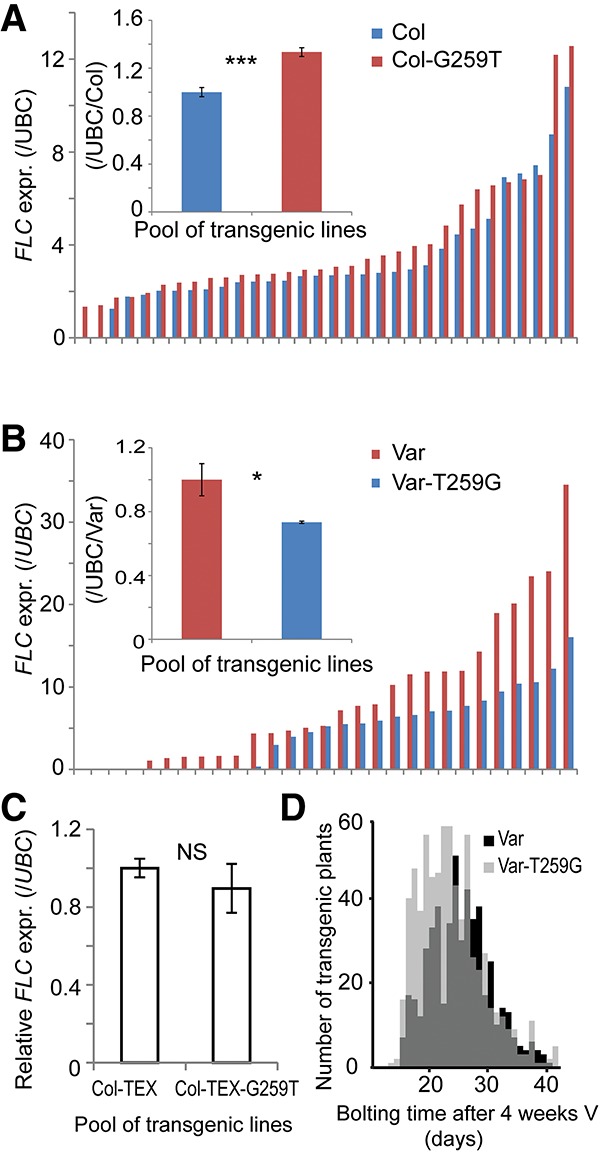
G259T heterogeneity affects FLC expression in a COOLAIR-dependent mechanism. (A) The G259T mutagenesis in Col FLC increased FLC expression, as assayed using a pool of 48 independent transgenic lines (Student's t-test, [***] P < 0.001) and 32 randomly selected independent transgenic lines. (B) T259G mutagenesis in Var2-6 FLC decreased FLC expression, as assayed using a pool of 48 independent transgenic lines (Student's t-test, [*] P < 0.05) and 29 randomly selected independent transgenic lines. (C) G259T did not change FLC expression in a COOLAIR terminator exchange construct, as assayed using pools from 21 and 32 independent transgenic lines: Col-TEX and Col-TEX-G259T (Student's t-test, [NS] P = 0.216). (D) Flowering time comparison of Var/FRI flc-2 and Var-T259G/FRI flc-2 of plants given 4 wk of vernalization. Forty-five and 60 independent transgenic lines were scored, with eight individuals of each line included. The KS test indicated that the difference between transgenic lines is significant (P < 0.001). In A–C, values are means ± SD from three biological repeats. All of the transgenic plants shown in A–D were in a FRI flc-2 background.
To assess whether the G259T polymorphism regulated FLC expression directly as well as indirectly via COOLAIR, we generated the G-to-T mutation at nucleotide 259 in an allele of FLC attenuated in the production of COOLAIR. We previously generated a Col FLC terminator exchange transgene (Col-TEX) in which the COOLAIR promoter had been replaced with an RBCS 3′ terminator region. Production of class I and class II COOLAIR transcripts was disrupted in this transgene, although some unspliced nascent antisense transcript was still produced (Supplemental Fig. S3; Csorba et al. 2014; Marquardt et al. 2014; Wang et al. 2014). The G259T polymorphism was introduced into Col-TEX to produce Col-TEX-G259T (Fig. 3B). Plants carrying Col-TEX-G259T expressed FLC at the same level as and flowered at a time similar to those carrying the wild-type Col-TEX transgene (Fig. 4C; Supplemental Fig. S4), indicating that the G259T up-regulation of FLC expression requires aspects of COOLAIR disrupted in Col-TEX. Since the G259T polymorphism increases FLC expression, we also asked whether it affected vernalization response. Transgenic lines carrying the Var2-6 FLC transgene showed higher FLC expression before, during, and after vernalization compared with lines carrying a Var-T259G FLC transgene (Supplemental Fig. S5). They also flowered considerably later after 4-wk vernalization (Fig. 4D). The SNP259T polymorphism thus increases FLC expression in all conditions and as such would confer a requirement for longer vernalization in natural conditions.
COOLAIR splicing affects the degree of capping of the FLC nascent transcript
Our earlier genetic analysis suggested that cis polymorphism in the Var2-6 FLC allele might up-regulate FLC expression through a mechanism similar to FRI function (Fig. 2C,D). FRI increases the proportion of FLC transcripts carrying a 5′ cap (Geraldo et al. 2009), a structure that influences the cotranscriptional fate of nascent transcripts and the stability and translation of spliced transcripts. We compared the 5′ capping of FLC transcripts in different genotypes using an RNA adaptor ligation-mediated PCR assay (Supplemental Fig. S6; Geraldo et al. 2009) and found that a higher proportion of the Var2-6 FLC transcripts have a 5′ cap, similar to the functional effect of FRI (Fig. 5A). Mutation of SNP259 G to T in the Col FLC allele recapitulated the Var2-6 molecular phenotype (Fig. 5B); thus, a single polymorphism (from the 43 that distinguish the Var2-6 from Col FLC) is sufficient to change the proportion of FLC transcripts carrying a 5′ cap. Changes in COOLAIR processing therefore appear to influence FLC expression via a mechanism involving the level of capping of the FLC transcript.
Figure 5.
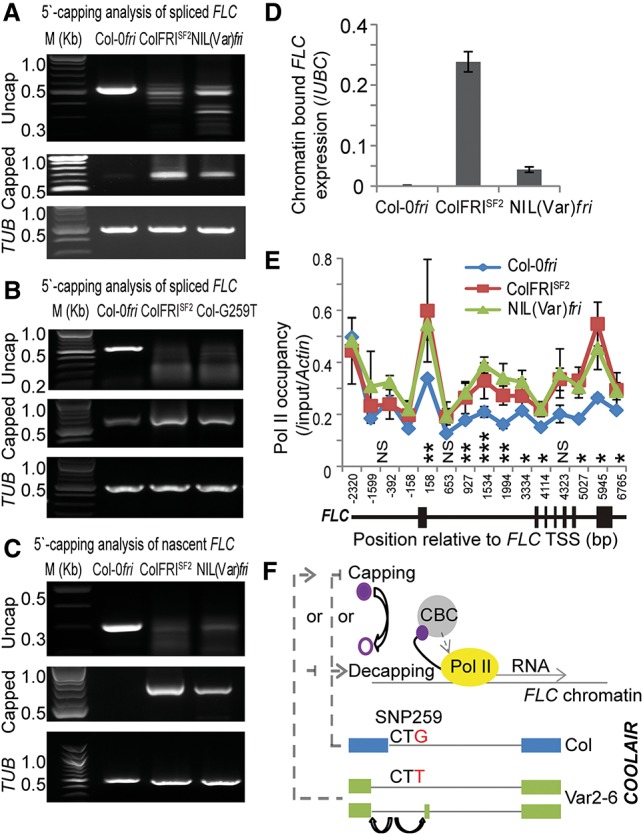
COOLAIR alternative splicing links cotranscriptionally to changed transcription and capping of the FLC nascent transcript. (A) FRI and the Var2-6 FLC allele both alter the proportion of transcripts with a 5′ cap. NIL(Var)fri is the near isogenic line (NIL) with Var2-6 FLC introgressed into a Col-0 fri background. (B) The single SNP259T polymorphism similarly alters the proportion of transcripts with a 5′ cap. The transgenic Col-G259T plants are in a Col flc-2 fri background. The amplified fragment from the uncapped transcript initiates at 5′-AATCAAGCGAATTGAGAACA-3′. (C) The 5′ capping analysis of chromatin-bound nascent FLC. The amplified fragment from the uncapped transcript initiates at 5′-AAAAAACAATTAATATACCG-3′. In A–C, TUBULIN was used as an internal control. (D) Comparison of chromatin-bound nascent FLC expression between Col-0fri, ColFRISF2, and NIL(Var)fri. (E) Chromatin immunoprecipitation (ChIP) analysis shows that total RNA polymerase II (Pol II) is more enriched over FLC in NIL(Var)fri and ColFRISF2 compared with Col-0fri. ACTIN was used as an internal control. The position of qPCR primers is relative to the FLC transcription start site (TSS). In D and E, values are means ± SD from three biological repeats (Student's t-test, [*] P < 0.05; [**] P < 0.01; [***] P < 0.001). (F) Model of how SNP259 polymorphisms cotranscriptionally regulate FLC expression (Hossain et al. 2013). (Solid purple circle) The 5′ cap at FLC transcripts; (open purple circle) an uncapped FLC transcript; (CBC) the cap-binding complex; (dashed lines) proposed effects of COOLAIR on capping/decapping.
Capping/decapping reactions occur on transcripts in both the cytoplasm and the nucleus (Ramaiah et al. 2012). Analysis of chromatin-bound FLC RNA showed that the SNP259 effect on capping occurs on the FLC nascent transcript in the nucleus (Fig. 5C) and is associated with higher levels of chromatin-bound FLC transcript (Fig. 5D). We interpret these data as suggesting that SNP259 impacts FLC expression through a cotranscriptional mechanism linking antisense splicing with sense strand transcription/capping. Chromatin immunoprecipitation (ChIP) experiments showed that RNA polymerase II (Pol II) levels were approximately twofold higher at the Var2-6 FLC allele introgressed into Col as compared with a Col FLC allele, similar to the effect of FRI on Col FLC (Fig. 5E). The transgenic plants containing the reciprocal SNP259 polymorphisms showed opposing H3K27me3 and H3K36me3 profiles, reinforcing the conclusion that SNP259 influences transcriptional dynamics at FLC (Supplemental Fig. S7A,B; Supplemental Table S3). These data are all consistent with the primary effect of SNP259 resulting in a COOLAIR variant that up-regulates transcription of FLC (or represses less well than other COOLAIR class II variants). How a COOLAIR variant (an antisense transcript) influences transcription of FLC remains to be established, but COOLAIR class II variants are associated with chromatin at the 5′ end of FLC (Csorba et al. 2014). The SNPG259T may positively influence RNA Pol II dynamics or promote efficient transition to elongation and/or stability of the nascent or spliced transcript, which feeds back to promote transcription (Fig. 5F; Haimovich et al. 2013; Hossain et al. 2013; Bentley 2014).
A single noncoding polymorphism, SNP259, is a major contributor to the functional specialization of one of the FLC haplotypes
The FLC haplotype carrying the SNP259T is predominantly found in accessions that occur in the high latitudes of northern Sweden (Li et al. 2014), where plants experience long cold seasons (Fig. 2A; Supplemental Table S1; climate data from north and south Sweden found at http://www.sweden.climatemps.com). Higher FLC expression and an increased vernalization requirement are likely to be adaptively important in these regions, enabling plants to avoid precocious flowering before winter is over. This significant change in reproductive timing behavior is the result of a single polymorphism in a noncoding region of a locus. This should provide an important paradigm in the many studies associating polymorphism with phenotypic variation. It will also influence the debate over the different types of molecular variation that underpin adaptive evolution (Halligan et al. 2013).
Materials and methods
Plant materials and growth conditions
Transgenic lines were obtained, and plants grown as described previously (Coustham et al. 2012). Vernalization was performed at 5°C under short day (8 h of light) conditions, and the vernalized plants were moved back to warm growth conditions afterward. Flowering time was assayed by days to flower. If the plants had not flowered after 120 d, then the experiment was stopped, and the flowering time was scored as 120 d.
FLC expression analysis
FLC expression analysis was performed as described (Coustham et al. 2012). Extensive transgenic line variability was found when comparing independent lines carrying the same FLC transgene. In order to average this variability and quantify FLC expression, we generated a large number of independent transgenic lines for each transgene and pooled seedlings independently three times for the biological replication for RNA extraction and gene expression analyses.
Association analysis between FLC alleles and flowering time in an F2 population
An F2 population was generated by crossing the accession Ws-0 with Ka-0 and selfing the resulting F1. Two-hundred-eighty-eight F2 individuals were stratified for 3 d at 5°C and grown after no vernalization in long days (16 h light/8 h dark), and bolting time was assayed. The individuals of the F2 population were genotyped with specific PCR markers for Ws-0 and Ka-0 FLC alleles (Forward primer, 5′-GTGTTGTGTGTCCAATGTCCATGT-3′; Reverse primer, 5′-AACCAAAATGCCCTAATCTTGAG-3′) and FRI alleles (Forward primer, 5′-TACACAAGGATTTTATCATGGGATTAT-3′; Reverse primer, 5′-GTTTCGACAATCTTCGGTAATTCTC-3′). The association between bolting time and Ws-0 and Ka-0 FLC alleles was analyzed in the two subpopulations containing Ws-0 FRI and Ka-0 fri separately. The box plot and statistical analysis in this study were performed in Gene Stat edition 9 with default parameters (Ripatti et al. 2009).
Sequence alignment
FLC sequences were aligned and exported with BioEdit package version 7.0.9.0 with default parameters (Hall 1999).
COOLAIR intron splicing analysis
COOLAIR class I was amplified with primers F1 (5′-TGGTTGTTATTTGGTGGTGTG-3′) and R1 (5′-GCCGTAGGCTTCTTCACTGT-3′). Class II was amplified with primers F3 (5′-GTATCTCCGGCGACTTGAAC-3′) and R1. PCR fragments were assayed in agarose gel, cloned into pGEM-T Easy Vector (Promega), and sequenced. For the COOLAIR class II-i intron splicing assay, cDNA was synthesized with the RT primer UBC-RP, F2, and unspliced COOLAIR in distal region LP and quantified with the quantitative PCR (qPCR) primers F2 (5′-CTCCTCCGGCGATAAGTA-3′) and R2 (5′-CTCACACGAATAAGAAAAGTAAAA-3′). Unspliced COOLAIR in the distal region was amplified with primers LP (5′-CGCAATTTTCATAGCCCTTG-3′) and RP (5′-CTTTGTAATCAAAGGTGGAGAGC-3′). SNP259/T-mediated class II splicing was quantified with primer F2 and R3 (5′-GAAAAAAACCAAACGGTAAGGAAA-3′). The intron splicing was calculated by normalizing spliced to unspliced COOLAIR. The PCR position is shown in Figure 1B. The internal control for qRT–PCR is UBC with primers 5′-CTGCGACTCAGGGAATCTTCTAA-3′ and 5′-TTGTGCCATTGAATTGAACCC-3′. The sequences of COOLAIR splicing variants in Var2-6 were submitted to GenBank (accession no. KP792767-792771).
FLC sense splicing analysis
We analyzed the intron splicing in FLC introns 1 and 6. For intron 1, 2.5 μg of total RNA was treated with Turbo DNase-free kit (Ambion) and reverse-transcribed with primer 5′-CAAGGCTTTAAGATCATCAGCA-3′. Spliced FLC expression was assayed with primers 5′-GAGAGAAGCCATGGGAAGAA-3′ and 5′-AGGTTATCGCCGGAGGAG-3′, and unspliced FLC expression was assayed with primers 5′-AAAAGTGGAAATTVAGATGTGCT-3′ and 5′-TTGAAAAGGCCACTGGAAAC-3′. For intron 6, 2.5 μg of total RNA was transcribed with primer 5′-GGAGAGTCACCGGAAGATTG-3′. Spliced FLC expression was assayed with primers 5′-AAATGCTGAAAGAAGAGAACCAG-3′ and 5′-GGAGAGTCACCGGAAGATTG-3′, and unspliced FLC expression was assayed with primers 5′-TGGTTGTTATTTGGTGGTGTG-3′ and 5′-TCTCCATCTCAGCTTCTGCTC-3′. The intron splicing efficiency was calculated by normalizing the spliced FLC expression level to the unspliced FLC expression level for intron 1 and intron 6, respectively. The internal control for qRT–PCR was UBC.
Capping analysis of FLC RNA
The capping analysis of spliced FLC RNA was performed using the FirstChoice RLM-RACE kit (Life Technologies) following the procedure described previously (Geraldo et al. 2009). After the first round of PCR, the PCR product was treated with 0.5 U of exonuclease I (New England Biolabs) and 0.25 U of alkaline phosphatase (shrimp) (Roche) for 30 min at 37°C and 5 min at 95°C and used for nested PCR. For the 5′ capping analysis of nascent FLC, the chromatin RNA was prepared as follows: The nuclei were extracted with Honda buffer (0.44 M sucrose, 1.25% Ficoll, 2.5% dextran T40, 20 mM Hepes KoH at pH 7.4, 10 mM MgCl2, 0.5% Triton X-100, 5 mM DTT, 1 mM PMSF, 1× EDTA-free Complete protease inhibitor [Roche], 100 μg/mL yeast tRNA, 40 U/mL Superase In RNase inhibitor [Ambion], 5 mM β-mercaptoethanol) and washed with urea/NP40 buffer (20 mM Tris at pH 8.0, 300 mM NaCl, 7.5 mM MgCl2, 0.2 mM EDTA, 1 mM DTT, 1 M Urea, 1% Igepal CA-630, 1× EDTA-free Complete protease inhibitor [Roche], 20 U/mL Superase In RNase inhibitor [Ambion]). Next, the chromatin pellet was extracted with the hot phenol method for RNA preparation (Box et al. 2011). 5′ capping analysis was performed using Turbo DNase-treated chromatin RNA following the same procedure. The FLC-specific primers for capping analysis were 5′-CCCATAGCAACTCTATAGATCTCCCGTAA-3′ and 5′-CATCGAGCACGCATCAGATCGTATCAAAC-3′. The nested PCR products of all samples were cloned into pGEM-T Easy Vector (Promega) and sequenced with M13 forward primer to confirm the sequence identity.
ChIP assay
The histone modification and Pol II occupancy assays were performed as described previously (Wang et al. 2014; Yang et al. 2014). The qPCR primers for the ChIP assay are included in Supplemental Table S2. For histone modification assays, anti-Histone H3 (trimethyl K27) antibody (Millipore, 07-449), anti-Histone H3 antibody (Abcam, ab1791), and anti-Histone H3 (trimethyl K36) antibody (Abcam, ab9050) were used. For the total Pol II occupancy assay, anti-RNA polymerase II CTD repeat YSPTSPS antibody [8WG16] (Abcam, ab817) was used for ChIP analysis.
Supplementary Material
Acknowledgments
We thank all members of the Dean and Howard groups for discussions. This research was supported by the UK Biotechnology and Biological Sciences Research Council (BBSRC) grant BB/I007857/1, Institute Strategic Programme grant BB/J004588/1 and European Research Council Advanced Investigator grants ENVGENE and MEXTIM.
Footnotes
Supplemental material is available for this article.
Article published online ahead of print. Article and publication date are online at http://www.genesdev.org/cgi/doi/10.1101/gad.258814.115.
Freely available online through the Genes & Development Open Access option.
References
- Alonso-Blanco C, Mendez-Vigo B. 2014. Genetic architecture of naturally occurring quantitative traits in plants: an updated synthesis. Curr Opin Plant Biol 18C: 37–43. [DOI] [PubMed] [Google Scholar]
- Bentley DL. 2014. Coupling mRNA processing with transcription in time and space. Nat Rev Genet 15: 163–175. [DOI] [PMC free article] [PubMed] [Google Scholar]
- Box MS, Coustham V, Dean C, Mylne JS. 2011. Protocol: a simple phenol-based method for 96-well extraction of high quality RNA from Arabidopsis. Plant Methods 7: 7. [DOI] [PMC free article] [PubMed] [Google Scholar]
- Castaings L, Bergonzi S, Albani MC, Kemi U, Savolainen O, Coupland G. 2014. Evolutionary conservation of cold-induced antisense RNAs of FLOWERING LOCUS C in Arabidopsis thaliana perennial relatives. Nat Commun 5: 4457. [DOI] [PMC free article] [PubMed] [Google Scholar]
- Coustham V, Li P, Strange A, Lister C, Song J, Dean C. 2012. Quantitative modulation of polycomb silencing underlies natural variation in vernalization. Science 337: 584–587. [DOI] [PubMed] [Google Scholar]
- Csorba T, Questa JI, Sun Q, Dean C. 2014. Antisense COOLAIR mediates the coordinated switching of chromatin states at FLC during vernalization. Proc Natl Acad Sci 111: 16160–16165. [DOI] [PMC free article] [PubMed] [Google Scholar]
- Dittmar EL, Oakley CG, Agren J, Schemske DW. 2014. Flowering time QTL in natural populations of Arabidopsis thaliana and implications for their adaptive value. Mol Ecol 23: 4291–4303. [DOI] [PubMed] [Google Scholar]
- Geraldo N, Baurle I, Kidou SI, Hu X, Dean C. 2009. FRIGIDA delays flowering in Arabidopsis via a co-transcriptional mechanism involving direct interaction with the nuclear cap binding complex. Plant Physiol 150: 1611–1618. [DOI] [PMC free article] [PubMed] [Google Scholar]
- Haimovich G, Medina DA, Causse SZ, Garber M, Millan-Zambrano G, Barkai O, Chavez S, Perez-Ortin JE, Darzacq X, Choder M. 2013. Gene expression is circular: factors for mRNA degradation also foster mRNA synthesis. Cell 153: 1000–1011. [DOI] [PubMed] [Google Scholar]
- Hall TA. 1999. BioEdit: a user-friendly biological sequence alignment editor and analysis program for Windows 95/98/NT. Nucleic Acids Symp Ser 41: 95–98. [Google Scholar]
- Halligan DL, Kousathanas A, Ness RW, Harr B, Eory L, Keane TM, Adams DJ, Keightley PD. 2013. Contributions of protein-coding and regulatory change to adaptive molecular evolution in murid rodents. PLoS Genet 9: e1003995. [DOI] [PMC free article] [PubMed] [Google Scholar]
- Hornyik C, Terzi LC, Simpson GG. 2010. The spen family protein FPA controls alternative cleavage and polyadenylation of RNA. Dev Cell 18: 203–213. [DOI] [PubMed] [Google Scholar]
- Hossain MA, Chung C, Pradhan SK, Johnson TL. 2013. The yeast cap binding complex modulates transcription factor recruitment and establishes proper histone H3K36 trimethylation during active transcription. Mol Cell Biol 33: 785–799. [DOI] [PMC free article] [PubMed] [Google Scholar]
- Johanson U, West J, Lister C, Michaels S, Amasino R, Dean C. 2000. Molecular analysis of FRIGIDA, a major determinant of natural variation in Arabidopsis flowering time. Science 290: 344–347. [DOI] [PubMed] [Google Scholar]
- Lee I, Michaels SD, Masshardt AS, Amasino RM. 1994. The late-flowering phenotype of FRIGIDA and mutations in LUMINIDEPENDENS is suppressed in the Landsberg erecta strain of Arabidopsis. Plant J 6: 903–909. [Google Scholar]
- Li P, Filiault D, Box MS, Kerdaffrec E, van Oosterhout C, Wilczek AM, Schmitt J, McMullan M, Bergelson J, Nordborg M, et al. 2014. Multiple FLC haplotypes defined by independent cis-regulatory variation underpin life history diversity in Arabidopsis thaliana. Genes Dev 28: 1635–1640. [DOI] [PMC free article] [PubMed] [Google Scholar]
- Liu F, Quesada V, Crevillen P, Bäurle I, Swiezewski S, Dean C. 2007. The Arabidopsis RNA-binding protein FCA requires a lysine-specific demethylase 1 homolog to downregulate FLC. Mol Cell 28: 398–407. [DOI] [PubMed] [Google Scholar]
- Liu F, Marquardt S, Swiezewski S, Dean C. 2010. Targeted 3′ processing of antisense transcripts triggers Arabidopsis FLC chromatin silencing. Science 327: 94–97. [DOI] [PubMed] [Google Scholar]
- Marquardt S, Raitskin O, Wu Z, Liu F, Sun Q, Dean C. 2014. Functional consequences of splicing of the antisense transcript COOLAIR on FLC transcription. Mol Cell 54: 156–165. [DOI] [PMC free article] [PubMed] [Google Scholar]
- Ramaiah M, Shum EY, Wilkinson MF. 2012. How to activate a gene: decap its associated noncoding RNA. Mol Cell 45: 271–273. [DOI] [PMC free article] [PubMed] [Google Scholar]
- Ripatti S, Becker T, Bickeboller H, Dominicus A, Fischer C, Humphreys K, Jonasdottir G, Moreau Y, Olsson M, Ploner A, et al. 2009. GENESTAT: an information portal for design and analysis of genetic association studies. Eur J Hum Genet 17: 533–536. [DOI] [PMC free article] [PubMed] [Google Scholar]
- Shindo C, Lister C, Crevillen P, Nordborg M, Dean C. 2006. Variation in the epigenetic silencing of FLC contributes to natural variation in Arabidopsis vernalization response. Genes Dev 20: 3079–3083. [DOI] [PMC free article] [PubMed] [Google Scholar]
- Swiezewski S, Liu F, Magusin A, Dean C. 2009. Cold-induced silencing by long antisense transcripts of an Arabidopsis Polycomb target. Nature 462: 799–802. [DOI] [PubMed] [Google Scholar]
- Wang ZW, Wu Z, Raitskin O, Sun Q, Dean C. 2014. Antisense-mediated FLC transcriptional repression requires the P-TEFb transcription elongation factor. Proc Natl Acad Sci 111: 7468–7473. [DOI] [PMC free article] [PubMed] [Google Scholar]
- Yang H, Howard M, Dean C. 2014. Antagonistic roles for H3K36me3 and H3K27me3 in the cold-induced epigenetic switch at Arabidopsis FLC. Curr Biol 24: 1793–1797. [DOI] [PMC free article] [PubMed] [Google Scholar]
Associated Data
This section collects any data citations, data availability statements, or supplementary materials included in this article.