

Pu et al. profiled the genome-wide pattern of trimethylation of Lys36 on histone 3 (H3K36me3) in the somatic cells of young and old C. elegans. Genes with dramatic expression change during aging are marked with low or undetectable levels of H3K36me3 in their gene bodies. A similar negative correlation between H3K36me3 marking and mRNA expression change during aging is also observed in Drosophila melanogaster. Inactivation of the methyltransferase met-1 resulted in a decrease in global H3K36me3 marks, an increase in mRNA expression change with age, and a shortened life span.
Keywords: aging, epigenetics, gene expression, H3K36me3, met-1
Abstract
Functional data indicate that specific histone modification enzymes can be key to longevity in Caenorhabditis elegans, but the molecular basis of how chromatin structure modulates longevity is not well understood. In this study, we profiled the genome-wide pattern of trimethylation of Lys36 on histone 3 (H3K36me3) in the somatic cells of young and old Caenorhabditis elegans. We revealed a new role of H3K36me3 in maintaining gene expression stability through aging with important consequences on longevity. We found that genes with dramatic expression change during aging are marked with low or even undetectable levels of H3K36me3 in their gene bodies irrespective of their corresponding mRNA abundance. Interestingly, 3′ untranslated region (UTR) length strongly correlates with H3K36me3 levels and age-dependent mRNA expression stability. A similar negative correlation between H3K36me3 marking and mRNA expression change during aging was also observed in Drosophila melanogaster, suggesting a conserved mechanism for H3K36me3 in suppressing age-dependent mRNA expression change. Importantly, inactivation of the methyltransferase met-1 resulted in a decrease in global H3K36me3 marks, an increase in mRNA expression change with age, and a shortened life span, suggesting a causative role of the H3K36me3 marking in modulating age-dependent gene expression stability and longevity.
Extensive studies in model organisms and human tissues have identified many genes that show age-dependent expression changes (Lee et al. 1999; Zou et al. 2000; Kayo et al. 2001; Pletcher et al. 2002; McCarroll et al. 2004; Zahn et al. 2006; Golden and Melov 2007; Budovskaya et al. 2008; Hong et al. 2008; de Magalhaes et al. 2009; Glass et al. 2013). These age-regulated genes generally participate in a wide variety of biological processes that are associated with age-dependent physiological changes. In mice, most age-regulated gene expression alterations can be either completely or partially delayed by caloric restriction, a well-known intervention that retards aging (Lee et al. 1999, 2000), suggesting that gene expression regulation plays an important and causal role in the aging process.
Epigenetic mechanisms are key to gene expression regulation and other processes of DNA transaction (Kouzarides 2007). Previous studies have clearly demonstrated that changes in DNA methylation, histone modifications, and small RNAs, which are important components of epigenetic regulation, occur during aging in different species (Feser and Tyler 2011; Jung and Suh 2012; Smith-Vikos and Slack 2012; Winnefeld and Lyko 2012; Hannum et al. 2013; Horvath 2013; Wood and Helfand 2013). Emerging evidence in model organisms has bolstered a causative role for epigenetic regulation in longevity determination (Kim et al. 1999; Hamilton et al. 2005; Curran and Ruvkun 2007; McColl et al. 2008; Dang et al. 2009; Greer et al. 2010, 2011; Siebold et al. 2010; Jin et al. 2011; Maures et al. 2011). Caenorhabditis elegans is a leading model to study the molecular basis of aging and longevity determination. Functional studies in C. elegans have identified several chromatin modifiers and histone modification enzymes that promote longevity when attenuated (Hamilton et al. 2005; Curran and Ruvkun 2007; Greer et al. 2010, 2011; Jin et al. 2011; Maures et al. 2011). These studies strongly support the importance of a better understanding of the genome-wide chromatin landscape during aging to gain further insights into possible epigenetic mechanisms of life span modulation.
In this study, we set out to explore the global profile of trimethylation of Lys36 on histone H3 (H3K36me3) in the somatic cells of young and old C. elegans. H3K36me3 is a histone modification mark enriched on the gene body region and associated with active gene transcription (Shilatifard 2006). H3K36me3 can be deposited by elongating RNA polymerase II (Pol II) (Hampsey and Reinberg 2003) and is important for regulating Pol II elongation and preventing cryptic transcription (Carrozza et al. 2005; Venkatesh et al. 2012; Wen et al. 2014). H3K36me3 has also been implicated in RNA splicing (Kolasinska-Zwierz et al. 2009; de Almeida et al. 2011; Kim et al. 2011; Pradeepa et al. 2012) and DNA mismatch repair (Li et al. 2013). Not surprisingly, based on the broad roles of H3K36me3, defects in the enzymes required to maintain H3K36 methylation have been shown to cause developmental defects and disease (Wagner and Carpenter 2012; Fontebasso et al. 2013). We found that genome-wide distribution of H3K36me3 is largely stably maintained during aging in C. elegans. Interestingly, our data revealed that the H3K36me3 mark is inversely correlated to mRNA expression change during aging. Genes with dramatic expression difference during aging are marked with low or even undetectable levels of H3K36me3 in their gene bodies irrespective of their corresponding mRNA abundance. A similar correlation was also observed in Drosophila melanogaster, suggesting a conserved mechanism for H3K36me3 in suppressing age-dependent mRNA expression alteration. We further identified that the length of the 3′ untranslated region (UTR) strongly correlates with H3K36me3 levels and age-dependent mRNA expression stability, suggesting a novel link between mRNA 3′ end processing and/or microRNA (miRNA) regulation with H3K36me3 modification. Importantly, we demonstrated that the reduction of global H3K36me3 levels through inactivation of the methyltransferase met-1 caused an increase in mRNA expression change with age and a shortened life span. Our findings therefore uncover a new role for H3K36me3 in restraining gene expression alteration during aging, with important consequences on longevity.
Results
H3K36me3 distribution is stably maintained during aging in C. elegans somatic cells
To monitor H3K36me3 patterns in the somatic tissues of C. elegans at different ages, we performed chromatin immunoprecipitation (ChIP) coupled with deep sequencing (ChIP-seq) using whole worm extracts from young and old worms lacking germlines. We used germlineless worms to avoid the complication that dramatic changes of histone modifications that occur in germ cells through adulthood would mask changes in aging somatic tissues. The glp-1(e2141) mutant that we used produces very few germ cells (Priess et al. 1987) and is slightly longer lived than the wild type (∼10% life span extension) when grown at the restrictive temperature 25°C (data not shown). Despite the slight life span difference, we believe that relevant age-dependent histone modification patterns can be derived. We examined four independent biological replicates at three time points: day 2 (D2) and D4 adults as the young stage points and D12 adults as the old stage point. Two young time points were chosen because previous studies indicated a dramatic change in proteostasis ability at around D2 (Labbadia and Morimoto 2014), and reproduction generally ends prior to D4 in wild-type worms.
Consistent with previous findings, H3K36me3 was mainly deposited on the gene body region with higher enrichment at the 3′ end (Supplemental Fig. S1A; Pokholok et al. 2005; Barski et al. 2007; Mikkelsen et al. 2007; Edmunds et al. 2008; Wagner and Carpenter 2012) and was slightly more enriched at exons compared with introns (Supplemental Fig. S1B; Kolasinska-Zwierz et al. 2009). To evaluate whether aging is associated with genome-wide dynamic changes in the H3K36me3 pattern, we computed the pair-wise Pearson correlation of the histone H3-normalized H3K36me3 data at the three time points for the four biological replicates. The correlation coefficients between all data sets were >0.80, indicating the absence of a dramatic genome-wide H3K36me3 pattern change during aging (Fig. 1A).
Figure 1.
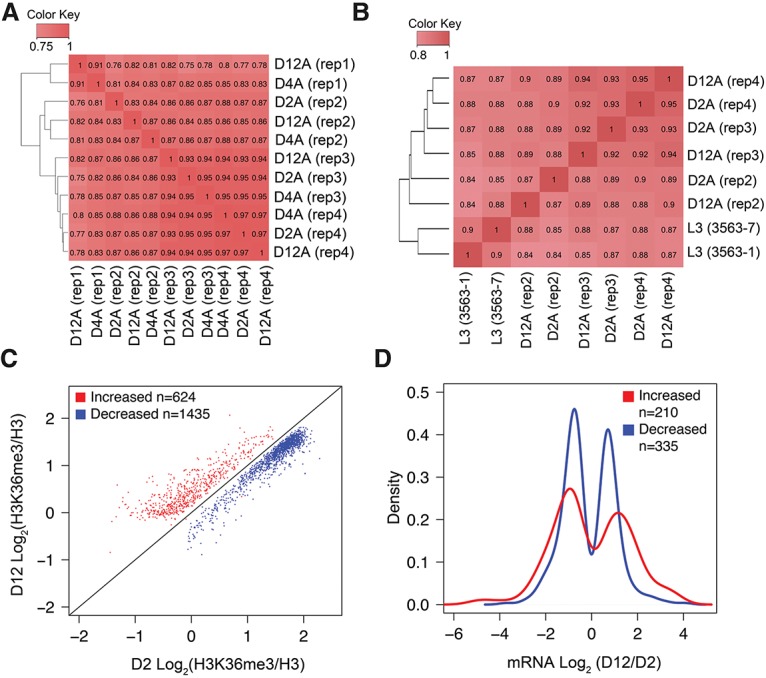
H3K36me3 distribution in C. elegans somatic cells is largely stably maintained at different ages. (A) Genome-wide occupancy of H3K36me3 is highly correlated in worms at different ages. Pair-wise Pearson correlations of genome-wide H3K36me3 levels were calculated at windows of 1000 base pairs (bp) for smoothed tag enrichment profiles (see the Materials and Methods for more details). (B) Gene body occupancy of H3K36me3 in protein-coding genes is highly correlated in worms at different ages. Spearman's correlation was computed using log2 values of normalized H3K36me3 on gene bodies of all mapped protein-coding genes. L3 (3563-1 and 3563-7) represents H3K36me3 ChIP-seq data from modENCODE (modENCODE ID 3563). (C) Scatter plot of H3K36me3 levels for the genes that show a statistically significant age-dependent increase (red) or decrease (blue) based on generalized linear mixed model (GLMM) analysis (false discovery rate [FDR] <0.01) (see the Materials and Methods for more details). Data plotted are average normalized H3K36me3 values for gene bodies of protein-coding genes from three biological replicates calculated using Homer. (D) Summary of age-dependent changes in mRNA abundance for the gene sets identified by GLMM analysis with an age-dependent increase (red) or decrease (blue) in H3K36me3 levels. The X-axis shows log2 values of the mRNA abundance fold change at D12 over D2 (fold change was computed using CuffDiff based on FPKM [fragments per kilobase per million mapped fragments] values from two biological replicates). The Y-axis shows the proportion of genes with the corresponding log2 fold change in mRNA abundance. The plots show the subset of the GLMM genes (shown in C) that exhibited statistically significant changes in mRNA abundance with age (Q-value < 0.05). The dip around 0 in the plots reflects the absence of transcripts with no significant mRNA expression change with age. Gene body H3K36me3 levels and RNA sequencing (RNA-seq) data at D2 and D12 are listed in Supplemental Tables S2 and S3, respectively.
Since H3K36me3 largely marks the gene body, we further analyzed the H3K36me3 levels on the gene bodies (transcription start site to transcription termination site according to the ce6 annotation of the C. elegans genome) of all protein-coding genes. Our analysis revealed a bimodal distribution of the H3K36me3 marks on protein-coding genes in C. elegans (Supplemental Fig. S1C; Supplemental Table S2), where gene populations exhibited either high or low levels of normalized H3K36me3 (gene density peaks at normalized H3K36me3 log2 value of 1.6 and −1.5, respectively). Spearman's correlation test similarly indicated that H3K36me3 markings on the gene body of protein-coding genes were largely similar during aging, with all pair-wise Spearman's correlation coefficients >0.87 (Fig. 1B). In this analysis, we also included the H3K36me3 profiling data from L3 stage larvae (modENCODE ID 3563). The results showed that the genome-wide H3K36me3 pattern at the L3 stage was very similar to those in adult and aged worms (Spearman's correlation coefficient >0.84), suggesting that the H3K36me3 pattern is largely established during development. Nevertheless, our analyses revealed that the highly methylated genes had slightly reduced methylation levels with age, whereas the lowly methylated genes had slightly increased levels (Supplemental Fig. S1C).
Despite the generally stable maintenance of the H3K36me3 pattern through aging, we sought to identify genes with consistent changes in H3K36me3 marks with aging. We developed a new ChIP-seq data analysis pipeline based on the statistical framework of the generalized linear mixed model (GLMM) (see the Materials and Methods for further details) to identify genes and transcripts that show statistically significant changes in H3K36me3 levels between the D2 and D12 adult time points. The GLMM analysis identified 872 transcripts (corresponding to 624 genes) that gained H3K36me3 with age (here termed “K36 up with age”) and 1930 transcripts (corresponding to 1435 genes) that lost H3K36me3 with age (“K36 down with age”; false discovery rate [FDR] <0.01) (Supplemental Table S4). Consistent with our earlier observation (Supplemental Fig. S1C), the group of genes that gained H3K36me3 with age were marked by relatively low levels of H3K36me3 at the young time point (median log2-normalized H3K36me3 level of −0.09), whereas the group of genes that showed age-dependent decreased H3K36me3 were marked by relatively high levels of H3K36me3 at the young time point (median log2-normalized H3K36me3 level of 1.62) (Fig. 1C). Among the transcripts identified by GLMM that exhibited consistent age-dependent changes in H3K36me3 marking, 220 transcripts (corresponding to 196 genes) changed by >0.5-fold (i.e., 50% higher) in the “K36 up with age” group, whereas only five transcripts (corresponding to five genes) changed by >0.5-fold in the “K36 down with age” group. Therefore, the age-dependent change in H3K36me3 was generally modest. Interestingly, as discussed further below, the stable pattern of H3K36me3 nevertheless has an important impact on gene expression regulation through aging.
No simple positive correlation between H3K36me3 marks on gene bodies and high mRNA expression abundance for actively expressed genes
To compare H3K36me3 marks with mRNA expression during aging, we performed mRNA sequencing (mRNA-seq) at the identical aging time points using worms prepared in parallel to those for ChIP-seq analysis. Among the 12,447 transcripts that were detectably expressed (FPKM [fragments per kilobase per million mapped fragments] >0.5) at both the D2 and D12 time points, the CuffDiff analysis pipeline (Trapnell et al. 2012) identified 3277 transcripts (corresponding to 3218 protein-coding genes) that showed a significant change in mRNA levels through aging (Q-value < 0.01) (Supplemental Table S3).
Comparing H3K36me3 ChIP-seq and mRNA-seq results revealed an absence of H3K36me3 on undetectably and weakly expressed genes (log10 FPKM <0) (Supplemental Fig. S1E), consistent with previous findings that H3K36me3 marks actively transcribed genes (Shilatifard 2006; Kouzarides 2007). For genes that are actively expressed at moderate levels (log10 FPKM between 0 and 1), their mRNA levels positively correlated with their gene body H3K36me3 marking (Spearman's correlation, ρ = 0.17, 0.13, and 0.14; P-value < 0.001) (Supplemental Fig. S1E). However, for the highly expressed genes (log10 FPKM between 1 and 1.5), their mRNA abundance and gene body H3K36me3 levels did not exhibit a significant correlation (Spearman's correlation, ρ = 0.02; P-value > 0.1) (Supplemental Fig. S1E). Interestingly, for the most highly abundant genes (log10 FPKM >1.5), their mRNA levels actually negatively correlated with their H3K36me3 marking (Spearman's correlation, ρ = −0.12; P-value < 0.001) (Supplemental Fig. S1E). Therefore, while H3K36me3 marks are commonly associated with active gene transcription, H3K36me3 levels do not necessarily correlate with mRNA levels (Supplemental Fig. S1F).
We further examined whether the subset of genes that showed age-dependent changes in H3K36me3 markings according to the GLMM analysis would exhibit corresponding changes in mRNA expression levels. In the “K36 up with age” and “K36 down with age” groups, 606 and 1388 transcripts, respectively, were detected in our mRNA-seq analysis. Among them, 210 and 355 transcripts, respectively, exhibited significantly altered mRNA abundance during aging (Q-value < 0.05) (Supplemental Table S4). In general, there appears to be no strict correlation between changes in H3K36me3 levels and corresponding changes in mRNA abundance, as both the “K36 up with age” and “K36 down with age” groups contain a similar proportion of transcripts that exhibited increased, unchanged, or decreased mRNA expression (Fig. 1D). For the “K36 up with age” group of transcripts, the Spearman's correlation test identified a positive correlation between a change in H3K36me3 marks and a change in mRNA expression between D2 and D12 adults (ρ = 0.40; P-value < 0.0001), which are mainly contributed by 76 transcripts in this group with low to median expression levels (FPKM <10). Spearman's correlation test illustrated that changes in H3K36me3 methylation actually negatively correlated with a mRNA abundance change for the “K36 down with age” group (ρ = −0.16; P-value = 0.002).
H3K36me3 marking on gene bodies negatively correlates with changes in gene expression during aging
We next analyzed whether and how H3K36me3 marks might relate to mRNA expression change with age. We ranked all of the protein-coding transcripts according to their gene body H3K36me3 levels at the young D2 time point and plotted the corresponding log2 values of age-dependent mRNA abundance changes (i.e., log2 of D12 FPKM/D2 FPKM). We observed a striking inverse correlation between H3K36me3 marks and mRNA expression change (Fig. 2A), where transcripts marked by lower levels of H3K36me3 tended to yield greater changes in mRNA levels with age. A similar pattern was also observed when transcripts were ranked according to their gene body H3K36me3 levels at D12 (Supplemental Fig. S2B). As a different way of representing this trend, genes that showed statistically significant age-dependent mRNA expression changes (Q-value < 0.05 or Q-value < 0.01) were preferentially marked by lower levels of H3K36me3 (Supplemental Fig. S2C).
Figure 2.
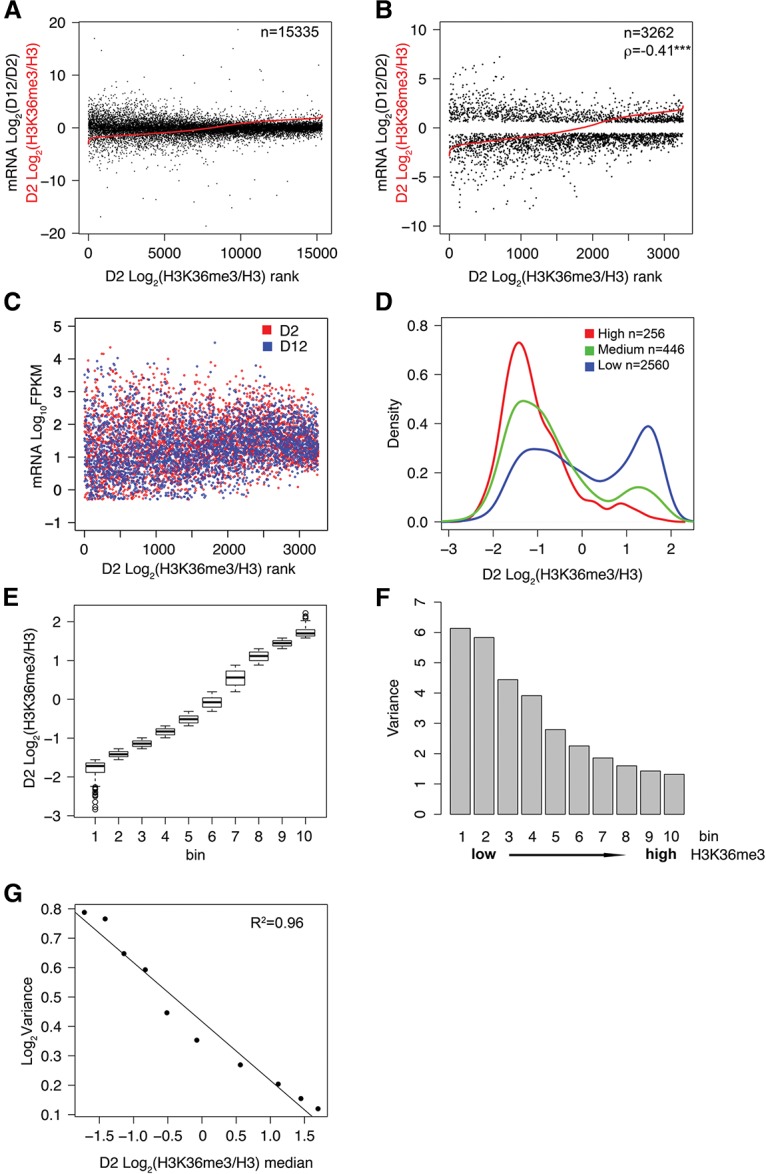
Gene body H3K36me3 level is inversely correlated with gene expression change during aging. (A) All protein-coding transcripts with mappable H3K36me3 ChIP-seq and RNA-seq reads are plotted in the order of normalized H3K36me3 levels at the D2 time point from low (left) to high (right) (shown in red). The corresponding log2 values of age-dependent fold change in mRNA abundance are plotted in black. Average normalized H3K36me3 values were calculated from three biological replicates using Homer. (B) A plot similar to that in A, except only transcripts that were detectably expressed (FPKM >0.5 at D2 and D12) and showed statistically significant age-dependent mRNA abundance change (Q-value < 0.01 from CuffDiff analysis) are plotted. The normalized H3K36me3 value is plotted in red, and the corresponding log2 values of age-dependent fold change in mRNA abundance are plotted in black. (ρ) Spearman's correlation coefficient between absolute values of log2 fold change in mRNA abundance and log2 values of normalized H3K36me3. (***) P-value < 0.001. (C) mRNA levels of transcripts with significant age-dependent change (FPKM >0.5; Q-value < 0.01) are plotted according to the rank of H3K36me3 levels at D2. mRNA levels at D2 and D12 are plotted in red and in blue, respectively. (D) Transcripts plotted in B are divided into three subgroups according to the absolute values of their age-dependent log2 fold change (FC) in mRNA abundance: high, |Log2 FC| > 3; medium, 2 < |Log2 FC| < 3; and low, |Log2 FC| < 2. The X-axis shows the normalized H3K36me3 levels at D2. The Y-axis shows the proportion of transcripts with the corresponding H3K36me3 level for the indicated subgroup. (E) Transcripts plotted in B were divided into 10 bins of equal numbers of transcripts (except bin 10, which had two extra transcripts) according to their normalized H3K36me3 levels from low to high. Box plot showing normalized H3K36me3 levels of genes in each bin. (F) Variance of the age-dependent mRNA abundance change for each bin is shown. Variance represents the spread from the mean of the log2 values of age-dependent fold change in mRNA abundance for the transcripts in each bin: . (G) Regression plot showing variance in mRNA abundance from F as a function of median H3K36me3 levels from E. Gene body H3K36me3 levels and RNA-seq data at D2 and D12 are listed in Supplemental Tables S2 and S3, respectively.
To more rigorously examine this inverse correlation, we focused our analysis on the subset of transcripts that were detectably expressed (FPKM >0.5 at both young and old time points) and that showed statistically significant changes in mRNA abundance with age (Q-value < 0.01). Spearman's correlation test showed that for this group of transcripts (3262 transcripts), the absolute log2 values of their age-dependent mRNA expression changes and their gene body H3K36me3 levels were strongly negatively correlated (Spearman's correlation, ρ = −0.43, P-value < 0.001 when D2 H3K36me3 levels were used; ρ = −0.41, P-value < 0.001 when D12 H3K36me3 levels were used) (Fig. 2B; Supplemental Fig. S2D). The absolute log2 value of the fold change in mRNA abundance was used for the Spearman's correlation test because the focus was to correlate H3K36me3 marks with the degree of change in mRNA levels and not the direction of the change. Consistent with this strong inverse correlation, transcripts that changed more dramatically during aging were preferentially marked with lower levels of H3K36me3 (Fig. 2D).
In order to further quantify the correlation between gene body H3K36me3 levels and mRNA expression change, we divided this transcript group (FPKM >0.5 at D2 and D12; Q-value < 0.01) into 10 bins with an equal number of transcripts (326 transcripts per bin) and computed the median normalized H3K36me3 level (Fig. 2E) and the variance of age-dependent mRNA abundance change (variance refers to the statistical term estimating the spread from the mean of age-dependent fold change in mRNA abundance) (Fig. 2F) for each bin. Linear regression analysis showed that the variance in mRNA abundance change and the median gene body H3K36me3 levels across the 10 bins is strongly negatively correlated with the coefficient of determination R2 = 0.96 (Fig. 2G). In addition to protein-coding transcripts, we also observed a similar negative correlation between age-dependent changes in mRNA expression and gene body H3K36me3 levels in long noncoding RNA (lncRNA) genes (Spearman correlation, ρ = −0.24; P-value = 0.029) (Supplemental Fig. S2F; Supplemental Tables S2, S3).
H3K36me3 marking negatively correlates with gene expression change during aging irrespective of gene length or the abundance and tissue pattern of gene expression
The negative correlation between age-dependent mRNA expression change and gene body H3K36me3 marking did not appear to correlate with mRNA abundance, as genes marked with low to moderate levels of H3K36me3 can have expression levels ranging from very low to very high, although genes marked with high levels of H3K36me3 tend not to exhibit expression abundance at the extreme levels (Fig. 2C; Supplemental Fig. S2A). To rule out the possibility that lowly expressed genes, which tend to be marked by no or very low levels of H3K36me3, are difficult to quantify using RNA-seq and thus artificially show greater mRNA expression change with age, we further divided the 3262 transcripts (FPKM >0.5; Q-value < 0.01) into three subgroups of equal numbers of transcripts based on their mRNA abundance (low, medium, and high) (Supplemental Fig. S3A). Spearman's correlation test demonstrated that for each of the subgroups, age-dependent changes in mRNA expression and H3K36me3 marks still exhibited a statistically significant negative correlation (ρ = −0.50, −0.37, and −0.30 for low, medium, and high mRNA abundance groups, respectively; P-value < 0.001) (Fig. 3A). For each subgroup, we performed the same binning and computation of gene expression variance and median H3K36me3 levels as discussed above (Fig. 3B). Linear regression analysis indicated that the negative correlation between H3K36me3 marks and age-dependent mRNA expression variation persisted in all three subgroups (R2 = 0.95, 0.84, and 0.96 for low, medium, high, respectively) (Fig. 3C). Taken together, these results indicate that for actively expressed protein-coding genes, their mRNA expression change through aging is inversely correlated with their gene body H3K36me3 marking regardless of their mRNA expression levels.
Figure 3.
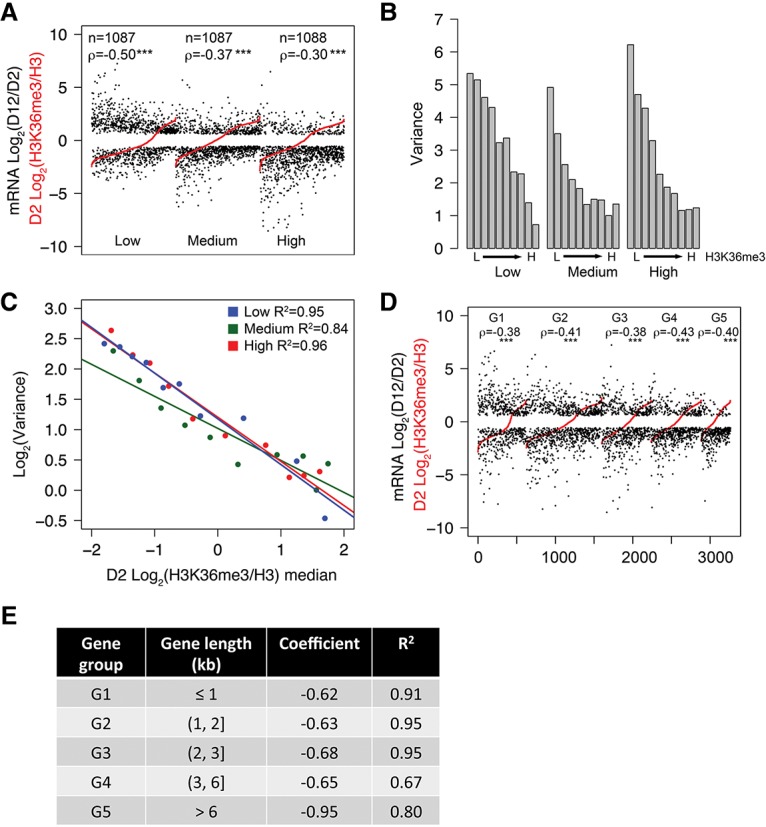
The negative correlation between H3K36me3 levels and gene expression change is independent of mRNA abundance, gene length, or tissue expression pattern. (A) Transcripts plotted in Figure 2B were divided into three subgroups according to mRNA abundance (low, medium, and high). Transcripts in each subgroup were plotted in the order of normalized H3K36me3 levels at the D2 time point from low (left) to high (right) (shown in red). The corresponding log2 values of age-dependent fold change in mRNA abundance were plotted in black. (ρ) Spearman's correlation coefficient between absolute log2 values of fold change in mRNA abundance and log2 values of normalized H3K36me3. (***) P-value < 0.001. (B) Transcripts in each subgroup shown in A (low, medium, and high) were divided into 10 bins of equal numbers of transcripts (except bin 10, which had seven or eight extra transcripts) according to their normalized H3K36me3 levels (data not shown) from low (L) to high (H). Variance of age-dependent mRNA abundance change for each bin is shown. (C) Regression plot showing variance in mRNA abundance from B as a function of median H3K36me3 levels for each bin. (D,E) The negative correlation between H3K36me3 levels and mRNA expression change is independent of gene length. Transcripts plotted in Figure 2B were divided into five subgroups (G1–G5) according to gene length as indicated in E. Transcripts in each subgroup were ranked in the order of normalized H3K36me3 levels at the D2 time point from low (left) to high (right) (shown in red in D). The corresponding log2 values of age-dependent fold change in mRNA abundance ae plotted in black in D. Each subgroup was then binned, and subsequent calculation were computed as described for A. (ρ) Spearman's coefficient between absolute values of log2 fold change in mRNA abundance and log2 values of normalized H3K36me3. The linear regression coefficient and R2 between H3K36me3 level and variance in mRNA abundance for each subgroup are shown in E. (***) P-value < 0.001.
H3K36me3 levels were previously demonstrated to be affected by both gene length and transcription frequency in yeast (Pokholok et al. 2005; Li et al. 2007). We further tested whether the negative correlation between H3K36me3 level and mRNA expression change was influenced by gene length. First, we observed a weak positive correlation between gene length (gene length is defined as transcription start site to transcription termination site according to the ce6 annotation of the C. elegans genome) and gene body H3K36me3 levels by Spearman's correlation test (ρ = 0.18; P-value < 0.001), suggesting that H3K36me3 deposition is somewhat biased by gene length. Next, we performed analyses similar to those described above and divided the 3262 transcripts into five subgroups of transcripts according to their gene length. Spearman's correlation test revealed a negative correlation between gene body H3K36me3 levels and age-dependent mRNA expression changes in all subgroups (P-value < 0.001) (Fig. 3D). Linear regression analysis demonstrated strong correlations in the shorter gene subgroups (R2 = 0.91, 0.95, and 0.95) and slightly weaker correlations in the longer gene subgroups (R2 = 0.67, 0.80) (Fig. 3E). We concluded that the inverse correlation between gene body H3K36me3 levels and age-dependent mRNA expression change is largely independent of gene length.
Since H3K36me3 is commonly associated with active gene transcription, genes that are expressed in specific tissues likely harbor tissue-specific methylation on H3K36, and ∼75% of C. elegans transcripts are estimated to be differentially expressed among developmental stages and across cell types (Spencer et al. 2011). As our ChIP-seq and mRNA-seq data were generated from whole worm extracts, this could lead to a false overall low H3K36me3 marking on tissue-specific genes. In an attempt to exclude this possibility, we investigated the correlation between H3K36me3 gene body marks and age-dependent changes in mRNA abundance using gene sets that are either ubiquitously expressed or expressed in specific tissues (Spencer et al. 2011). We observed statistically significant negative correlations between age-dependent mRNA abundance changes and gene body H3K36me3 markings for genes that are ubiquitously expressed or specifically expressed in hypodermis, intestine, and body wall muscle (Spearman's coefficient −0.52, −0.36, −0.45, and −0.26, respectively; P-value < 0.001) (Supplemental Fig. S3B–E). The neuron-specific genes did not yield a statistically significant negative correlation (Supplemental Fig. S3F); however, this group contained only 80 transcripts, which might not yield sufficient data for a robust analysis. Overall, our data suggest that H3K36me3 marks negatively correlate with mRNA expression change with age irrespective of the gene's tissue pattern of expression.
3′ UTR length is correlated with gene body H3K36me3 levels and mRNA expression change during aging
In addition to gene length discussed above, we examined whether any other gene structure features would correlate with H3K36me3 marking in C. elegans protein-coding genes. We surveyed protein-coding region (coding sequence [CDS]) length, 5′ UTR length, and 3′ UTR length. We found that 3′ UTR length strongly correlated with gene body H3K36me3 levels (transcription start site to transcriptional termination site according to ce6 annotation) (Fig. 4A) as well as on protein-coding regions (CDS) (ρ = 0.36 and 0.41, respectively; P-value < 2.2 × 10⁻¹⁶). It is interesting to note that 3′ UTR length is positively correlated with gene length (Spearman's correlation coefficient ρ = 0.32; P-value < 0.001), and, as discussed previously, gene length is also positively correlated with H3K36me3 level but with a weaker correlation (ρ = 0.18) compared with that between 3′ UTR length and H3K36me3 level (ρ = 0.36). We further tested whether mRNA abundance change during aging correlated with 3′ UTR length. As expected based on the correlation of 3′ UTR length with H3K36me3 marking, 3′ UTR length also negatively correlated with age-dependent mRNA expression changes during aging (Spearman's correlation, ρ = −0.24; P-value <2.2 × 10⁻¹⁶) (Fig. 4B,C). For the analyses here, the longest 3′ UTR length was used when genes are annotated with more than one 3′ UTR (Mangone et al. 2010). We detected a similar correlation for the subset of genes with a single 3′ UTR (ρ = −0.26; P-value <2.2 × 10⁻¹⁶), which indicates that 3′ UTR length but not 3′ UTR type determines the correlation.
Figure 4.
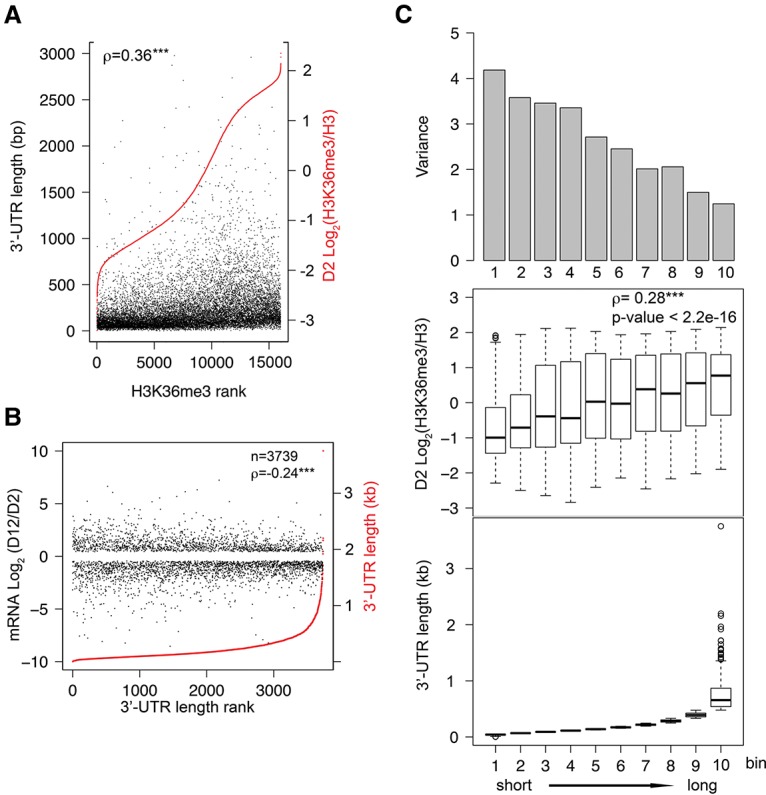
3′ UTR length is correlated with gene body H3K36me3 levels and gene expression change during aging. (A) All protein-coding genes with mappable H3K36me3 ChIP-seq and 3′ UTR annotation are plotted in the order of normalized H3K36me3 levels at the D2 time point from low (left) to high (right) (shown in red). The corresponding gene 3′ UTR lengths are plotted in black. For genes with more than one annotated 3′ UTR, the longest 3′ UTR length was used for the analysis. (ρ) Spearman's correlation coefficient. (***) P-value < 0.001. (B) Genes that were detectably expressed (FPKM >0.5 at D2 and D12) and showed statistically significant age-dependent mRNA abundance change (Q-value < 0.05 from CuffDiff analysis) are plotted in the order of their 3′ UTR length (red) from short (left) to long (right). The corresponding log2 values of age-dependent fold change in mRNA abundance are plotted in black. (ρ) Spearman's correlation coefficient between absolute value of log2 fold change in mRNA abundance and 3′ UTR length. (***) P-value < 0.001. (C) Genes shown in B were divided into 10 bins of similar numbers of genes according to their 3′ UTR length from short (left) to long (right). 3′ UTR length distribution (bottom), H3K36me3 levels (middle), and variance of age-dependent mRNA abundance change (top) of each bin are shown. Spearman's correlation coefficient shows a positive correlation between 3′ UTR length and H3K36me3 level. (***) P-value < 0.001.
The negative correlation between H3K36me3 levels and gene expression change is conserved in wild-type C. elegans and in D. melanogaster
Using publicly available data (GSE21784 and modENCODE ID 3565), we examined the correlation between age-dependent mRNA expression change and gene body H3K36me3 marking in wild-type worms with germlines. A comparison of H3K36me3 levels at the L3 stage with the corresponding mRNA expression change from adult D6 to D15 (Youngman et al. 2011) revealed a similar negative correlation between mRNA expression change and gene body H3K36me3 level (ρ = −0.42; P-value < 0.001) (Supplemental Fig. S2E). Our data suggest that gene body H3K36me3 marking also restricts age-dependent gene expression change in wild-type worms.
To test whether H3K36me3 marks negatively associate with mRNA expression change during aging in different species, we examined H3K36me3 ChIP–chip data and RNA-seq data from young (10 d) and old (40 d) D. melanogaster female heads (Wood et al. 2010). We analyzed the Drosophila data using the same methods described earlier for the C. elegans data and observed a very similar negative correlation between gene body H3K36me3 levels and age-dependent mRNA expression changes (Spearman's correlation test, ρ = −0.50; P-value < 0.001; and linear regression analysis, R2 = 0.92) (Fig. 5A–C). We further parsed the Drosophila data into three subgroups according to mRNA abundance and again observed that the negative correlation between age-dependent mRNA expression change and H3K36me3 level is independent of gene expression abundance (Spearman's correlation coefficient, ρ = −0.33, −0.55, and −0.46; P-value < 0.001) (Fig. 5D). In summary, we propose that H3K36me3 has a conserved role in restraining dramatic changes in mRNA expression through aging in diverse species.
Figure 5.
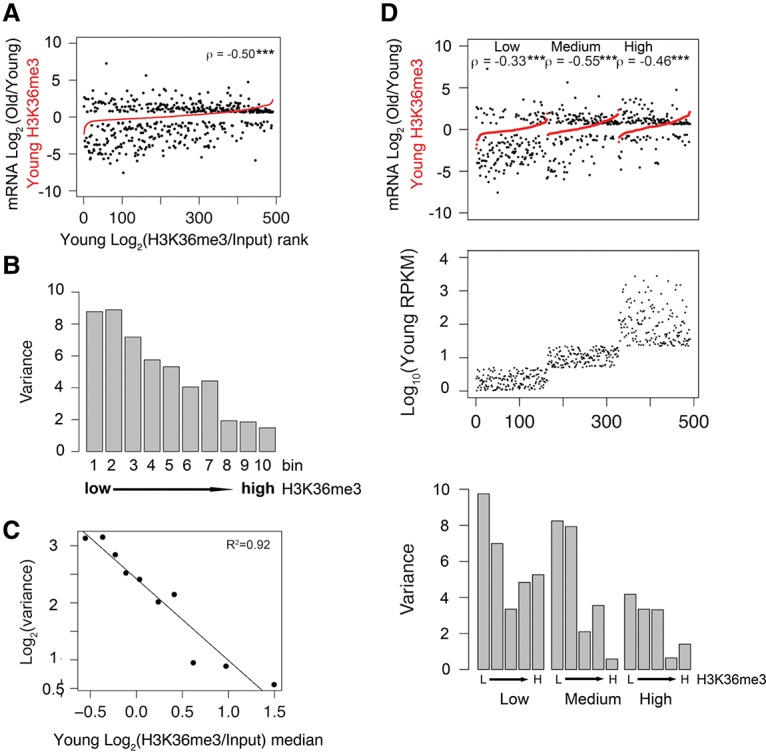
Gene body H3K36me3 level is negatively correlated with age-dependent mRNA expression change in Drosophila heads. (A) All genes with mappable H3K36me3 ChIP–chip and RNA-seq reads are plotted in the order of normalized H3K36me3 levels at the young time point from low (left) to high (right) (shown in red). The corresponding log2 values of age-dependent fold change in mRNA abundance are plotted in black. (ρ) Spearman's correlation coefficient between absolute log2 values of fold change in mRNA abundance and log2 values of normalized H3K36me3. (***) P-value < 0.001. (B) Genes plotted in A were divided into 10 bins of equal number of genes (except bin 10, which had extra transcripts) according to their normalized H3K36me3 levels from low (left) to high (right). Variance of the age-dependent mRNA abundance change for each bin is shown. (C) Regression plot showing log2 of the variance in mRNA abundance change from B as a function of median H3K36me3 level. (D) The negative correlation between H3K36me3 level and gene expression change is independent of mRNA abundance. (Middle panel) Genes plotted in A were divided into three groups (low, medium, and high) according to mRNA abundance. Genes in each subgroup were plotted in the order of normalized H3K36me3 levels at the young time point from low (left) to high (right) (shown in red). (Top panel) The corresponding log2 values of age-dependent fold change in mRNA abundance are plotted in black. Genes in each subgroup (low, medium, and high) were divided into five bins of equal numbers of genes (except bin 5, which had extra genes) according to their normalized H3K36me3 level from low (L) to high (H). (Bottom panel) The variance of age-dependent mRNA abundance change for each bin is shown. (ρ) Spearman's correlation coefficient between absolute log2 values of fold change in mRNA abundance and log2 values of normalized H3K36me3. (***) P-value < 0.001.
Reduction of global H3K36me3 levels increases gene expression change during aging and shortens life span
To distinguish between a simple correlation between H3K36me3 marks and changes in mRNA expression and a causative role for H3K36me3 in restricting mRNA expression change with age, we sought to reduce global H3K36me3 levels in adult worms and monitor the consequent mRNA expression through aging. In C. elegans, the met-1 methyltransferase has been suggested to maintain H3K36me3 in somatic cells, and the mes-4 methyltransferase performs that role in germ cells (Andersen and Horvitz 2007). To investigate the impact of reducing H3K36me3 in somatic cells of C. elegans, we introduced the met-1(n4337) loss-of-function mutation into the glp-1(e2141) strain background or treated glp-1(e2141) worms with met-1 RNAi through development and adulthood. Under our experimental conditions, met-1(n4337); glp-1(e2141) and met-1 RNAi worms developed at rates similar to control worms (data not shown). Immunoblotting confirmed that global H3K36me3 levels were reduced >90% in met-1(n4337); glp-1(e2141) worms and ∼70% in met-1 RNAi worms (Fig. 6A; Supplemental Fig. S4A).
Figure 6.
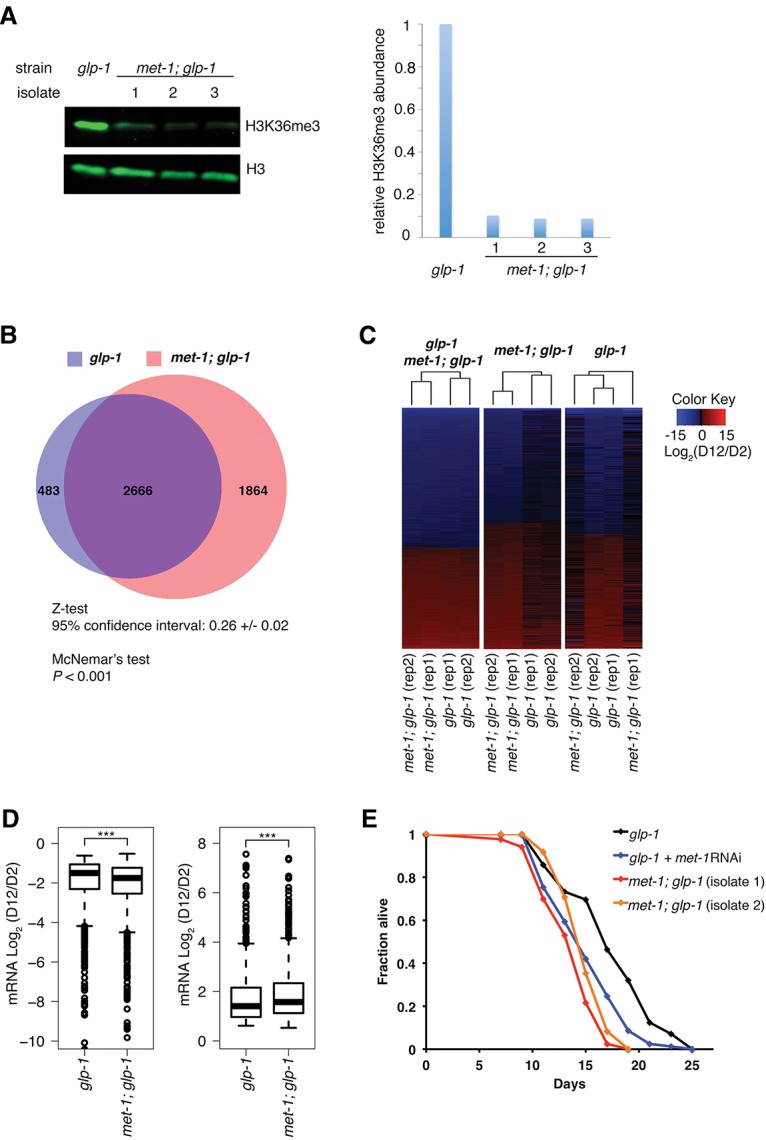
Global reduction in H3K36me3 marking significantly increases gene expression change during aging and shortens life span. (A) H3K36me3 reduction in the met-1 mutant. Western blotting demonstrated a global reduction of H3K36me3 levels in met-1(n4337); glp-1(e2141) worms compared with glp-1(e2141). Quantifications of Western blot results are shown at the right. The Y-axis shows relative levels of H3K36me3 based on quantification of Western signals using a LiCor instrument. (B) Venn diagram representation of transcripts that show significant age-dependent mRNA expression change in control glp-1(e2141) or met-1(n4337); glp-1(e2141). Age-dependent mRNA expression change was computed using CuffDiff (Q-value < 0.05) based on RNA-seq data from two biological replicates. Two different statistical tests indicate that met-1(n4337); glp-1(e2141) worms showed significantly more gene expression change through aging compared with control worms (Z-test: 95% confidence interval: 0.26 ± 0.02; NcNemar's test: 811; P-value < 0.001). RNA-seq data are listed in Supplemental Tables S1 and S5. (C) Genes exhibiting age-dependent mRNA abundance change in glp-1(e2141) and met-1(n4337); glp-1(e2141) worms. Heat maps were generated using log2 values of age-dependent mRNA abundance fold change (D12/D2) in glp-1(e2141) and met-1(n4337); glp-1(e2141) worms from two independent biological experiments. Genes exhibiting significant age-dependent mRNA abundance change in both glp-1(e2141) and met-1(n4337); glp-1(e2141) worms (left), uniquely in met-1(n4337); glp-1(e2141) worms (middle), or uniquely in glp-1(e2141) worms (right) are shown. (D) Box plot comparing mRNA fold change of commonly identified transcripts in glp-1 and met-1; glp-1. The met-1; glp-1 strain showed a more dramatic change of mRNA levels in both the age-dependent decreased transcript group (left) and the age-dependent increased transcript group (right). Boxes represent the 25th, 50th (median), and 75th percentiles; whiskers are the 5th and 95th percentiles. (***) P-value < 2.2 × 10⁻¹⁶ (Wilcoxon signed-rank test). (E) Reduction of global H3K36me3 levels shortened life span. Survival curves of met-1(n4337); glp-1(e2141) and glp-1(e2141) worms fed with control L4440 or met-1 RNAi bacteria are shown. Quantitative data are presented in Supplemental Table S7. met-1 mutation shortened mean life span by ∼14%–22% (isolates 1 and 2) and maximum life span by ∼24%. met-1 RNAi treatment reduced mean life span by ∼13% (P-value < 0.001).
To assess whether reduction of H3K36me3 marks on genes would influence mRNA expression change through aging, we performed mRNA-seq analysis using met-1(n4337); glp-1(e2141) or met-1 RNAi worms and their respective controls at the D2 and D12 time points, similar to the earlier RNA-seq analysis. We examined the age-dependent changes in mRNA expression in met-1 mutant or met-1 knockdown worms compared with controls as described earlier. Our analyses of two biologically independent experiments comparing met-1; glp-1 and glp-1 control worms indicated that transcripts from 3149 genes significantly varied during aging in control glp-1 worms, and transcripts from 4530 genes varied in met-1; glp-1 worms (Fig. 6B; Supplemental Table S5). A cross-comparison revealed that 2666 genes exhibited significant mRNA expression changes through aging in both glp-1 and met-1; glp-1 (Fig. 6B), with the degree of change being significantly greater in met-1; glp-1 compared with glp-1 worms (Fig. 6D); 483 genes showed significant mRNA expression changes only in control glp-1 worms; and 1864 genes showed significant age-dependent changes only in met-1; glp-1 worms (Fig. 6B,C). Statistical analyses support that the met-1; glp-1 mutant worms exhibited a significantly greater age-dependent gene expression change compared with control worms (Z-test: 95% confidence interval: 0.26 ± 0.02; NcNemar's test: P-value < 0.001). A very similar pattern was observed in met-1 RNAi worms (Supplemental Fig. S4B,C; Supplemental Table S6).
Interestingly, the expression of the ∼1800 gene transcripts varied with age significantly only in met-1 mutant worms (∼1100 for RNAi worms), but a similar insignificant trend was observed for these transcripts in control worms (Fig. 6C; Supplemental Fig. S4C). Therefore, the substantial reduction of global H3K36me3 levels (∼90% in mutant worms and ∼70% in RNAi worms) that occurs in animals with attenuated met-1 likely caused these subsets of genes to become more variable with age. Furthermore, the transcripts that showed significant expression change specifically in the met-1 mutant were enriched with highly methylated genes compared with the transcripts that showed significant expression change in both control and met-1 mutant worms (Supplemental Fig. S4D), suggesting that genes with higher levels of H3K36me3 were more affected by met-1 inactivation.
We next investigated the functional consequence of H3K36me3 reduction on life span. We found that both the met-1 loss-of-function mutation and RNAi knockdown significantly shortened the life span of glp-1 worms (∼13%–20% reduction in mean life span) (Fig. 6E; Supplemental Table S7). Similarly, met-1 mutation in wild-type N2 worms also shortened life span (Supplemental Fig. S4E; Supplemental Table S7). We propose that global reduction of H3K36me3 in C. elegans results in greater gene expression change with age, which has detrimental effects on longevity (Fig. 7).
Figure 7.
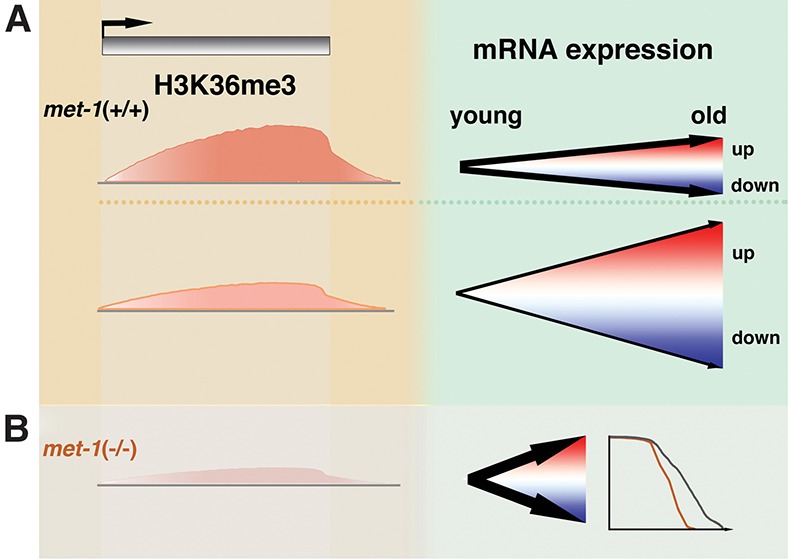
H3K36me3 restricts gene expression change with age and maintains life span. (A) Genes with low H3K36me3 levels have a higher frequency of dramatic gene expression change with age in both increase and decrease directions. Genes with high H3K36me3 levels have relatively stable expression profiles with age. (B) Global loss of H3K36me3 in the met-1 mutant causes increased gene expression change with age and a shortened life span.
Low H3K36me3 marking might provide flexibility in gene regulation
Our discovery that H3K36me3 plays an active role in restraining mRNA expression change through aging led us to ask whether H3K36me3 markings on genes might correlate with physiological changes relevant to aging. We performed gene ontology (GO) analysis of genes that showed a large degree of gene expression changes through aging (absolute log2 value of fold change > 2) and were also marked by low levels of normalized H3K36me3 (log2 < 0) with DAVID (Huang et al. 2009). Interestingly, these genes are enriched for functional groups related to innate immunity, redox balance, and heat-shock response (Supplemental Table S3)—all biological processes thought to be critical for modulating aging. An intriguing possibility is that low levels of H3K36me3 marking enable these genes to be more flexibly regulated over time, and their changed expression through aging contributes to longevity determination.
We further speculated that genes that need to be dynamically regulated under specific conditions would be marked by lower levels of H3K36me3. To test this, we performed GO analysis with all protein-coding genes mapped by our H3K36me3 ChIP-seq data. GO terms with at least 20 genes assigned were extracted for further analysis. Median H3K36me3 levels for the genes in each GO term were computed. Interestingly, we observed obvious differences in median H3K36me3 levels among different GO terms. Some GO terms consisted of genes with largely low or high H3K36me3 levels, whereas other GO terms consisted of genes with a broad range of H3K36me3 levels (Supplemental Fig. S5A; Supplemental Table S8). GO terms with genes that are largely marked with low levels of H3K36me3 are generally involved in signaling responses to environmental stimuli. GO terms involving cellular metabolic processes (such as carbohydrate, fatty acid, and amino acid metabolism) comprise genes with a broad range of H3K36me3 levels. GO terms consisting of genes generally marked by high H3K36me3 levels participate in fundamental biological processes, such as protein translation, RNA processing, RNA splicing, ribosome biogenesis, DNA recombination, and DNA repair (Supplemental Fig. S5A; Supplemental Table S8). This bias distribution of H3K36me3 levels on genes of different biological processes is consistent with our proposed model that lower H3K36me3 marking somehow permits flexible gene expression regulation upon appropriate environmental and physiological conditions. Importantly, this bias distribution of H3K36me3 is not correlated with mRNA abundance, as most of the GO terms have similar median mRNA abundance (Supplemental Fig. S5B).
Discussion
Our study is the first to profile how the genome-wide pattern of H3K36me3 changes with age in C. elegans. We found that global H3K36me3 marks are largely steadily maintained through aging, consistent with previous microarray studies indicating that gene regulation remains largely robust in old worms (Budovskaya et al. 2008). Nevertheless, we identified ∼2000 genes with statistically reproducible changes in H3K36me3 levels with age, albeit usually to a small degree. The genes that accumulated H3K36me3 marks with age generally started with very low levels of H3K36me3 in young animals. The genes that lost H3K36me3 marks with age tended to harbor high levels of H3K36me3 in young animals, suggesting that they are actively expressed in young worms. Consistently, GO analyses indicated that these genes are enriched for functional clusters particularly important for larval development, including growth, development, and sex differentiation (Supplemental Table S4). Curiously, the age-dependent reduction in H3K36me3 markings on these genes was not accompanied by decreased mRNA expression. Further investigations will be necessary to understand the possible biological significance associated with the age-dependent alterations in H3K36me3 marks on this subset of genes.
In general, H3K36me3 marking is associated with active gene transcription, and H3K36me3 is deposited cotranscriptionally. Consistent with this, our data in C. elegans indicate that genes that are silenced (with undetectable RNA-seq reads) lack H3K36me3 marking. However, for genes with detectable mRNA expression, our detailed analysis showed that gene body H3K36me3 marking does not strictly correlate with steady-state mRNA abundance. Specifically, whereas mRNA abundance positively correlates with gene body H3K36me3 levels for the moderately expressed genes, mRNA abundance either does not correlate or even negatively correlates with H3K36me3 levels for the highly expressed genes. This observation with the highly expressed genes differs from that in mammals (Barski et al. 2007). Interestingly, these highly expressed genes tend to be of shorter gene length (average gene length 1.86 kb, median gene length 1.29 kb) and have a shorter 3′ UTR. The gene structure feature of this group of genes might contribute to the anti-correlation between mRNA expression levels and H3K36me3 deposition.
We also observed that gene body H3K36me3 levels correlated with the Pol II 3′ pausing ratio (Spearman's coefficient ρ = 0.24; P-value <2.2 × 10⁻¹⁶) (Kruesi et al. 2013), where greater Pol II pausing at the 3′ end of a gene is associated with higher levels of H3K36me3 at the gene even when H3K36me3 markings at the 3′ UTR are excluded. Interestingly, Pol II 3′ pausing as well as H3K36me3 gene body marking correlate with 3′ UTR length. Considering that H3K36me3 deposition is cotranscriptional and the H3K36me3 methyltransferase is associated with elongating Pol II (Hampsey and Reinberg 2003), we propose that Pol II stalling on genes with a longer 3′ UTR results in greater H3K36me3 deposition on the gene.
Our analysis revealed a new function of H3K36me3 in restricting gene expression changes through aging. We found that in whole worms and Drosophila heads, genes marked by low levels of H3K36me3 were more likely to exhibit a greater degree of mRNA abundance alteration between the young and old time points irrespective of how highly or lowly expressed the genes are. The age-dependent mRNA expression variance shows a strong and highly significant correlation with median gene body H3K36me3 levels (correlation coefficient R2 of ∼0.7–0.9). The correlation that we detected appears specific to age-dependent change in mRNA expression, as the genes that our analyses focused on (exhibiting significant age-dependent mRNA change, Q-value < 0.05) presented highly stable mRNA expression levels between replicates at the same time point. We further demonstrated that H3K36me3 marking actively contributes to the regulation of age-dependent mRNA expression change, as loss-of-function mutation or RNAi depletion of the H3K36me3 methyltransferase met-1 resulted in a reduction in global H3K36me3 in worms and greater mRNA expression change through aging. Although H3K36me3 is well known to be associated with active transcription, its precise role in gene regulation remains elusive. Our findings point to a new function of H3K36me3 that merits further investigation.
How H3K36me3 marks on a gene influence the degree of gene expression change over time remains to be elucidated. One interesting possibility is that H3K36me3 participates in the regulation of local chromatin organization and further restricts gene expression change or deregulation. Indeed, data in Drosophila show that euchromatin with low H3K36me3 is more open, is more enriched for chromatin-binding factors, and replicates earlier during S phase (Filion et al. 2010). Intriguingly, recent data in mammalian cells indicate that reduction of global H3K36me3 levels due to mutations in the SETD2 methyltransferase alters chromatin accessibility, suggesting that H3K36me3 marks can modulate nucleosome occupancy and chromatin structure (Simon et al. 2014). Previous studies have also implicated H3K36me3 marking on suppressing histone exchange on transcribed genes (Smolle et al. 2012; Venkatesh et al. 2012). These findings together with ours suggest that a low level of H3K36me3 marking might define a chromatin environment that provides greater flexibility in gene expression regulation over time. Another intriguing finding from our analyses was that 3′ UTR length correlated with gene body H3K36me3 marks, which in turn correlated with decreased mRNA expression change with aging. Since miRNAs have been proposed to participate in buffering gene expression (Yang et al. 2012), it is possible that longer 3′ UTRs afford greater numbers of miRNA-binding sites and greater buffering potential by miRNAs, which could result in more stable gene expression over time. Further elucidation of a possible link between H3K36me3 marking and miRNA-mediated gene regulation will likely be fruitful. H3K36me3 has also been implicated in preventing cryptic transcription and regulating RNA splicing. Whether those processes play a role in gene expression change through aging remains to be investigated.
Our data indicate that depletion of H3K36me3 leads to significantly shortened life span without compromising development, suggesting that H3K36me3 marking has a key role in longevity assurance. It is likely that the new role that we ascribed to H3K36me3 in maintaining gene expression stability through aging also plays a key role in promoting longevity.
Materials and methods
C. elegans strain growth and harvesting
C. elegans strain glp-1(e2141) and met-1(n4337); glp-1(e2141) stocks were kept at 16°C and grown under standard growth conditions (Brenner 1974). met-1(n4337) was outcrossed with our laboratory N2 three times and further crossed with glp-1(e2141) to generate met-1(n4337); glp-1(e2141). For ChIP-seq and mRNA-seq experiments, embryos prepared from 16°C glp-1(e2141) or met-1(n4337); glp-1(e2141) stocks by bleaching were hatched and cultured at 25°C with ∼3000 embryos per 15 cm of nematode growth medium (NGM) plate seeded with 1.5 mL of concentrated E. coli OP50 (30× overnight culture) with 50 μg/mL carbenicillin and 15 μg/mL tetracycline. For D12 samples, worms were refed once on D4. Adult worms at the D2, D4, and D12 stages were washed with ice-cold M9 three times. Worm pellets were stored at −80°C before ChIP and RNA extraction.
D. melanogaster culture and collection
Canton S flies were grown in large 100-mm embryo collection cages (∼200 flies per cage) at 25°C with a 12 h light/dark cycle, passing to new food every 2–3 d for 10 d (young samples) or 40 d (old samples). Flies were then collected, sexed, and stored at −80°C until sample preparation.
ChIP and ChIP-seq library preparation
ChIP was performed as described (Ercan et al. 2007; Landt et al. 2012). Worm pellet was ground with a mortar and pestle and cross-linked with 1% formaldehyde in PBS for 10 min at room temperature. Worm fragments were collected by spinning at 3000g for 5 min and resuspended in FA buffer followed by sonication with Bioruptor. Chromatin extract was incubated with H3 antibody (rabbit; Abcam, ab1791), H3K36me3 antibody (rabbit; Abcam, ab9050), and control rabbit IgG overnight at 4°C. Antibodies used were prescreened for specificity using dot blots. The optimal amounts of antibodies used were determined by titration in a preliminary experiment with ChIP-qPCR. Precipitated DNA (10–15 ng) from each sample was used for Illumina sequencing library preparation. DNA from ChIP was first end-repaired to generate a blunt end followed by adding single adenine base for adaptor ligation. The ligation product with adaptor was size-selected and amplified by PCR with primers targeting the adaptor. Up to 12 samples were multiplexed in one lane for single-end 50-nt Illumina HiSeq sequencing. Raw ChIP-seq data have been deposited at Gene Expression Omnibus (GEO; accession no. GSE62720).
For fly samples, chromatin was generated as described, starting with 2000 heads per sample. ChIP was also performed as described (Wood et al. 2010) using 4 μg of H3K36me3 antibody (Abcam, ab9050) with 10 μg of chromatin. Samples were then hybridized and scanned using the GeneChip Drosophila Tiling 2.0R array (Affymetrix) according to the manufacturer's instructions.
ChIP-seq data analysis
Preprocessings of sequencing reads from the Illumina platform were performed using the FASTX Toolkit (http://hannonlab.cshl.edu/fastx_toolkit). The sequencing reads were aligned to the ce6 version of the C. elegans genome using BWA version 0.6.1 with 6% maximum mismatch (Li and Durbin 2009). PCR duplicates were removed using SAMtools version 0.1.18 (Li et al. 2009). Genome-wide estimates of a smoothed tag enrichment profile were performed using SPP version 1.0 with a bandwidth of 200 base pairs (bp) and a step of 100 bp (Kharchenko et al. 2008). The smoothed enrichment profiles of different replicates at the studied ages were compared at windows of 1000 bp to obtain Pearson correlations (Liu et al. 2011). To robustly identify enriched and differentially marked units, including genes and transcripts, at different stages, we used GLMM, which models both fixed time-point effects and random replication effects. For each gene or transcript region of interest, normalized reads (RPM [reads per million mapped reads]) were counted for H3K36me3 and H3 from each biological replicate at different time points and analyzed using GLMM to estimate the time-point effect (i.e., old/young) and the random effect (i.e., variability among replicates). The Benjamini-Hochberg method was used to control for multiple comparisons. The FDR at 0.01 was used as a cutoff for identifying statistically significant units.
The normalized H3K36me3 level of each gene or transcript is presented as the average log2 value of the ratio of H3K36me3 to H3 (H3K36me3 RPM/H3 RPM) from three biological replicates except where otherwise indicated. For some analyses, normalized H3K36me3 levels for gene bodies (transcriptional start site to transcriptional termination site as annotated in ce6), concatenated exons or introns, and 3′ UTR regions were calculated using Homer (Heinz et al. 2010) with ce6 version of the C. elegans genome.
For 5′ UTR length calculation, 5′ UTR was defined as the region between transcriptional start site (Chen et al. 2013; Kruesi et al. 2013) and translational start site. Metagene plots of H3K36me3 across gene body regions were generated by using ngs.plot (Shen et al. 2014) with indexed BAM files.
RNA-seq library preparation and data analysis
Total RNA was extracted from worms harvested at the same stages as ChIP-seq sample preparation for glp-1(e2141), met-1(n4337); glp-1(e2141), or RNAi-treated glp-1(e2141) worms using TRI reagent (Molecular Research Center). mRNA was purified through polyA enrichment, and the mRNA-seq library was prepared with the Illumina TruSeq RNA and DNA sample preparation kit. Three to 12 samples were multiplexed in one lane for single-end 50-nt Illumina HiSeq sequencing. Raw RNA-seq data have been deposited at GEO (accession no. GSE62720).
For fly samples, mRNA was extracted from frozen fly heads using the Dynabeads mRNA Direct kit (Invitrogen). Two-hundred nanograms of mRNA was then used to prepare RNA-seq libraries, which were sequenced on an Illumina HiSeq 2000 at six samples per lane.
For data analysis, tRNA and rRNA reads were first filtered out using Bowtie (Langmead et al. 2009), and the remaining reads were further aligned to ce6 transcript annotation by TopHat or TopHat2 with no novel junctions allowed (Trapnell et al. 2009, 2012). The uniquely aligned reads with a maximum of two mismatches were kept for differential expression analysis using Cufflinks (Trapnell et al. 2010, 2012). The relative expression levels at different ages were calculated as the log2 ratio of FPKM using CuffDiff of Cufflinks software version 2.0.0 or 2.2.1 (Trapnell et al. 2012). The R package CummeRbund version 1.2.0 was used to further analyze the output expression data (Trapnell et al. 2012). A Q-value cutoff of 0.05 was set for identifying differentially expressed genes.
Tissue-specific and ubiquitous gene extraction
The gene lists with specific tissue expression profiles were downloaded from the companion Web site for Spencer et al. (2011) (http://www.vanderbilt.edu/wormdoc/wormmap/Selectively_enriched_genes.html). The selectively enriched gene lists from larval data sets (all neurons, body wall muscle, intestine, and hypodermis) were used for our analyses. For non-tissue-specifically expressed genes, expression profiles of all genes (gene_expr_RMA_avg_X_series.txt.gz) were downloaded from Expression_Matrix (http://www.vanderbilt.edu/wormdoc/wormmap/Expression_Matrix.html). Genes that have similar expression levels under different developmental stages and cell types were extracted with standard deviations of expression levels of different developmental stages and cell types as criteria. The top 3000 genes with low standard deviation were taken out and mapped with our ChIP-seq and mRNA-seq results. From this gene group, 194 genes were further randomly picked for our correlation analysis to avoid expression-level bias and make a sample size similar to that of tissue-specific genes.
The tissue expression profiles of the genes sets (tissue-specific and ubiquitous) that we picked were further verified by the Web site-embedded tool Tissue Expression Predictions for C. elegans version 1.0 (http://worm-tissue.princeton.edu/search/multi).
RNAi treatment for mRNA-seq
The met-1 RNAi clone was obtained from the Ahringher bacteria library (Kamath and Ahringer 2003). Control L4440 or met-1 RNAi bacteria were grown in Luria broth with 50 µg/mL ampicillin at 37°C until OD600 of ∼0.75 and concentrated 30 times, and 1.5 mL was seeded on each 15-cm plate. Bacteria were induced with 4 mM IPTG for 4 h before worm embryo seeding. About 3000 worm embryos prepared by bleaching from glp-1(e2141) stock at 16°C were seeded onto each 15-cm RNAi plate. Worms were grown at 25°C and collected at adult D2, D6, and D12. For D12 samples, worms were refed once on D6 with IPTG-induced RNAi bacteria.
Life span experiment
Embryos from 16°C cultured glp-1(e2141) and met-1(n4337); glp-1(e2141) strains were seeded onto life span plates, hatched, and maintained at 25°C. For N2 and met-1(n4337) strains, embryos laid at 20°C were hatched and maintained at 25°C. L4 stage hermaphrodites were picked for life span measurement. Worms were transferred to freshly induced (overnight with IPTG) RNAi plates every 2 d until approximately D12. Life span was measured by scoring worms every other day or every day. The survival function was estimated using the Kaplan Meier estimator (SPSS software), and statistical analysis was done using the log-rank test. P-value ≤ 0.01 was considered as significantly different from the control population.
Supplementary Material
Acknowledgments
We thank the Caenorhabditis elegans Genetics Center for worm strains. We thank M.J. Guertin (Cornell University) for suggestions and support for ChIP-seq library preparation and sequencing data analysis; Cornell Statistical Consulting Unit, H.Y. Bar, and J. Booth (Cornell University) for help with statistical analysis; and members of the Lee laboratory (Cornell University) and Charles Danko (Cornell University) for insightful discussion and manuscript reading. This work was supported by the Ellison Medical Foundation Senior Scholar Award and R01 grant AG024425 to S.S.L., an Ellison Medical Foundation/American Federation for Aging Research post-doctoral fellowship to M.P., and National Institute of General Medical Sciences (NIGMS) grants R01 GM104424 and R01 GM108716 and National Cancer Institute (NCI) grant R01 CA167824 to H.Y.
Footnotes
Supplemental material is available for this article.
Article is online at http://www.genesdev.org/cgi/doi/10.1101/gad.254144.114.
References
- Andersen EC, Horvitz HR. 2007. Two C. elegans histone methyltransferases repress lin-3 EGF transcription to inhibit vulval development. Development 134: 2991–2999. [DOI] [PubMed] [Google Scholar]
- Barski A, Cuddapah S, Cui K, Roh TY, Schones DE, Wang Z, Wei G, Chepelev I, Zhao K. 2007. High-resolution profiling of histone methylations in the human genome. Cell 129: 823–837. [DOI] [PubMed] [Google Scholar]
- Brenner S. 1974. The genetics of Caenorhabditis elegans. Genetics 77: 71–94. [DOI] [PMC free article] [PubMed] [Google Scholar]
- Budovskaya YV, Wu K, Southworth LK, Jiang M, Tedesco P, Johnson TE, Kim SK. 2008. An elt-3/elt-5/elt-6 GATA transcription circuit guides aging in C. elegans. Cell 134: 291–303. [DOI] [PMC free article] [PubMed] [Google Scholar]
- Carrozza MJ, Li B, Florens L, Suganuma T, Swanson SK, Lee KK, Shia WJ, Anderson S, Yates J, Washburn MP, et al. 2005. Histone H3 methylation by Set2 directs deacetylation of coding regions by Rpd3S to suppress spurious intragenic transcription. Cell 123: 581–592. [DOI] [PubMed] [Google Scholar]
- Chen RA, Down TA, Stempor P, Chen QB, Egelhofer TA, Hillier LW, Jeffers TE, Ahringer J. 2013. The landscape of RNA polymerase II transcription initiation in C. elegans reveals promoter and enhancer architectures. Genome Res 23: 1339–1347. [DOI] [PMC free article] [PubMed] [Google Scholar]
- Curran SP, Ruvkun G. 2007. Lifespan regulation by evolutionarily conserved genes essential for viability. PLoS Genet 3: e56. [DOI] [PMC free article] [PubMed] [Google Scholar]
- Dang W, Steffen KK, Perry R, Dorsey JA, Johnson FB, Shilatifard A, Kaeberlein M, Kennedy BK, Berger SL. 2009. Histone H4 lysine 16 acetylation regulates cellular lifespan. Nature 459: 802–807. [DOI] [PMC free article] [PubMed] [Google Scholar]
- de Almeida SF, Grosso AR, Koch F, Fenouil R, Carvalho S, Andrade J, Levezinho H, Gut M, Eick D, Gut I, et al. 2011. Splicing enhances recruitment of methyltransferase HYPB/Setd2 and methylation of histone H3 Lys36. Nat Struct Mol Biol 18: 977–983. [DOI] [PubMed] [Google Scholar]
- de Magalhaes JP, Curado J, Church GM. 2009. Meta-analysis of age-related gene expression profiles identifies common signatures of aging. Bioinformatics 25: 875–881. [DOI] [PMC free article] [PubMed] [Google Scholar]
- Edmunds JW, Mahadevan LC, Clayton AL. 2008. Dynamic histone H3 methylation during gene induction: HYPB/Setd2 mediates all H3K36 trimethylation. EMBO J 27: 406–420. [DOI] [PMC free article] [PubMed] [Google Scholar]
- Ercan S, Giresi PG, Whittle CM, Zhang X, Green RD, Lieb JD. 2007. X chromosome repression by localization of the C. elegans dosage compensation machinery to sites of transcription initiation. Nat Genet 39: 403–408. [DOI] [PMC free article] [PubMed] [Google Scholar]
- Feser J, Tyler J. 2011. Chromatin structure as a mediator of aging. FEBS Lett 585: 2041–2048. [DOI] [PMC free article] [PubMed] [Google Scholar]
- Filion GJ, van Bemmel JG, Braunschweig U, Talhout W, Kind J, Ward LD, Brugman W, de Castro IJ, Kerkhoven RM, Bussemaker HJ, et al. 2010. Systematic protein location mapping reveals five principal chromatin types in Drosophila cells. Cell 143: 212–224. [DOI] [PMC free article] [PubMed] [Google Scholar]
- Fontebasso AM, Schwartzentruber J, Khuong-Quang DA, Liu XY, Sturm D, Korshunov A, Jones DT, Witt H, Kool M, Albrecht S, et al. 2013. Mutations in SETD2 and genes affecting histone H3K36 methylation target hemispheric high-grade gliomas. Acta Neuropathol 125: 659–669. [DOI] [PMC free article] [PubMed] [Google Scholar]
- Glass D, Vinuela A, Davies MN, Ramasamy A, Parts L, Knowles D, Brown AA, Hedman AK, Small KS, Buil A, et al. 2013. Gene expression changes with age in skin, adipose tissue, blood and brain. Genome Biol 14: R75. [DOI] [PMC free article] [PubMed] [Google Scholar]
- Golden TR, Melov S. 2007. Gene expression changes associated with aging in C. elegans. WormBook 1–12. [DOI] [PMC free article] [PubMed] [Google Scholar]
- Greer EL, Maures TJ, Hauswirth AG, Green EM, Leeman DS, Maro GS, Han S, Banko MR, Gozani O, Brunet A. 2010. Members of the H3K4 trimethylation complex regulate lifespan in a germline-dependent manner in C. elegans. Nature 466: 383–387. [DOI] [PMC free article] [PubMed] [Google Scholar]
- Greer EL, Maures TJ, Ucar D, Hauswirth AG, Mancini E, Lim JP, Benayoun BA, Shi Y, Brunet A. 2011. Transgenerational epigenetic inheritance of longevity in Caenorhabditis elegans. Nature 479: 365–371. [DOI] [PMC free article] [PubMed] [Google Scholar]
- Hamilton B, Dong Y, Shindo M, Liu W, Odell I, Ruvkun G, Lee SS. 2005. A systematic RNAi screen for longevity genes in C. elegans. Genes Dev 19: 1544–1555. [DOI] [PMC free article] [PubMed] [Google Scholar]
- Hampsey M, Reinberg D. 2003. Tails of intrigue: phosphorylation of RNA polymerase II mediates histone methylation. Cell 113: 429–432. [DOI] [PubMed] [Google Scholar]
- Hannum G, Guinney J, Zhao L, Zhang L, Hughes G, Sadda S, Klotzle B, Bibikova M, Fan JB, Gao Y, et al. 2013. Genome-wide methylation profiles reveal quantitative views of human aging rates. Mol Cell 49: 359–367. [DOI] [PMC free article] [PubMed] [Google Scholar]
- Heinz S, Benner C, Spann N, Bertolino E, Lin YC, Laslo P, Cheng JX, Murre C, Singh H, Glass CK. 2010. Simple combinations of lineage-determining transcription factors prime cis-regulatory elements required for macrophage and B cell identities. Mol Cell 38: 576–589. [DOI] [PMC free article] [PubMed] [Google Scholar]
- Hong MG, Myers AJ, Magnusson PK, Prince JA. 2008. Transcriptome-wide assessment of human brain and lymphocyte senescence. PLoS One 3: e3024. [DOI] [PMC free article] [PubMed] [Google Scholar]
- Horvath S. 2013. DNA methylation age of human tissues and cell types. Genome Biol 14: R115. [DOI] [PMC free article] [PubMed] [Google Scholar]
- Huang DW, Sherman BT, Lempicki RA. 2009. Systematic and integrative analysis of large gene lists using DAVID bioinformatics resources. Nat Protoc 4: 44–57. [DOI] [PubMed] [Google Scholar]
- Jin C, Li J, Green CD, Yu X, Tang X, Han D, Xian B, Wang D, Huang X, Cao X, et al. 2011. Histone demethylase UTX-1 regulates C. elegans life span by targeting the insulin/IGF-1 signaling pathway. Cell Metab 14: 161–172. [DOI] [PubMed] [Google Scholar]
- Jung HJ, Suh Y. 2012. MicroRNA in aging: from discovery to biology. Curr Genomics 13: 548–557. [DOI] [PMC free article] [PubMed] [Google Scholar]
- Kamath RS, Ahringer J. 2003. Genome-wide RNAi screening in Caenorhabditis elegans. Methods 30: 313–321. [DOI] [PubMed] [Google Scholar]
- Kayo T, Allison DB, Weindruch R, Prolla TA. 2001. Influences of aging and caloric restriction on the transcriptional profile of skeletal muscle from rhesus monkeys. Proc Natl Acad Sci 98: 5093–5098. [DOI] [PMC free article] [PubMed] [Google Scholar]
- Kharchenko PV, Tolstorukov MY, Park PJ. 2008. Design and analysis of ChIP-seq experiments for DNA-binding proteins. Nat Biotechnol 26: 1351–1359. [DOI] [PMC free article] [PubMed] [Google Scholar]
- Kim S, Benguria A, Lai CY, Jazwinski SM. 1999. Modulation of life-span by histone deacetylase genes in Saccharomyces cerevisiae. Mol Biol Cell 10: 3125–3136. [DOI] [PMC free article] [PubMed] [Google Scholar]
- Kim S, Kim H, Fong N, Erickson B, Bentley DL. 2011. Pre-mRNA splicing is a determinant of histone H3K36 methylation. Proc Natl Acad Sci 108: 13564–13569. [DOI] [PMC free article] [PubMed] [Google Scholar]
- Kolasinska-Zwierz P, Down T, Latorre I, Liu T, Liu XS, Ahringer J. 2009. Differential chromatin marking of introns and expressed exons by H3K36me3. Nat Genet 41: 376–381. [DOI] [PMC free article] [PubMed] [Google Scholar]
- Kouzarides T. 2007. Chromatin modifications and their function. Cell 128: 693–705. [DOI] [PubMed] [Google Scholar]
- Kruesi WS, Core LJ, Waters CT, Lis JT, Meyer BJ. 2013. Condensin controls recruitment of RNA polymerase II to achieve nematode X-chromosome dosage compensation. eLife 2: e00808. [DOI] [PMC free article] [PubMed] [Google Scholar]
- Labbadia J, Morimoto RI. 2014. Proteostasis and longevity: when does aging really begin? F1000prime Rep 6: 7. [DOI] [PMC free article] [PubMed] [Google Scholar]
- Landt SG, Marinov GK, Kundaje A, Kheradpour P, Pauli F, Batzoglou S, Bernstein BE, Bickel P, Brown JB, Cayting P, et al. 2012. ChIP-seq guidelines and practices of the ENCODE and modENCODE consortia. Genome Res 22: 1813–1831. [DOI] [PMC free article] [PubMed] [Google Scholar]
- Langmead B, Trapnell C, Pop M, Salzberg SL. 2009. Ultrafast and memory-efficient alignment of short DNA sequences to the human genome. Genome Biol 10: R25. [DOI] [PMC free article] [PubMed] [Google Scholar]
- Lee CK, Klopp RG, Weindruch R, Prolla TA. 1999. Gene expression profile of aging and its retardation by caloric restriction. Science 285: 1390–1393. [DOI] [PubMed] [Google Scholar]
- Lee CK, Weindruch R, Prolla TA. 2000. Gene-expression profile of the ageing brain in mice. Nat Genet 25: 294–297. [DOI] [PubMed] [Google Scholar]
- Li H, Durbin R. 2009. Fast and accurate short read alignment with Burrows-Wheeler transform. Bioinformatics 25: 1754–1760. [DOI] [PMC free article] [PubMed] [Google Scholar]
- Li B, Gogol M, Carey M, Pattenden SG, Seidel C, Workman JL. 2007. Infrequently transcribed long genes depend on the Set2/Rpd3S pathway for accurate transcription. Genes Dev 21: 1422–1430. [DOI] [PMC free article] [PubMed] [Google Scholar]
- Li H, Handsaker B, Wysoker A, Fennell T, Ruan J, Homer N, Marth G, Abecasis G, Durbin R; 1000 Genome Project Data Processing Subgroup. 2009. The sequence alignment/map format and SAMtools. Bioinformatics 25: 2078–2079. [DOI] [PMC free article] [PubMed] [Google Scholar]
- Li F, Mao G, Tong D, Huang J, Gu L, Yang W, Li GM. 2013. The histone mark H3K36me3 regulates human DNA mismatch repair through its interaction with MutSα. Cell 153: 590–600. [DOI] [PMC free article] [PubMed] [Google Scholar]
- Liu T, Ortiz JA, Taing L, Meyer CA, Lee B, Zhang Y, Shin H, Wong SS, Ma J, Lei Y, et al. 2011. Cistrome: an integrative platform for transcriptional regulation studies. Genome Biol 12: R83. [DOI] [PMC free article] [PubMed] [Google Scholar]
- Mangone M, Manoharan AP, Thierry-Mieg D, Thierry-Mieg J, Han T, Mackowiak SD, Mis E, Zegar C, Gutwein MR, Khivansara V, et al. 2010. The landscape of C. elegans 3′UTRs. Science 329: 432–435. [DOI] [PMC free article] [PubMed] [Google Scholar]
- Maures TJ, Greer EL, Hauswirth AG, Brunet A. 2011. The H3K27 demethylase UTX-1 regulates C. elegans lifespan in a germline-independent, insulin-dependent manner. Aging Cell 10: 980–990. [DOI] [PMC free article] [PubMed] [Google Scholar]
- McCarroll SA, Murphy CT, Zou S, Pletcher SD, Chin CS, Jan YN, Kenyon C, Bargmann CI, Li H. 2004. Comparing genomic expression patterns across species identifies shared transcriptional profile in aging. Nat Genet 36: 197–204. [DOI] [PubMed] [Google Scholar]
- McColl G, Killilea DW, Hubbard AE, Vantipalli MC, Melov S, Lithgow GJ. 2008. Pharmacogenetic analysis of lithium-induced delayed aging in Caenorhabditis elegans. J Biol Chem 283: 350–357. [DOI] [PMC free article] [PubMed] [Google Scholar]
- Mikkelsen TS, Ku M, Jaffe DB, Issac B, Lieberman E, Giannoukos G, Alvarez P, Brockman W, Kim TK, Koche RP, et al. 2007. Genome-wide maps of chromatin state in pluripotent and lineage-committed cells. Nature 448: 553–560. [DOI] [PMC free article] [PubMed] [Google Scholar]
- Pletcher SD, Macdonald SJ, Marguerie R, Certa U, Stearns SC, Goldstein DB, Partridge L. 2002. Genome-wide transcript profiles in aging and calorically restricted Drosophila melanogaster. Curr Biol 12: 712–723. [DOI] [PubMed] [Google Scholar]
- Pokholok DK, Harbison CT, Levine S, Cole M, Hannett NM, Lee TI, Bell GW, Walker K, Rolfe PA, Herbolsheimer E, et al. 2005. Genome-wide map of nucleosome acetylation and methylation in yeast. Cell 122: 517–527. [DOI] [PubMed] [Google Scholar]
- Pradeepa MM, Sutherland HG, Ule J, Grimes GR, Bickmore WA. 2012. Psip1/Ledgf p52 binds methylated histone H3K36 and splicing factors and contributes to the regulation of alternative splicing. PLoS Genet 8: e1002717. [DOI] [PMC free article] [PubMed] [Google Scholar]
- Priess JR, Schnabel H, Schnabel R. 1987. The glp-1 locus and cellular interactions in early C. elegans embryos. Cell 51: 601–611. [DOI] [PubMed] [Google Scholar]
- Shen L, Shao N, Liu X, Nestler E. 2014. ngs.plot: quick mining and visualization of next-generation sequencing data by integrating genomic databases. BMC Genomics 15: 284. [DOI] [PMC free article] [PubMed] [Google Scholar]
- Shilatifard A. 2006. Chromatin modifications by methylation and ubiquitination: implications in the regulation of gene expression. Annu Rev Biochem 75: 243–269. [DOI] [PubMed] [Google Scholar]
- Siebold AP, Banerjee R, Tie F, Kiss DL, Moskowitz J, Harte PJ. 2010. Polycomb repressive complex 2 and Trithorax modulate Drosophila longevity and stress resistance. Proc Natl Acad Sci 107: 169–174. [DOI] [PMC free article] [PubMed] [Google Scholar]
- Simon JM, Hacker KE, Singh D, Brannon AR, Parker JS, Weiser M, Ho TH, Kuan PF, Jonasch E, Furey TS, et al. 2014. Variation in chromatin accessibility in human kidney cancer links H3K36 methyltransferase loss with widespread RNA processing defects. Genome Res 24: 241–250. [DOI] [PMC free article] [PubMed] [Google Scholar]
- Smith-Vikos T, Slack FJ. 2012. MicroRNAs and their roles in aging. J Cell Sci 125: 7–17. [DOI] [PMC free article] [PubMed] [Google Scholar]
- Smolle M, Venkatesh S, Gogol MM, Li H, Zhang Y, Florens L, Washburn MP, Workman JL. 2012. Chromatin remodelers Isw1 and Chd1 maintain chromatin structure during transcription by preventing histone exchange. Nat Struct Mol Biol 19: 884–892. [DOI] [PMC free article] [PubMed] [Google Scholar]
- Spencer WC, Zeller G, Watson JD, Henz SR, Watkins KL, McWhirter RD, Petersen S, Sreedharan VT, Widmer C, Jo J, et al. 2011. A spatial and temporal map of C. elegans gene expression. Genome Res 21: 325–341. [DOI] [PMC free article] [PubMed] [Google Scholar]
- Trapnell C, Pachter L, Salzberg SL. 2009. TopHat: discovering splice junctions with RNA-seq. Bioinformatics 25: 1105–1111. [DOI] [PMC free article] [PubMed] [Google Scholar]
- Trapnell C, Williams BA, Pertea G, Mortazavi A, Kwan G, van Baren MJ, Salzberg SL, Wold BJ, Pachter L. 2010. Transcript assembly and quantification by RNA-seq reveals unannotated transcripts and isoform switching during cell differentiation. Nat Biotechnol 28: 511–515. [DOI] [PMC free article] [PubMed] [Google Scholar]
- Trapnell C, Roberts A, Goff L, Pertea G, Kim D, Kelley DR, Pimentel H, Salzberg SL, Rinn JL, Pachter L. 2012. Differential gene and transcript expression analysis of RNA-seq experiments with TopHat and Cufflinks. Nat Protoc 7: 562–578. [DOI] [PMC free article] [PubMed] [Google Scholar]
- Venkatesh S, Smolle M, Li H, Gogol MM, Saint M, Kumar S, Natarajan K, Workman JL. 2012. Set2 methylation of histone H3 lysine 36 suppresses histone exchange on transcribed genes. Nature 489: 452–455. [DOI] [PubMed] [Google Scholar]
- Wagner EJ, Carpenter PB. 2012. Understanding the language of Lys36 methylation at histone H3. Nat Rev Mol Cell Biol 13: 115–126. [DOI] [PMC free article] [PubMed] [Google Scholar]
- Wen H, Li Y, Xi Y, Jiang S, Stratton S, Peng D, Tanaka K, Ren Y, Xia Z, Wu J, et al. 2014. ZMYND11 links histone H3.3K36me3 to transcription elongation and tumour suppression. Nature 508: 263–268. [DOI] [PMC free article] [PubMed] [Google Scholar]
- Winnefeld M, Lyko F. 2012. The aging epigenome: DNA methylation from the cradle to the grave. Genome Biol 13: 165. [DOI] [PMC free article] [PubMed] [Google Scholar]
- Wood JG, Helfand SL. 2013. Chromatin structure and transposable elements in organismal aging. Front Genet 4: 274. [DOI] [PMC free article] [PubMed] [Google Scholar]
- Wood JG, Hillenmeyer S, Lawrence C, Chang C, Hosier S, Lightfoot W, Mukherjee E, Jiang N, Schorl C, Brodsky AS, et al. 2010. Chromatin remodeling in the aging genome of Drosophila. Aging Cell 9: 971–978. [DOI] [PMC free article] [PubMed] [Google Scholar]
- Yang Z, Dong D, Zhang Z, Crabbe MJ, Wang L, Zhong Y. 2012. Preferential regulation of stably expressed genes in the human genome suggests a widespread expression buffering role of microRNAs. BMC Genomics 13: S14. [DOI] [PMC free article] [PubMed] [Google Scholar]
- Youngman MJ, Rogers ZN, Kim DH. 2011. A decline in p38 MAPK signaling underlies immunosenescence in Caenorhabditis elegans. PLoS Genet 7: e1002082. [DOI] [PMC free article] [PubMed] [Google Scholar]
- Zahn JM, Sonu R, Vogel H, Crane E, Mazan-Mamczarz K, Rabkin R, Davis RW, Becker KG, Owen AB, Kim SK. 2006. Transcriptional profiling of aging in human muscle reveals a common aging signature. PLoS Genet 2: e115. [DOI] [PMC free article] [PubMed] [Google Scholar]
- Zou S, Meadows S, Sharp L, Jan LY, Jan YN. 2000. Genome-wide study of aging and oxidative stress response in Drosophila melanogaster. Proc Natl Acad Sci 97: 13726–13731. [DOI] [PMC free article] [PubMed] [Google Scholar]
Associated Data
This section collects any data citations, data availability statements, or supplementary materials included in this article.