

Abstract
Background:
Squats and lunges are commonly prescribed rehabilitation exercises used to improve performance across a wide spectrum of patient populations. However, biomechanical studies have mainly examined young, normal weight populations performing these exercises at a difficulty level potentially too challenging for obese individuals. Understanding how obesity and different levels of difficulty affect lower extremity biomechanics could help to inform rehabilitation approaches used for obese individuals.
Purpose:
The purpose of this study was to analyze and compare the lower extremity kinematics and kinetics in obese and normal weight females during performance of progressively more difficult squat and lunge exercises.
Study Design:
Cross‐sectional study design
Methods:
Ten obese females (mean age, 37.4 years; BMI 39.2 ± 3.7 kg/m2) and ten normal‐weight, age‐matched female controls (38.1 years, BMI < 23 kg/m2) volunteered for the study. Each group performed two exercises, each in three different iterations: squatting at three standardized knee angles (60°, 70°, and 80°) and lunging at three standardized distances (1.0, 1.1, and 1.2 times tibial length). Three dimensional motion analysis using infrared markers and force plates was used to calculate range of motion as well as hip, knee, ankle and support moments (normalized for body weight). A repeated measures ANOVA model was used to determine between and within group differences.
Results:
Support moments were higher in obese females for squat 70° (p=0.03) and 80° (p=0.01). Ankle extensor moments were higher in obese females for squat 80° (p=0.04). During lunge at all levels (1.0, 1.1, and 1.2), hip extensor moments were higher in obese subjects (p=0.004, 0.003, and 0.007 respectively). Within group, the support moments were significantly higher during squat 80° than squat 60° (p=0.01) in obese females. A non‐linear relationship was found between hip moments and BMI during squat 60°, 70°, and 80°.
Conclusion:
During two commonly prescribed rehabilitation exercises (squat and lunge), there were significantly greater support moments in obese individuals compared to normal controls. The non‐linear associations between kinetic and anthropometric measures make the assessment of how best to approach exercise in obese individuals challenging.
Level of evidence:
Level 3
Keywords: Biomechanics, lunge, obesity, physical therapy, squat
INTRODUCTION
Squat and lunge exercises are common activities that have become an integral part of lower‐extremity strengthening and postoperative rehabilitation programs. They are universally used with patients across the spectrum of age and body mass index (BMI).1,2 The closed‐chain, multi‐joint nature of these exercises is considered part of the basic rehabilitation strategy that has implications for improved performance in functional activities and gait.3 Gradation of these exercises not only challenges the torque requirements across the lower limb joints, but also challenges standing balance.3,4
Previous research on squat and lunge exercises has primarily focused on electromyographic analysis to study muscle recruitment and strengthening with few studies focusing on the biomechanics.2,5 Biomechanical analyses have demonstrated varying lower limb kinetic demands during rehabilitation of ACL reconstructive patients when performing the squat exercise.6 During the lunge exercise, the influence of forward trunk position on lower limb kinetics, specifically hip and knee joint moments, has been documented.7 While these exercises are used clinically across the age spectrum, most studies have been conducted on younger, normal‐weight, populations.8,9 Thus, the influence of obesity on performance has not been documented.
Although no studies of obese individuals performing these two activities were found, previous studies underscore the potential for adiposity to influence activity performance.10,11 An increase in biomechanical stresses, as quantified by joint moments, has been reported during standing forward reaching tasks in obese subjects.12 Gilleard et al12 suggested that increased moments were likely due to biomechanically disadvantageous postures used by obese individuals, rather than their increased body mass. Underlying these postural deviations are reductions in joint range of motion, which may cause modification in the movement strategy, with potential implications for increases in associated biomechanical stresses.10 When performing sit to stand activities, lower hip and higher knee extensor moments were seen in obese subjects as compared to normal‐weight subjects, attributable to limited trunk flexion.13 It seems possible that obese individuals may use similar postural modifications and movement strategies when performing rehabilitation exercises, such as the squat and lunge, resulting in altered biomechanical joint stresses, contributing to joint pain and discomfort that is commonly experienced by this population.
Despite the potential for biomechanical performance differences in obese individuals, namely increased joint stress and limited range of motion,10 when compared to normal‐weight individuals, there is no published data demonstrating that clinicians make different recommendations when prescribing exercises for obese individuals. Taking the biomechanical stresses and strategies into consideration during common exercises may improve the rehabilitation approaches used for obese individuals; specifically adult women, who are particularly at risk for developing musculoskeletal disorders like knee osteoarthritis.22,23 The purpose of this study was to analyze the biomechanics of obese and normal‐weight females, as measured by hip, knee, and ankle moments, during squat and lunge exercises. It was hypothesized that restricted joint mobility in obese females would be associated with decreased hip and increased knee joint moments as compared to normal‐weight females, and that these differences would be more evident as the level of difficulty of squat and lunge increased.
METHODS
Participants
Ten obese females (BMI > 30 kg/m2), age 37.4 ± 3.7 years, BMI 39.2 ± 3.7 kg/m2 and ten normal‐weight (BMI<23 kg/m2), age‐matched, female controls, age 38.1 ± 4.5 years, BMI 21.6 ± 2.3 kg/m2, volunteered for the study. All subjects provided informed consent prior to participation in the study.
Procedures
The study protocol was approved by the Institutional Review Board of the University of Iowa, Iowa City, IA. The subjects came to the laboratory for a single session, when all necessary data was collected. Height, weight, waist circumference, hip circumference and tibial length were recorded prior to testing. Waist circumference was measured at the level of the right iliac crest and hip circumference was measured at the widest part of the hip with a Gulick II tape measure (Country Technology Inc., Gays Mills, WI). Triads of infrared emitting diodes (IREDs) were placed on the pelvis and trunk, and bilaterally on the thighs, legs, and feet. Markers were affixed to the lateral aspect of the foot, to the shaft of the tibia, and to the lateral aspect of the thigh. Femoral epicondyle motion was tracked by two markers mounted on a custom femoral tracking device.14 Pelvic and trunk marker triads were attached to 5 cm extensions with base plates affixed over the sacrum and lower cervical vertebrae (Figure 1).
Figure 1.

The skeletal model of an obese female subject during squat exercise (left), placement of markers (center) and lunge exercise (right)
A link‐based model was generated for tracking each segment. Anatomical landmarks were digitized, relative to segment local coordinate systems, with the subject standing in a neutral position, to create an anatomical model. Segment principal axes were defined by digitizing the following bony landmarks: Pelvis: anterior and posterior superior iliac spines; Trunk: C‐7 and L‐1 vertebrae and glenohumeral joints; Thigh: lateral condyle, medial condyle and functional hip joint center; Shank: lateral condyle, medial condyle and malleoli; Foot: posterior heel, 5th metatarsal head, and second toe.15,16 The functional method was used to estimate the hip joint center.17 The reliability of digitizing the anterior superior iliac spine (ASIS) was verified on six obese and seven normal‐weight adult subjects by re‐digitizing the ASIS landmarks at the end of the digitizing process. The respective ICC for the X, Y, Z locations for obese/normal‐weight subjects was 0.93/0.99;0.92/0.86; and 0.99/0.99.
Kinematic data were collected using an Optotrak motion analysis system (Model 3020, Northern Digital Inc., Waterloo, Ontario, Canada) operating at 60 Hz. Kinematic data were filtered at 6 Hz, using a zero phase lag, fourth‐order, Butterworth low pass filter. Kinetic data were obtained using a Kistler force plate (Kistler Instruments, Inc., Amherst, NY). The force plate data were sampled at 300 Hz, and were filtered at 6 Hz. Visual 3D software (C‐Motion Inc. Kingston, Ontario) was used to perform link‐segment calculations.
Testing sessions included two trials of each difficulty level of the squat and lunge. The squat protocol consisted of squatting down, feet shoulder width apart, with right foot on the force plate and held for three seconds at three different knee angles: 60°, 70°, and 80° of knee flexion (full knee extension being 0°) (Figure 1). Real time feedback, showing a target line and a line representing the right knee angle in real‐time, was used to achieve the desired knee angle.18 The forward lunge was held for three seconds, with feet shoulder width apart and positioned on the force plates, at three different distances between heel and toe: 1.0, 1.1, 1.2 times subject’s tibial length (Figure 1).19
Data Analysis
Visual 3D software (C‐Motion) was used for processing kinematics and inverse kinetics. The moments were normalized to body weight. Lower limb range of motion at the hip, knee and ankle, and trunk segment flexion angles, were determined from link‐segment analysis. Mean values, while holding each position for three seconds, were calculated for lower limb joint range of motion, net joint moments and support moment (summation of the lower limb ankle, knee and hip extensor moments). The mean of two trials, for both activities, was used for further analysis.
Statistical Analysis
Descriptive statistics in the form of means and standard deviation were estimated. A repeated measures ANOVA model (3x2; joint moments by level of difficulty) with group (obese versus normal‐weight) as a between subject factor was fitted to investigate differences in hip, knee, ankle and support moments across three levels of difficulty for the squat and for the lunge. A group‐by‐level of difficulty interaction effect was included in the model. Pearson correlation coefficients were estimated to quantify the strength of the linear association between moments and range of motion. Regression analysis was performed to define relationships between BMI or other anthropometric measures and moments. SPSS 21.0 was used for analysis with p‐value < 0.05 considered significant. All results are presented as means ± standard deviation.
RESULTS
All 20 subjects (10 obese and 10 normal‐weight) recruited for the study completed the protocol. No differences were seen in hip, knee, or ankle range of motion between obese and normal‐weight subjects during the squat or lunge (Table 1); specifically, no differences were seen for knee range of motion for squat 60°, squat 70°, or squat 80° indicating that both groups performed the squat to a similar depth. Also, no significant differences were seen in trunk flexion angle between the two groups for the squat or lunge (Table 1).
Table 1.
Hip, knee, ankle and trunk range of motion for different levels of squat and lunge exercises in obese and normal weight subjects.
| Hip | Knee | Ankle | Trunk | |||||
|---|---|---|---|---|---|---|---|---|
| Obese | Normal | Obese | Normal | Obese | Normal | Obese | Normal | |
| Squat 60° | 64.7 (19.2) | 62.3 (22.5) | 59.6 (7.9) | 57.5 (6.7) | 119.6 (5.8) | 119.3 (7.3) | 33.7 (9.2) | 34.4 (14.9) |
| Squat 70° | 75.6 (23.2) | 71.4 (25.0) | 68.4 (8.5) | 66.2 (7.5) | 121.8 (6.3) | 122.7 (7.3) | 37.8 (11.0) | 35.9 (15.6) |
| Squat 80° | 85.0 (24.2) | 82.4 (24.9) | 78.3 (9.3) | 75.3 (7.5) | 124.1 (5.7) | 125.5 (6.8) | 41.2 (12.0) | 40.6 (15.4) |
| Lunge 1.0 | 98.4 (12.2) | 89.1 (20.9) | 83.6 (12.7) | 86.7 (9.3) | 109.3 (6.9) | 117.2 (10.6) | 37.6 (7.8) | 30.9 (12.0) |
| Lunge 1.1 | 102.4 (12.8) | 91.4 (19.9) | 88.0 (11.5) | 85.9 (11.1) | 109.2 (7.4) | 114.1 (10.5) | 37.3 (9.4) | 31.2 (12.1) |
| Lunge 1.2 | 102.4 (14.3) | 92.7 (17.7) | 88.3 (13.4) | 86.5 (10.0) | 109.2 (8.9) | 112.8 (9.3) | 37.0 (9.2) | 30.5 (11.6) |
For the squat, normalized hip and knee extensor moments in obese subjects were not different than normal‐weight subjects at any degree of squat angle. Ankle extensor moments were higher in obese subjects for squat 80° (p= 0.04) (Table 2). The support moments were higher in obese subjects, as compared to the normal‐weight subjects, for squat 70° (p= 0.03) and squat 80° (p= 0.01), but not different for squat 60° (p= 0.07). Within groups, the support moments between squat 80° were greater than squat 60° in obese subjects (p = 0.01) (Figure 2).
Table 2.
Hip, knee, ankle extensor and support moments for different levels of squat and lunge exercises in obese and normal weight subjects.
| Hip | Knee | Ankle | Support | |||||
|---|---|---|---|---|---|---|---|---|
| Obese | Normal | Obese | Normal | Obese | Normal | Obese | Normal | |
| Squat 60° | 0.22 (0.24) | 0.12 (0.17) | 0.67 (0.10) | 0.59 (0.22) | 0.28 (0.16) | 0.19 (0.10) | 1.18 (0.25) | 0.92 (0.27) |
| Squat 70° | 0.29 (0.28) | 0.17 (0.18) | 0.73 (0.12) | 0.66 (0.23) | 0.31 (0.19) | 0.20 (0.13) | 1.33* (0.32) | 1.03* (0.30) |
| Squat 80° | 0.37 (0.30) | 0.24 (0.18) | 0.82 (0.12) | 0.75 (0.26) | 0.34 (0.19) | 0.20 (0.11) | 1.53* (0.36) | 1.18* (0.34) |
| Lunge 1.0 | 1.32* (0.27) | 0.96* (0.39) | 0.53 (0.15) | 0.64 (0.30) | 0.42 (0.20) | 0.45 (0.26) | 2.33 (0.36) | 2.07 (0.65) |
| Lunge 1.1 | 1.41* (0.28) | 1.07* (0.38) | 0.53 (0.16) | 0.56 (0.29) | 0.43 (0.20) | 0.42 (0.25) | 2.44 (0.42) | 2.05 (0.64) |
| Lunge 1.2 | 1.48* (0.32) | 1.14* (0.39) | 0.50 (0.22) | 0.52 (0.24) | 0.47 (0.21) | 0.40 (0.22) | 2.52 (0.47) | 2.07 (0.59) |
Significant difference between two groups (p<0.05)
Figure 2.

The support moments between squat 80° were greater (*) than squat 60° in obese subjects (p = 0.01). No differences were seen for normal weight subjects
For the lunge, hip extensor moments were higher in obese subjects at all three levels: 1.0, 1.1, and 1.2 leg length (Figure 3). Knee and ankle extensor moments were not different between obese and normal‐weight groups at any difficulty level of lunging (Table 2). Support moments showed an overall group effect between obese and normal‐ weight subjects (p = 0.01).
Figure 3.
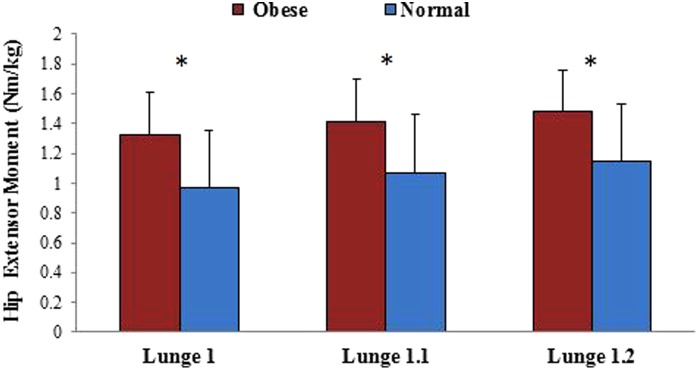
For the lunge, hip extensor moments were greater (*) in obese than normal weight subjects for level 1, 1.1 and 1.2 (p‐values: 0.004, 0.003 and 0.007 respectively)
Pearson correlation coefficients calculated between extensor moments (hip and knee) and range of motion were stronger in obese subjects as compared to normal‐weight subjects. For lunge, the correlation coefficients were significant in obese subjects and higher in magnitude as compared to normal‐weight subjects at the hip and knee joints (Table 3). For squat, significant correlations were seen at the hip in both obese and normal‐weight subjects (Table 3), whereas the correlations were only significant in obese subjects at the knee joint.
Table 3.
Pearson correlation coefficients between moments and range of motion at hip and knee joint for squat and lunge exercises.
| Hip | Knee | |||||
|---|---|---|---|---|---|---|
| Squat 60° | Squat 70° | Squat 80° | Squat 60° | Squat 70° | Squat 80° | |
| Obese | 0.89* | 0.95* | 0.92* | 0.86* | 0.68* | 0.59* |
| Normal | 0.63* | 0.57* | 0.61* | 0.14 | 0.29 | 0.30 |
| Hip | Knee | |||||
|---|---|---|---|---|---|---|
| Lunge 1.0 | Lunge 1.1 | Lunge 1.2 | Lunge 1.0 | Lunge 1.1 | Lunge 1.2 | |
| Obese | 0.67* | 0.77* | 0.75* | 0.64* | 0.77* | 0.64* |
| Normal | 0.38 | 0.36 | 0.28 | 0.04 | 0.19 | 0.01 |
Significant correlation (>0.48)
There was no linear association between BMI, waist circumference, or waist to hip ratio and joint moments for the squat or lunge at different difficulty levels. However, when the data were split into obese and normal‐weight subjects based on BMI, obese subjects showed a stronger relationship (R2=0.46) as compared to normal‐weight subjects (R2=0.26) for hip extensor moments for squat 60°. Also, there was a non‐linear relationship between peak hip extensor moment and BMI for squat 60° (Figure 4). Similar non‐linear relationships were seen for squat 70° (R2=0.42) and squat 80° (R2=0.39). A moderate relationship was seen for ankle (R2=0.14) for squat 60°, but no relationship was seen for the knee during the same squat (R2=0.03).
Figure 4.

Relationship between peak hip extensor moments for obese and normal weight subjects for squat 60°. The non‐linear polynomial fit showed a moderate relationship between hip moments and BMI
DISCUSSION
The purpose of this study was to analyze the biomechanics during the squat and lunge of obese and normal‐weight females, as measured by hip, knee and ankle moments. For the squat, the normalized support moments were higher in obese subjects when performing the two deeper squats (squat 70° and 80°). The lunge exercise showed group differences in normalized hip moments and support moments for all difficulty levels (lunge 1.0, 1.1 and 1.2). Joint range of motion was not different between obese and normal weight subjects for either activity; however, the association between range of motion and extensor moments was greater in the obese women when compared to controls. The results suggest that obese individuals may experience higher biomechanical loads than normal‐weight individuals while performing basic rehabilitation exercises at varying degrees of difficulty. Therefore, obesity should be considered as a factor when prescribing squat and lunge exercises.
A recent study of normal‐weight subjects reported similar magnitudes for knee extensor moments during the squat exercise.6 Support moments have also been used to characterize squat and stoop lifting techniques in normal‐weight individuals.20 When moments were compared for the 60‐80 degree range of knee flexion, the magnitudes were similar to the current study.
It was hypothesized that during squatting, obese subjects would have higher knee moments than normal‐weight subjects. While no significant differences were seen specifically in the knee moments, the support moments were higher in obese subjects as compared to normal weight subject during squatting. In addition, hip moments increased by nearly 100%, but the increase was not statistically significant. The increase in the net extensor moments across the three lower limb joints points to the possibility of higher generalized joint stress in obese subjects during squatting.
Analysis of the lunge exercise data showed an increase in the hip moments for the obese group and no differences in the knee and ankle moments. These results were contrary to the hypothesis that hip moments would decrease due to limits in trunk flexion, as has been reported in previous work on sit to stand activities in obese compared to normal‐weight individuals.13 However, in the current study there was no difference in trunk flexion between the obese group and the normal‐weight group, so the increase in hip moments in the obese group could be due to mass distribution, i.e. bringing the center of mass forward. A recent study of the effect of adding an external load on the biomechanics in young, normal‐weight individuals during lunge exercises, showed an increase in hip extensor moments with little change in the knee moments.21 It could be argued that the external weight simulated the excess adipose tissue in obese individuals, causing a similar increase in hip moments. This association was reinforced with the findings of a moderate relationship (R2=0.22) between hip moments and waist to hip ratios in the obese group, implying that relatively greater abdominal adiposity may be associated with greater hip moments.
Although there were no significant differences in range of motion between the obese and normal‐weight groups for either activity, stronger correlations between moments and range of motion were seen in the obese group. These higher correlations, in combination with higher support moments, might point to subtle restrictions in movement capability, which gave the obese group less flexibility in how they accomplished the squat and lunge exercises. Evidence supporting this is also seen in the standard deviations for the trunk and hip ROM (Table 1) which were consistently less in the obese population.
Additionally, a non‐linear relationship between hip moments and BMI was found (Figure 4). A non‐linear relationship indicates that an increase in BMI was not proportionally related to an increase in hip moments. Instead, this relationship followed a polynomial curve, suggesting the possibility of a ceiling effect in subjects with higher BMIs. A similar ceiling effect has been postulated for gait in obese individuals with BMI greater than 30 kg/m2 and was attributed to development of neuromuscular adaptations during gait in response to BMI or excess body mass.22,23 Similar adaptations or compensatory adjustments enabling obese individuals to reduce the joint stress relative to their BMI could explain the results in the current study.
The present study had certain limitations. First, it only examined the squat to a depth of 80 degrees of knee flexion, while some previous studies used a greater range of motion for squatting.24,25 The chosen range of motion for squatting resulted from pilot work where obese females were reluctance to perform deeper squats and due to safety concerns. Similar concerns limited the farthest lunge to 1.2 times the tibial length. These concerns were likely not an issue for the normal weight subjects who likely could have completed more challenging versions of these activities. Additionally, while subjects were instructed in the task and allowed to practice, their performance was not uniform. The strategies employed by subjects to reach the final position of the squat and the lunge exercise might have influenced their static posture and thus, the moments. Finally, the sample size may have limited the ability to find statistically significant differences in some of the outcome measures. As no previous studies on squat and lunge have been conducted in obese individuals, a sample size calculation was not feasible before the start of the study. However, post‐hoc power analysis based on the means from the current study showed good power (0.85) for lunge exercise, but low power (0.40) for squat trials.
CONCLUSION
Clinicians commonly progress rehabilitation protocols by increasing the difficulty of the exercise: by either increasing the depth of the squat or increasing the distance between feet during the lunge. The current study identified significant increases in lower limb kinetics in obese individuals during these squat and lunge exercises. These stressors may have consequences for obese individuals where there is also an increased likelihood of joint pathology; therefore, using the same exercise progressions for both obese and normal‐weight individuals may not be optimal.26 In addition, the sensitivity of joint moments to changes in ROM is greater for obese individuals, which would suggest that clinicians might need to be more sensitive to subtleties in performance. Finally, the non‐linear associations that have been uncovered between anthropometric measures and kinetic measures make the assessment of how to best approach exercise in this population even more challenging. This results of this study suggest the need to consider obesity as a factor in exercise prescription and demonstrates the complexity of factors that interact to influence kinetic measures.
REFERENCES
- 1.Flanagan SP Wang M‐Y Greendale GA Azen SP Salem GJ Biomechanical attributes of lunging activities for older adults. J Strength Cond Res. 2004; 18(3): 599. [DOI] [PMC free article] [PubMed] [Google Scholar]
- 2.Gorsuch J Long J Miller K, et al. The effect of squat depth on multiarticular muscle activation in collegiate cross‐country runners. J Strength Cond Res. 2013; 27(9): 2619‐2625. [DOI] [PubMed] [Google Scholar]
- 3.Cotter JA Chaudhari AM Jamison ST Devor ST Knee joint kinetics in relation to commonly prescribed squat loads and depths. J Strength Cond Res. 2013; 27(7): 1765‐1774. [DOI] [PMC free article] [PubMed] [Google Scholar]
- 4.Wilson DJ Gibson K Masterson GL Kinematics and kinetics of 2 styles of partial forward lunge. J Sport Rehabil. 2008; 17(4): 387‐398. [DOI] [PubMed] [Google Scholar]
- 5.Jonhagen S Ackermann P Saartok T Forward lunge: A training study of eccentric exercises of the lower limbs. J Strength Cond Res. 2009; 23(3): 972‐978. [DOI] [PubMed] [Google Scholar]
- 6.Salem GJ Salinas R Harding FV Bilateral kinematic and kinetic analysis of the squat exercise after anterior cruciate ligament reconstruction. Arch Phys Med Rehabil. 2003; 84(8): 1211‐1216. [DOI] [PubMed] [Google Scholar]
- 7.Farrokhi S Pollard CD Souza RB Chen Y‐J Reischl S Powers CM Trunk position influences the kinematics, kinetics, and muscle activity of the lead lower extremity during the forward lunge exercise. J Orthop Sports Phys Ther. 2008; 38(7): 403‐409. [DOI] [PubMed] [Google Scholar]
- 8.Flanagan S Salem GJ Wang M‐Y Sanker SE Greendale GA Squatting exercises in older adults: Kinematic and kinetic comparisons. Med Sci Sports Exerc. 2003; 35(4): 635. [DOI] [PMC free article] [PubMed] [Google Scholar]
- 9.Escamilla RF Knee biomechanics of the dynamic squat exercise. Med Sci Sports Exerc. 2001; 33(1): 127‐141. [DOI] [PubMed] [Google Scholar]
- 10.Park W Ramachandran J Weisman P Jung ES Obesity effect on male active joint range of motion. Ergonomics. 2010; 53(1): 102‐108. [DOI] [PubMed] [Google Scholar]
- 11.Singh B Brown TD Callaghan JJ Yack HJ Abdomen‐thigh contact during forward reaching tasks in obese individuals. J Appl Biomech. 2013; 29(5): 517‐524. [DOI] [PubMed] [Google Scholar]
- 12.Gilleard W Smith T Effect of obesity on posture and hip joint moments during a standing task, and trunk forward flexion motion. Int J Obes. 2006; 31(2): 267‐271. [DOI] [PubMed] [Google Scholar]
- 13.Sibella F Galli M Romei M Montesano A Crivellini M Biomechanical analysis of sit‐to‐stand movement in normal and obese subjects. Clin Biomech. 2003; 18(8): 745‐750. [DOI] [PubMed] [Google Scholar]
- 14.Houck J Yack HJ Cuddeford T Validity and comparisons of tibiofemoral orientations and displacement using a femoral tracking device during early to mid stance of walking. Gait Posture. 2004; 19(1): 76‐84. [DOI] [PubMed] [Google Scholar]
- 15.Schwartz MH Rozumalski A A new method for estimating joint parameters from motion data. J biomech. 2005; 38(1): 107‐116. [DOI] [PubMed] [Google Scholar]
- 16.Segal NA Yack HJ Brubaker M Torner JC Wallace R Association of dynamic joint power with functional limitations in older adults with symptomatic knee osteoarthritis. Arch Phys Med Rehabil. 2009; 90(11): 1821‐1828. [DOI] [PMC free article] [PubMed] [Google Scholar]
- 17.Schwartz MH Rozumalski A A new method for estimating joint parameters from motion data. J Biomech. 2005; 38(1): 107‐116. [DOI] [PubMed] [Google Scholar]
- 18.Teran‐Yengle P Birkhofer R Weber MA Patton K Thatcher E Yack HJ Efficacy of gait training with real‐time biofeedback in correcting knee hyperextension patterns in young women. J Orthop Sports Phys Ther. 2011; 41(12): 948‐952. [DOI] [PubMed] [Google Scholar]
- 19.Bouillon LE Wilhelm J Eisel P Wiesner J Rachow M Hatteberg L Electromyographic assessment of muscle activity between genders during unilateral weight‐bearing tasks using adjusted distances. Int j sports phys ther. 2012; 7(6): 595. [PMC free article] [PubMed] [Google Scholar]
- 20.Hwang S Kim Y Kim Y Lower extremity joint kinetics and lumbar curvature during squat and stoop lifting. BMC musculoskelet disord. 2009; 10(1): 15. [DOI] [PMC free article] [PubMed] [Google Scholar]
- 21.Riemann BL Lapinski S Smith L Davies G Biomechanical analysis of the anterior lunge during 4 external‐load conditions. J Athl Train. 2012; 47(4): 372. [DOI] [PMC free article] [PubMed] [Google Scholar]
- 22.DeVita P Hortobágyi T Obesity is not associated with increased knee joint torque and power during level walking. J biomech. 2003; 36(9): 1355‐1362. [DOI] [PubMed] [Google Scholar]
- 23.Messier SP Beavers DP Loeser RF, et al. Knee joint loading in knee osteoarthritis: Influence of abdominal and thigh fat. Med Sci Sports Exerc. 2014; 46(9): 1677‐1683. [DOI] [PMC free article] [PubMed] [Google Scholar]
- 24.Escamilla RF Fleisig GS Lowry TM Barrentine SW Andrews JR A three‐dimensional biomechanical analysis of the squat during varying stance widths. Med Sci Sports Exerc. 2001; 33(6): 984‐998. [DOI] [PubMed] [Google Scholar]
- 25.Wallace DA Salem GJ Salinas R Powers CM Patellofemoral joint kinetics while squatting with and without an external load. J Orthop Sports Phys Ther. 2002; 32(4): 141‐148. [DOI] [PubMed] [Google Scholar]
- 26.Messier SP Gutekunst DJ Davis C DeVita P Weight loss reduces knee‐joint loads in overweight and obese older adults with knee osteoarthritis. Arthritis Rheum. 2005; 52(7): 2026‐2032. [DOI] [PubMed] [Google Scholar]