

Abstract
To investigate the variation in human cone photoreceptor packing density with various demographic or clinical factors, cone packing density was measured using a Canon prototype adaptive optics scanning laser ophthalmoscope and compared as a function of retinal eccentricity, refractive error, axial length, age, gender, race/ethnicity and ocular dominance. We enrolled 192 eyes of 192 subjects with no ocular pathology. Cone packing density was measured at three different retinal eccentricities (0.5 mm, 1.0 mm, and 1.5 mm from the foveal center) along four meridians. Cone density decreased from 32,200 to 11,600 cells/mm2 with retinal eccentricity (0.5 mm to 1.5 mm from the fovea, P < 0.001). A trend towards a slightly negative correlation was observed between age and density (r = −0.117, P = 0.14). There was, however, a statistically significant negative correlation (r = −0.367, P = 0.003) between axial length and cone density. Gender, ocular dominance, and race/ethnicity were not important determinants of cone density (all, P > 0.05). In addition, to assess the spatial arrangement of the cone mosaics, the nearest-neighbor distances (NNDs) and the Voronoi domains were analyzed. The results of NND and Voronoi analysis were significantly correlated with the variation of the cone density. Average NND and Voronoi area were gradually increased (all, P ≤ 0.001) and the degree of regularity of the cone mosaics was decreased (P ≤ 0.001) with increasing retinal eccentricity. In conclusion, we demonstrated cone packing density decreases as a function of retinal eccentricity and axial length and the results of NND and Voronoi analysis is a useful index for cone mosaics arrangements. The results also serve as a reference for further studies designed to detect or monitor cone photoreceptors in patients with retinal diseases.
Keywords: retina, human photoreceptor, adaptive optics scanning laser, ophthalmoscopy
1. Introduction
Adaptive optics scanning laser ophthalmoscopy (AOSLO) (Liang et al., 1997; Pircher et al., 2008; Roorda, 2000; Roorda et al., 2002) is now a useful imaging modality for visualizing cone photoreceptor cells in the living human retina. By compensating for the aberrations caused by irregularities of the eye’s optics, lateral resolutions in the order of 2 μm can be achieved, thereby allowing for the visualization of individual cone photoreceptors (Dubra and Sulai, 2011; Lombardo et al., 2012; Zhang and Roorda, 2006; Zhang et al., 2006).
AOSLO can provide direct measurements of how cone photo-receptors are affected by various diseases such as cone-rod dystrophy (Wolfing et al., 2006), epiretinal membrane (Ooto et al., 2011), central serous chorioretinopathy (Ooto et al., 2010), and retinitis pigmentosa (Duncan et al., 2007); however an understanding of the variation in cone packing density and the arrangement of the cone cells in normal eyes is necessary before patients with retinal diseases can be studied.
Recently, the normal human cone photoreceptor distributions have been evaluated by histologic (Curcio et al., 1990; Curcio and Sloan, 1992) or in vivo techniques (Li et al., 2010; Lombardo et al., 2012; Ooto et al., 2011; Song et al., 2011). In addition, the factors affecting cone packing density such as refractive error, age, or retinal eccentricity have also been studied by some AOSLO studies (Chui et al., 2008b; Song et al., 2011).
In the present study, we did in vivo studies of cone density on a very large sample size to obtain more accurate estimates of variability and better information about correlations with other factors.
2. Material and methods
2.1. Subjects
This research adheres to the tenets of the Declaration of Hel-sinki; informed consent was obtained from all subjects after the nature and possible complications of the study protocol were explained. The experiments were approved by the institutional review board and the ethics committee at Columbia University. We tested 192 healthy subjects (10–69 years, mean 33.6 years; SD 13.2; 104 men (54.3%) and 88 women (45.7%)). All subjects received a complete eye examination, and all had best corrected visual acuity of 20/20 or better. Only the right eye of each subject was included in the study, although the instruments can be routinely used for either eye. Spherical equivalent refractive errors (SE) were measured by Tonoref RKT-7000 autorefractometer (Nidek, Aichi, Japan) after pupil dilation with tropicamide (1.0%) and phenyl-ephrine (2.5%) and ranged from +2.5D to −9.8D (mean −1.5D; SD 2.7). Ocular biometry such as axial length, anterior chamber depth and keratometry was measured with a biometer (IOL master; Carl Zeiss Meditec, Dublin, CA). The axial lengths for the 192 eyes ranged from 22.0 to 28.4 mm (mean 24.4 mm; SD 1.41).
Subjects were classified into four groups based on age. Subjects in group 1 (n = 36, 18.8%) were from 10 to 20 years old, group 2 (n = 67, 34.9%) were from 21 to 34 years old, group 3 (n = 48, 25%) were from 35 to 49 years old, and group 4 (n = 41, 21.3%) aged 50 and over. All of the subjects were comprised of four different ethnic groups: Asian (n = 49, 25.5%); African (n = 22, 11.5%); Caucasian (n = 68, 35.4%), and Hispanic (n = 53, 27.6%). Ocular dominance was determined by the hole-in-the-paper test (Gandelman-Marton et al., 2010). For all participants tested, the two repeats of the test gave consistent results (163 dominant eyes (84.9%) and 29 non-dominant eyes (15.1%)). No statistically significant interactions between predictor variables were found (P > 0.2) for all tests for interaction. The demographic and clinical characteristics of the study subjects are summarized in Table 1.
Table 1.
Demographics and clinical characteristics.
| Values | |
|---|---|
| Total eye (No.) | 192 eyes of 192 subjects |
| Age, n(%): Mean ± SD | 33.6 ± 13.2 |
| Group 1(≤20 years) | 36(18.8%): 11.6 ± 2.354 |
| Group 2(21–34 years) | 67(34.9%): 26.4 ± 4.4 |
| Group 3(35–49 years) | 48(25%): 41.0 ± 3.9 |
| Group 4(≥50 yrs) | 41(21.3%): 56.0 ± 5.0 |
| Race/Ethnicity, n(%) | |
| Asian | 49(25.5%) |
| African | 22(11.5%) |
| Caucasian | 68(35.4%) |
| Hispanic | 53(27.6%) |
| Sex (M/F), n(%) | 104(54.3%)/88(45.7%) |
| Dominance(dominant/non-dominant), n(%) | 163(84.9%)/29(15.1%) |
| Axial length, Mean ± SD (range) | 24.4 ± 1.4 (22.01–28.43) |
| Keratometry, Mean ± SD (range) | 7.8±0.7 (0.1–8.5) |
| Anterior chamber depth, Mean ± SD (range) | 3.5 - 0.3 (2.72–4.39) |
| Spherical equivalent, Mean - SD (range) | −1.5 ± 2.7 (+2.50 to −9.8) |
2.2. Adaptive optics scanning laser ophthalmoscopy system
Components of the Canon prototype AOSLO system we used, include the AO system, light sources for the imaging and measurement of aberration, optical system, scanner, and data acquisition and image composition system. Our AO system contains a novel liquid-crystal spatial-light modulator (SLM) that is based on liquid crystal-on-silicon (LCOS) technology. The liquid-crystal SLM and the wavefront sensor are controlled by custom software to reduce wavefront errors.
The aberrant data from the natural optics is captured by a beacon light set at 760 nm (QSDM-760-2, QPhotonics, USA). The light source for high-resolution imaging is an 840 nm (S840-B-I-20, Superlum, Ireland) with 50 nm full width at half-maximum. The maximum power of the imaging light is 450 μW for 840 nm at φ5 μm and that of the beacon light is 40 μW for 760 nm at φ20 μm on the retina, which are below ANSI (American National Standards Institute) safety limits. The ANSI safety limits up to 8.33 h are for 840 nm: 0.743 mW and for 760 nm: 0.514 mW.
The imaging light through the fiber coupler and single-mode fiber was collimated and propagated along the telescope optics with some axially symmetric aspherical mirrors arranged off-axis to the dual LCOS-SLMs (X10468-02, Hamamatsu Photonics, Japan). The axially symmetric aspherical mirrors are used to reduce the aberration which is mainly composed of astigmatism. The LCOS-SLMs modulated the phase of the imaging light with respect to each polarization component on the basis of the wavefront aberration from the eye, measured by the beacon light and a Hart-mann–Shack wavefront sensor (HASO32-eye, Imagine Eyes, France).
The LCOS-SLMs have an active area of 16 mm × 12 mm and 792 × 600 pixels with the maximum stroke of 1λ (840 nm), and compensate high order aberration (Zernike polynomial 6th order or higher) and very large aberration with the phase wrapping method. The dual LCOS-SLMs are aligned such that the directions of the polarization components to be modulated are orthogonal to each other. As a result, the wavefront aberration composed of various polarization components is compensated. The closed loop is repeated until the root-mean-square (RMS) wavefront error fell below 0.1 μm at the subject’s pupil.
Our system can correct for weak astigmatism and sphere by the wavefront correcting systems, LCOS, however the ancillary lenses allow us to include subjects with a wider range of refractive errors and obtain good quality images. Focus lens (FL) and trial lens (TL) are a kind of correction optics for an eye with high refractive error. TL is a type of cylindrical lens that compensates for large amounts of astigmatism (from 0 to 5D), and is easily exchanged and rotated with respect to the optic axis. FL can compensate for defocusing ranging from −10 to +5D.
The light modulated with the LCOS-SLMs is diffusely reflected from the retina after being scanned by the X- and & Y-scanners and the scanning optics. An 8-kHz resonant scanner (CRS 8 kHz, GSI Group, USA) created vertical raster scans and a galvano scanner (VM500+, GSI Group, USA) scanned the imaging beam in the horizontal direction. The imaging areas are typically 1.2° × 1.2° (400 × 400 pixels, 32 frames per second; our equipment acquired images in both directions, the forward and backward paths) at the retina.
When the imaging light is scanned, the data acquisition system of the reflected light system is started. The light reflected from the retina is detected by the avalanche photodiode (C5460, Hamamatsu Photonics, Japan) and converted to an electrical signal. The electrical signal is amplified 10-fold by a commercial amplifier (SR560, Stanford Research Systems, USA). The AD (Analog/Digital converter) board simultaneously digitizes the signal from the amplifier and the synchronized signals of the scanners at the frequency of 15 MHz and 12 bits, and records the digitized data, for typically 2 s, to the hard disk of a personal computer.
2.3. Procedure
All AOSLO imaging sessions were conducted after pupils were dilated with 2.5% phenylephrine and 1.0% tropicamide. The pupil diameter measured under room illumination was equal to or greater than 6 mm before starting the experiment. In order to measure of cone packing density from the fovea (Ooto et al., 2011) to the parafovea (Curcio et al., 1990; Ooto et al., 2011), we measured cone packing density in areas 0.5 mm, 1.0 mm, and 1.5 mm from the center of the fovea and in each of 4 directions (superior, inferior, nasal, and temporal) at each distance. These distances were selected because the system does not clearly show individual cones at the center of the fovea, a limitation that has been reported for other similar systems (Huang et al., 2011; Ooto et al., 2010, 2011), although cones can be resolved at foveal eccentricities of >0.2 mm, Furthermore, because the acquisition of AOSLO images is dependent upon patient fixation, we found, from preliminary trials, that collecting a greater number of images at more gradual distances such as 0.5 mm, 0.6 mm, 0.7 mm, introduced error in our data due to poor/unsteady fixation. This could be attributed to patient fatigue and dry eyes. We thus thought that collecting images at 0.5 mm, 1.0 mm, and 1.5 mm was the best possible method of covering the greatest area while minimizing data collection errors.
A three-axis chin rest and forehead pad system was used to align the subject’s pupil to the imaging system’s pupil and the subject was instructed to fixate an internal fixation target. For each eye, AOSLO imaging was performed by shifting the focus from the retinal nerve fiber layer to the retinal pigment epithelium, and images that showed the cone mosaic were recorded. In our system, we took two different sized images (retinal videos) almost simultaneously at the same location. First, a 1.2° × 1.2° - sized image for cone cell analysis, second, a 6° × 6° – sized image for making a montage. After saving the pair of images, we changed the location of the internal fixation target in 0.5 mm increments from the fovea in each of 4 directions (superior, inferior, nasal, and temporal), and repeated the same procedures. Therefore we had 13 pairs of retinal videos including the foveal center. The acquired retinal videos were first manually reviewed frame-by-frame for poor quality frames that may result from data collection errors mentioned above. These frames were deleted before further post processing. Next, the image distortion generated by the sinusoidal scan pattern of the resonant scanner was corrected (Arathorn et al., 2007; Li et al., 2010).
Then, a montage of AOSLO images was created offline with 6° × 6° – sized images by selecting the area of interest and generating each image to be included in the montage from a single frame (see the left panel of Fig. 1; an example of one of the superior montage images extending from the foveal center to 1.5 mm eccentricity). Next, we matched 1.2° × 1.2° – sized images at the appropriate positions each on the 6° × 6° – sized images. (see Fig. 1 – white squares in the left panel and its magnified view in the right panel). In all cases, the approximate retinal location of the photoreceptor images relative to the foveal center was determined based on fundus images using common blood vessel patterns and the subject’s assumed locus of fixation.
Fig. 1.

Montage of high-resolution images obtained by AOSLO. Left: superior montage extending from foveal center (*) to peripheral region. Number 1, 2, and 3 indicate 0.5 mm eccentricity from the foveal center, 1.0 mm from the foveal center, and 1.5 mm from the foveal center, respectively. Right: Magnified view of the area matching the numbers beside the squares in the left panel. Cone photoreceptors are resolved at each retinal location showing a nearly continuous and regular cone mosaic pattern.
2.4. Estimation of the cone packing density
After creating the montage, we placed a 50 × 50 μm sampling window at each eccentricity separately on the montages and photoreceptor density, the number of cones divided by the area of retina sampled, was estimated by Photoreceptor analysis software version 2.1 (developed by Canon Inc., Tokyo, Japan) that automatically counts individual cones within a selected area in registered images. For example, when we wanted to analyze the cone density at 0.5 mm eccentricity in Fig. 1, we placed a 50 × 50 μm sampling window on white square number 1 so that the center of the sampling window was placed at 0.5 mm eccentricity and none were obscured by blood vessels. Next, we placed the sampling window on the following eccentricity and performed the analysis again. The steps of the identification of each cone cell by Photore-ceptor analysis software with noise reduction are described below.
1st step: Removing the high frequency noise from the original AOSLO Image with low – pass filter – Assuming that a cone photoreceptor cell is larger than 2 micron and that any intensity fluctuation higher than the frequency is considered as noise; 2nd step: Identifying possible cone candidates. – After 3 × 3 pixel matrix sweeps in the image, the central pixel is assumed to be the local maximum if the central pixel has the highest intensity. Those local maximum points become possible cone candidates; 3rd step: Correcting possible cone candidates by unifying – If the distance between two possible cone candidates is smaller than the minimum cone spacing (<2 micron), those two possible cone candidates are considered to belong to one cone. To unify those possible cone candidates, each possible cone candidate is expanded about 1 micron radius, and the unified region is considered as one. Then the center of the region is chosen as the cone candidate. According to above procedures, rods are ignored by the optical resolution, low pass filter and by the unification of more than 2 peaks within a distance of 2 micron as one cone; 4th step: Identifying cones from cone candidates – After reducing noise through step 1–step 3, we set the threshold to the average value of each image to reject the remaining noise. When the intensity of a cone candidate is lower than the threshold, those candidates are not considered to be cones.
Li and Roorda (2007) reported the use of an automated cone labeling process with an algorithm implemented in MATLAB (Mathworks Inc., Natick, MA) and a function from the MATLAB Image Processing Toolbox. For assessing the agreement between this algorithm and ours, we used both algorithms to identify and count the cones in the 1.2° × 1.2° retinal images in 20 randomly selected subjects and generated Bland – Altman plots (Bland and Altman, 1986) for the 3 eccentricities (see Fig. 2). Two different algorithms of cone cell count; the MATLAB Image Processing Toolbox (MATLAB) used by Li and Roorda (2007) and the Photore-ceptor analysis (PA) software of the present study were compared and we found there were no significant differences in the results of cone cell counting between the two algorithms, there was no consistent bias.
Fig. 2.

Agreement between two different algorithms used to identify and count cone cells. Bland – Altman plot to compare two different algorithms of cone cell count; the MATLAB Image Processing Toolbox (MATLAB) used by Li and Roorda (2007) and the Photoreceptor analysis (PA) software of the present study. On the x axis, the means of the cone cell counts of the two algorithms are shown for individual samples. On the y axis, the differences of the cone cell counts between PA and MATLAB are presented. 95% limits of agreement = mean difference ± 1.96SD [75.4, −154.1] in 0.5 mm eccentricity, [52.1, −114.2] in 1.0 mm eccentricity, [134.6, −194.0] in 1.5 mm eccentricity.
In our system, 1° from the foveal center is approximately 0.29 mm in the emmetropic eye and we compensated for the distance with the method devised by Li et al. (2010). This method compensates for differences in axial length, anterior chamber depth, and radius of curvature of the cornea.
2.5. Assessment of the spatial organization of the cone mosaics
To assess the spatial organization of the cone mosaics, nearest-neighbor distances (NNDs) (Ooto et al., 2011) were examined. In addition, the Voronoi domains in each cone mosaic, which provide a description of the orderliness with which the cone photoreceptor array tiles the retina (Baraas et al., 2007; Li and Roorda, 2007; Morgan et al., 2009), were measured automatically by using a custom imaging software. Voronoi domains were constructed for each cell by defining points in the regions that were closer to that cell than any other cell in the mosaic. The average NNDs were determined by calculating the average of the minimum distances from the center of that cell to the centers of every other cell in the mosaic. Expected NND was calculated for a perfectly triangularly-packed mosaic with a density equal to that in each location (Baraas et al., 2007; Morgan et al., 2009).
2.6. Statistical analysis
We performed a 1-way ANOVA for the statistical analysis of variation in cone cell packing density with retinal eccentricity and meridians. A Tukey post hoc test was applied to the significance level. To compare cone cell packing density between 4 age groups, we performed a 1-way ANOVA with Scheffe correction. We also calculated the Spearman rank correlation coefficient to determine associations between age group and cone packing density. A simple linear regression was used for analysis of variation of cone cell packing density with axial length. For comparing cone packing density between different sex, ocular dominance, and ethnic groups, an independent t-test, a Mann–Whitney test, and a 1-way ANOVA were performed, respectively. In addition, multiple linear regression analysis was used to analyze the effect of predictor variables on cone packing density. Finally, for the comparison of factors in relation to the spatial arrangement of cone mosaic, we used the 1-way ANOVA test with a Tukey post hoc analysis. All statistical evaluations were performed using the SPSS 17 statistic software program (SPSS Inc., Chicago, IL). A P value less than 0.05 was considered to be statistically significant.
3. Results
Cone packing density varied as expected with changes in retinal eccentricity (Table 2). We observed statistically significant decreases in cone packing density from 0.5 mm eccentricity (32,199 cells/mm2) to 1.5 mm eccentricity (11,597 cells/mm2) (all, P < 0.001). By meridional analysis, cone density also decreased along the same lines. Cone packing density was highest in areas closest to the fovea (0.5 mm eccentricity) and decreased along the four meridians (all, P < 0.001). When we compared cone packing density in 4 meridians at each eccentricity, no significant differences, with the exception of 1.0 mm eccentricity, were observed among the four different meridians. At 1.0 mm eccentricity, there were significant differences in cone packing density between the orthogonal meridians (P < 0.001; nasal, temporal > superior, inferior).
Table 2.
Variation of cone cell packing density (cells/mm2) with retinal eccentricity along four meridians.
| 0.5 mm eccentricity | 1.0 mm eccentricity | 1.5 mm eccentricity | P for eccentricitya | |
|---|---|---|---|---|
| Total | 32,199 ± 3288 | 19,328 ± 171 | 11,597 ± 1504 | <0.001 |
| Superior (S) | 32,047 ± 3930 | 18,602 ± 2319 | 11,462 ± 2322 | <0.001 |
| Temporal (T) | 32,187 ± 4261 | 19,629 ± 2523 | 11,475 ± 1855 | <0.001 |
| Inferior (I) | 32,105 ± 3906 | 18,908 ± 2634 | 11,677 ± 2348 | <0.001 |
| Nasal (N) | 32,456 ± 4328 | 20,172 ± 2551 | 11,772 ± 1744 | <0.001 |
| P for meridiansa | 0.815 | <0.001 | 0.459 | – |
| (N,T > S,I) | ||||
Data are expressed as means ± standard deviation.
1-way ANOVA.
In Table 3, we compared the cone packing densities of the 4 age groups. In all the age groups, cone packing density was high in 0.5 mm eccentricity and dropped rapidly with increasing retinal eccentricity. Between the 4 age groups, there was no significant difference in cone density from 0.5 mm eccentricity to 1.5 mm eccentricity (P = 0.830, 0.791, and 0.695, respectively). However, there was a slightly negative correlation between cone packing density and age group, although it did not reach statistical significance (r = −0.117, P = 0.140).
Table 3.
Variation of cone cell packing density (cells/mm2) with age.
| Group 1 (n = 36) ≤20 years |
Group 2 (n = 67) 21–34 years |
Group 3 (n = 48) 35–49 years |
Group 4 (n = 41) ≥50 years |
Pa | |
|---|---|---|---|---|---|
| 0.5 mm eccentricity | 32,554 ± 2884 | 32,224 ± 3233 | 32,206 ± 3454 | 31,814 ± 3566 | 0.830 |
| 1.0 mm eccentricity | 19,802 ± 1460 | 19,276 ± 1773 | 18,930 ± 1642 | 19,308 ± 1780 | 0.791 |
| 1.5 mm eccentricity | 11,249 ± 1967 | 11,588 ± 1266 | 11,637 ± 1403 | 11,895 ± 1495 | 0.695 |
Data are expressed as means ± standard deviation.
1-way ANOVA.
The relationship between cone packing density and axial length is shown in Fig. 3. There was a statistically significant negative correlation between axial length and cone packing density (decrease of 341 cell/mm2 per 1 mm increase in axial length, R2 = 0.135, P = 0.003). When analyzing the relationship between axial length and cone density for each eccentricity, statistical significance was observed only at 0.5 mm eccentricity (r = −0.382, P = 0.002). However, at 1.0 mm and 1.5 mm eccentricity, an inverse correlation was observed (r = −0.151 and −0.061, respectively) but these were not statistically significant (P = 0.230 and 0.630, respectively). As expected, a statistically significant correlation was found between the axial length and refractive error (r = −0.431, P < 0.001).
Fig. 3.
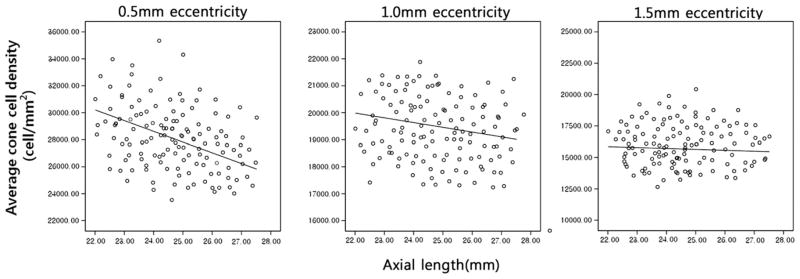
The relationship between cone packing density and axial length. There was a statistically significant negative correlation between axial length and cone packing density at 0.5 mm eccentricity (r = −0.382, P = 0.002). However, at 1.0 mm and 1.5 mm eccentricities, an inverse correlation was observed (r = −0.151 and −0.061, respectively) but these were not statistically significant (P = 0.230 and 0.630, respectively).
Table 4 is a summary of cone packing density differences between gender, ocular dominance, and race/ethnicity. No significant differences were observed in the present study (P = 0.919, 0.455, and 0.641 respectively).
Table 4.
Variation of average cone density across all eccentricities with gender, ocular dominance and race/ethnicity.
| No. of cases | Mean cone density (cells/mm2)a | P | 95% Confidence interval | ||
|---|---|---|---|---|---|
| Gender | Male | 104(54.3%) | 21,028 ± 1600 | 0.919 (T-test) | 20,689–21,367 |
| Female | 88(45.7%) | 21,056 ± 223 | 20,611–21,501 | ||
| Ocular dominance | Dominant | 163(84.9%) | 20,973 ± 1895 | 0.455 (Mann–Whitney test) | 20,614–21,387 |
| Non-dominant | 29(15.1%) | 21,489 ± 1870 | 20,666–21,473 | ||
| Race/Ethnicity | Asian | 49(25.5%) | 20,981 ± 1914 | 0.641 (1-way ANOVA) | 20,406–21,556 |
| African | 22(11.5%) | 21,088 ± 1506 | 20,254–21,922 | ||
| Caucasian | 68(35.4%) | 21,257 ± 1840 | 20,764–21,750 | ||
| Hispanic | 53(27.6%) | 20,822 ± 1548 | 20,770–21,312 |
Data are expressed as means ± standard deviation.
Table 5 shows a multiple linear regression of the effects of demographic and clinical variables on cone packing density. The multiple R2 for the model was 0.834 and both retinal eccentricity and axial length had a statistically significant negative correlation with cone packing density (P < 0.001 and 0.01, respectively). When comparing the amount of effect on cone packing density between eccentricity and axial length, eccentricity was found to be more associated with cone packing density than axial length (β = −0.910 vs. −0.076).
Table 5.
Multiple linear regression of demographic and clinical variables: Effect on cone cell packing density.
| Unstandardized coefficients
|
Standardized coefficients
|
t | P | ||
|---|---|---|---|---|---|
| B | Standard error | β | |||
| (Constant) | 35821.792 | 3270.733 | – | 10.983 | 0.000 |
| Eccentricity | −6294.729 | 203.702 | −0.910 | −30.902 | <0.001 |
| Axial length | −348.037 | 134.350 | −0.076 | −2.591 | 0.010 |
R2 = 0.834, F = 480.811, P < 0.001.
Table 6 shows the results of the Voronoi and nearest-neighbor analysis. We calculated the percent of hexagonal Voronoi polygons, Voronoi area, Voronoi sides, average NND, expected NND and the ratio of average NND to the expected NND (NND ratio) at each eccentricity using the Photoreceptor analysis software (Canon, Inc. Tokyo, Japan). As retinal eccentricity increased (from 0.5 mm toward 1.5 mm eccentricity), Voronoi area and average NND was also found to significantly increase (all, P < 0.001; 1.5 mm eccentricity > 1.0 mm eccentricity > 0.5 mm eccentricity). On the contrary, NND ratio, which indicates a degree of a perfectly triangular arrangement of the cone mosaic (Baraas et al., 2007), was high in 0.5 mm eccentricity and decreased with increasing retinal eccentricity (P < 0.001; 0.5,1.0 mm eccentricity > 1.5 mm eccentricity). In addition, percents of hexagonal Voronoi polygons were greater in 0.5 mm eccentricity than 1.0, 1.5 mm eccentricity (P = 0.001; 0.5 mm eccentricity > 1.0, 1.5 mm eccentricity) and Voronoi sides were closer to six at 0.5 mm eccentricity than at 1.0, 1.5 mm eccentricity (P < 0.001; 0.5 mm eccentricity > 1.0 mm eccentricity > 1.5 mm eccentricity, respectively) which indicating a regularly-packed triangular mosaic is decreased with increasing eccentricity. Fig. 4 also shows the proportional decrement of the six-sided mosaics with increasing eccentricity.
Table 6.
Voronoi and nearest-neighbor distances (NNDs) analysis.
| Location | Cone density (cones/mm2) | Hexagonal Voronoi polygons (%) | Voronoi area (μm2) | Voronoi sides (n) | Average NND (μm) | Expected NND (μm) | NND ratioa |
|---|---|---|---|---|---|---|---|
| 0.5 mm eccentricity | 32,199 ± 3288 | 47.45 ± 8.07 | 30.49 ± 4.14 | 5.94 ± 0.12 | 4.57 ± 0.24 | 6.44 ± 0.39 | 0.709 ± 0.03 |
| 1.0 mm eccentricity | 19,328 ± 171 | 46.60 ± 6.18 | 43.23 ± 4.04 | 5.83 ± 0.20 | 5.47 ± 0.03 | 7.74 ± 0.35 | 0.706 ± 0.03 |
| 1.5 mm eccentricity | 11,597 ± 1504 | 44.71 ± 4.91 | 51.75 ± 4.83 | 5.70 ± 0.49 | 5.98 ± 0.39 | 8.60 ± 0.39 | 0.695 ± 0.03 |
| Pb | <0.001 (1 > 2 > 3) | 0.001 (1 > 2,3) | <0.001 (3 > 2 > 1) | <0.001 (1 > 2 > 3) | <0.001 (3 > 2 > 1) | <0.001 (3 > 2 > 1) | <0.001 (1,2 > 3) |
Data are expressed as means ± standard deviation.
Average NND/Expected NND.
1-way ANOVA.
Fig. 4.

An example of an analysis of the regularity of the photoreceptor mosaic in subject number 14 who is a 34 year old, Asian male. The top three panels (A,B,C) show high-resolution images of cone mosaic patterns at 0.5 mm, 1.0 mm, and 1.5 mm from foveal center, respectively obtained with adaptive optic scanning laser ophthalmoscopy. The 3 bottom panels (D,E,F) show a color-coded version of the Voronoi domains of (A, B, C) respectively, and the color indicates the number of sides of each Voronoi polygon (magenta = 4, blue = 5, green = 6, yellow = 7, orange = 8, red = 9). The percent of the green polygons is highest at 0.5 mm eccentricity and lowest at 1.5 mm eccentricity (0.5 mm eccentricity: 58.2%, 1.0 mm eccentricity: 48.9%, and 1.5 mm eccentricity: 40.7%, respectively). In addition, we also find that the size of the each polygon increases with retinal eccentricity (0.5 mm eccentricity: 30.9 μm2, 1.0 mm eccentricity: 45.9 μm2, and 1.5 mm eccentricity: 53.5 μm2, respectively). From D to F, the points of the image boundary were ignored by custom software for removal of edge artifacts in the NND and Voronoi measures. (For interpretation of the references to color in this figure legend, the reader is referred to the web version of this article.)
4. Discussion
In the current study, we investigated the factors affecting human retinal cone photoreceptor density and the arrangement of cone mosaics from the fovea (a radius of 0.5 mm from the foveal center, which corresponded to the fixation point in most cases) (Ooto et al., 2011) to the parafovea (1.0–1.5 mm from the foveal center) (Curcio et al., 1990; Ooto et al., 2011) using a AOSLO with a dual LCOS-SLM. To our knowledge, this study documents the largest number of cases from a normal population with different age, axial length, refractive error, gender, race/ethnicity, and eye dominance.
In the present study, cone packing density varied as expected with changes in retinal eccentricity, systematically decreasing from the fovea toward the periphery in all subjects along all meridians. Our study found that average cone packing densities at 0.5, 1.0, 1.5 mm from the center of the fovea were approximately 32,199, 19,328 and 11,597 cones/mm2. The cone density found in the present study showed good correspondence to previous AOSLO studies. Chui et al. (2008a) found an average cone density of ~35,000 cones/mm2 at 0.5 mm, ~20,000 cones/mm2 at 1.0 mm, and ~12,000 cones/mm2 at 1.5 mm eccentricity from the fovea respectively. Ooto et al. (2010) reported approximately 33,000 and 14,000 cones/mm2 at distances 0.5 mm and 1.0 mm from the central fovea in their AOSLO study. Song et al. (2011) found a mean cone density of ~37,000 cones/mm2 at 0.5 mm and 19,000 cones/mm2 at 1.1 mm eccentricity respectively. Another AOSLO study of Chui et al. (2008b) also reported that cone density in human retina decreases from 30,000 to 15,000 cones/mm2 from distances of 0.5 mm to 1.5 mm from the foveal center. In addition, our finding is also similar to the results of a study utilizing histologic sections. Curcio et al. (1990) estimated, by examining 8 whole-mounted human retinas, the average densities to be approximately 37,000 and 16,000 cones/mm2 at distances 0.5 mm and 1.0 mm from the central fovea. Therefore, we suggest that the cone density found in the present study could be considered representative of a healthy population.
However, there is a point to note, since the measured cone density may differ slightly depending on the AOSLO system. When we compare our PA software with MATLAB used by Li and Roorda (2007) (see Fig. 2), we found that the number of cones counted by our PA software tends to be lower. In fact, it is difficult to distinguish whether our cone density was underestimated or whether Matlab software overestimated. There are some differences between two software programs in the methods used to identify the cones, for example, the characteristics of the noise reduction methods, the method used to set a position for counting the number of cone cells, and the threshold level used to detect cones. Although our cone densities corresponded well with previous AOSLO studies, one should be aware of the differences in the measurements of cone density between AOSLO systems.
We observed that a decrease of cone packing density from 0.5 mm eccentricity to 1.0 mm eccentricity was steeper than from 1.0 mm eccentricity to 1.5 mm eccentricity and the decline in cone density with retinal eccentricity is slightly steeper along the vertical than the horizontal meridian (Table 2). Curcio et al. (1990) demonstrated that the decline in cone density with retinal eccentricity is slightly steeper along the vertical (superior and inferior) than along the horizontal meridian (nasal and temporal) resulting in elliptical isodensity contours, which are referred to as horizontal cone streaks, and it becomes less precipitous in the peripheral retina. Chui et al. (2008b) also reported the horizontal cone streak in their AOSLO study. In our study, however, a statistically significant difference between orthogonal meridians was only found for 1.0 mm eccentricity. Why we observed the horizontal cone streak pattern only at 1.0 mm eccentricity is difficult to explain. However, the previous studies mentioned above have some limitations. In the study by Curcio et al. (1990) and by Chui et al. (2008b) there was no statistical analysis comparing the 4 meridians at each eccentricity. It is assumed that this is because their sample sizes were too small to perform a statistical analysis. Therefore, it is difficult to know whether the difference between the meridians was significant. There is an AOSLO study by Song et al. (2011) that reported finding a statistically significant difference in cone density between the orthogonal meridians. However, they only compared cone density across all eccentricities and did not perform a statistical analysis for each eccentricity. In summary, further evaluation may be required to clarify the topographic pattern of cone cell density.
There is disagreement in the literature concerning the effects of age on cone packing density. Gao and Hollyfield (1992) and Curcio et al. (1993) did not find a decrease in cone density, although variability changed with age. In contrast, Song et al. (2011) demonstrated a negative relationship between age and cone density. In our study, there was no significant difference in cone packing density between the 4 age groups at all eccentricities (Table 3). However, a slightly negative correlation between the age group and density was observed but it did not reach a statistical significance (r = −0.117, p = 0.14). Our results may be explained by the study by Song et al. (2011) which reported that cone packing density in the living human retina decreases as a function of age with the largest difference being within the foveal center and that a significant decrease in cone photoreceptor packing density occurred primarily at distances less than 0.5 mm from the center of the fovea; beyond that eccentricity, older subjects did not differ from the younger subjects. We did not measure cone density within 0.5 mm from the foveal center and this may explain the lack of significant differences in cone density between the four age groups. In addition, it could be inferred that cone density loss with age is influenced by a subtle age related retinal change not detected by fundoscopic examination or by assessing visual acuity. It is possible that we and Song et al. (2011) did not entirely exclude subtle retinal pathology because both studies did not include techniques such as optical coherence tomography and/or electroretinography as part of the screening procedure. The disparity between the two studies could be derived from the difference in the percentage of subjects with subtle retinal change. Further evaluation is needed to clarify the relationship between age and foveal cone packing density.
Axially myopic eyes are larger than emmetropic eyes due to the elongation of the vitreous chamber (Bullimore et al., 1992; Grosvenor and Scott, 1993; 1994; McBrien and Millodot, 1987). As expected, there could be large individual differences due to eye size because longer eye would require the same number of photore-ceptors in the retina to tile over a larger surface area (Chui et al., 2008b; Li et al., 2010). Chui et al. (2008b) reported cone packing density variations with refractive error. They found that cone photoreceptor packing density (cells/mm2) was significantly lower in myopic eyes than in emmetropic eyes at both 0.9–1.0 mm and 1.8–2.0 mm eccentricity from the foveal center.
In the current study, we found a statistically significantly negative correlation between axial length and average cone packing density. However, we observed that the effect of axial length on cone density is variable with retinal eccentricity; this is not completely in agreement with the study of Chui et al. (2008b). When analyzing the relationship between axial length and cone density for the different eccentricities, statistical significance was only observed at 0.5 mm eccentricity (r = −0.382, p = 0.002) although there was a trend toward an inverse correlation at 1.0 mm eccentricity (r = −0.151, p = 0.230) and 1.5 mm eccentricity (r = −0.061, p = 0.630). In addition, we also found that the gradient between axial length and cone density is progressively flattened with increasing eccentricity (Fig. 3). According to Curcio et al. (1990) and Curcio and Sloan (1992), the variation of cone packing density is highest at the foveal center and much lower at distances farther away. However, we found no significant difference of variability in cone packing density at all retinal eccentricities. On a proportional basis, the coefficient of variation (CV: standard deviation/mean) (Curcio et al., 1990; Song et al., 2011) is 11.7% at 0.5 mm eccentricity, 8.9% at 1.0 mm eccentricity, and 9.6% at 1.5 mm eccentricity. An F-test was used to determine the significance of this observed variation of cone density at different retinal eccentricities, but the difference was not statistically significant in our study. Therefore, we assumed that the effect of retinal eccentricity on the relationship between cone packing density and axial length is not affected by inter-subject variability.
Other demographic and clinical factors, such as gender, ocular dominance, and race/ethnicity were not found to be determinants of cone packing density (Table 4). Thus, these factors probably need not be considered when determining the constitution of normal cone packing density. However, because the present AOSLO normative database had relatively few subjects with non-dominant eyes, and we did not investigate the racial differences in retinal anatomy (e.g. foveal pit morphology, retinal thickness), so conclusions about ocular dominance or racial differences must be interpreted with caution.
Among the various demographic and clinical variables, only retinal eccentricity and axial length were significantly associated with measured cone packing density when using a multiple linear regression analysis in our present study (Table 5). Although the effect of axial length is considerably smaller than retinal eccentricity on cone packing density (β = −0.076 vs. −0.910), these findings are presented with the caveat that axial length consideration still remains a crucial factor in the measurement of cone packing density. Our findings accentuate the accommodation of both eccentricity and axial length differences in order to accurately assess the condition of normal subjects versus subjects with retinal diseases using AOSLO results.
We calculated the Voronoi area, Voronoi sides, percent of hexagonal Voronoi polygons, average NND, expected NND, and NND ratio for assessing the spatial organization of the cone mosaics (Baraas et al., 2007; Li and Roorda, 2007; Morgan et al., 2009; Ooto et al., 2011). It is reported that an analysis of cone mosaic regularity is necessary for disease diagnosis. For example, Baraas et al. (2007), using Voronoi domain analysis, found a significant difference in the regularity of a tritan cone mosaic, even though the total cone density was considered normal. In addition, Ooto et al. (2011) found cone cell structural abnormalities, using Voronoi and NNDs analysis with AOSLO, in eyes with an idiopathic epiretinal membrane compared to normal controls. Regularity metrics of the cone mosaic may prove more useful for early disease diagnosis than simply cone cell density alone. Therefore, it is worthwhile to investigate cone photoreceptor mosaics in normal subjects.
Previously, Curcio et al. (1990) reported the eccentricity-dependent variations in photoreceptor size. When the retinal eccentricity increases cone cell size increases as well with a loss in regular triangular packing in the cone mosaic. Furthermore, Chui et al. (2008a, 2008b) also supported the results indicating that the human cone photoreceptors are arranged hexagonally near the fovea with the degree of regularity decreasing as the retinal eccentricity increases, perhaps due to rod intrusion into the photoreceptor sampling array beginning at the eccentricity of 0.7°.
We believe that our Voronoi and NNDs analysis are in agreement with the findings of these studies. As the retinaleccentricity increases, we could observe that the Voronoi area and average NND were significantly increased (p < 0.001, 1.5 mm eccentricity > 1.0 mm eccentricity > 0.5 mm eccentricity, both) (Table 6) which imply the increment of the cone cell size and decrement of the cone density with retinal eccentricity, respectively. In addition, the degree of regularity of the cone mosaics which inferred by the indexes, which are a percent of hexagonal Voronoi polygons, Voronoi sides and NND ratio, is decreased with increasing eccentricity (Table 6 and Fig. 4).
5. Conclusion
In summary, we demonstrated the demographic and clinical factors that influence cone packing density and provide an analysis of the spatial arrangement of human photoreceptor cone cells in a relatively large population at different retinal eccentricities, as a function of age, axial length, refractive error, sex, race/ethnicity, and eye dominance by using an AOSLO. We found that cone packing density decreases as a function of retinal eccentricity and axial length. However, the effect of age on cone density was not significant in the present study. In addition, the spatial arrangement assessment with NND and Voronoi analysis is in agreement with a previous histologic study (Curcio et al., 1990) and might be a good index for cone mosaics arrangements. We anticipate our results will allow us to better understand the normal retina and can act as a reference for further experiments in detecting and monitoring retinal diseases and for the development of a normative database of individual variations in the human retina.
Acknowledgments
Financial support
No authors have any financial support to disclose.
We would like to express our sincere gratitude to those who have contributed to our research at Columbia University Medical Center; we especially thank to the members of the Edward S. Harkness Eye Institute for their unending support, guidance, and encouragement throughout the development of this study. Also, we are so deeply thankful to Canon Company (Japan) for design and manufacture and installation of our AOSLO in Columbia University Medical Center.
Footnotes
Conflicts of interest
No authors have any financial/conflicting interests to disclose.
References
- Arathorn DW, Yang Q, Vogel CR, Zhang Y, Tiruveedhula P, Roorda A. Retinally stabilized cone-targeted stimulus delivery. Opt Express. 2007;15:13731–13744. doi: 10.1364/oe.15.013731. [DOI] [PubMed] [Google Scholar]
- Baraas RC, Carroll J, Gunther KL, Chung M, Williams DR, Foster DH, Neitz M. Adaptive optics retinal imaging reveals S-cone dystrophy in tritan color-vision deficiency. J Opt Soc Am A Opt Image Sci Vis. 2007;24:1438–1447. doi: 10.1364/josaa.24.001438. [DOI] [PMC free article] [PubMed] [Google Scholar]
- Bland JM, Altman DG. Statistical methods for assessing agreement between two methods of clinical measurement. Lancet. 1986;1:307–310. [PubMed] [Google Scholar]
- Bullimore MA, Gilmartin B, Royston JM. Steady-state accommodation and ocular biometry in late-onset myopia. Doc Ophthalmol. 1992;80:143–155. doi: 10.1007/BF00161240. [DOI] [PubMed] [Google Scholar]
- Chui TY, Song H, Burns SA. Adaptive-optics imaging of human cone photoreceptor distribution. J Opt Soc Am A Opt Image Sci Vis. 2008a;25:3021–3029. doi: 10.1364/josaa.25.003021. [DOI] [PMC free article] [PubMed] [Google Scholar]
- Chui TY, Song H, Burns SA. Individual variations in human cone photoreceptor packing density: variations with refractive error. Invest Oph-thalmol Vis Sci. 2008b;49:4679–4687. doi: 10.1167/iovs.08-2135. [DOI] [PMC free article] [PubMed] [Google Scholar]
- Curcio CA, Millican CL, Allen KA, Kalina RE. Aging of the human photoreceptor mosaic: evidence for selective vulnerability of rods in central retina. Invest Ophthalmol Vis Sci. 1993;34:3278–3296. [PubMed] [Google Scholar]
- Curcio CA, Sloan KR. Packing geometry of human cone photoreceptors: variation with eccentricity and evidence for local anisotropy. Vis Neurosci. 1992;9:169–180. doi: 10.1017/s0952523800009639. [DOI] [PubMed] [Google Scholar]
- Curcio CA, Sloan KR, Kalina RE, Hendrickson AE. Human photoreceptor topography. J Comp Neurol. 1990;292:497–523. doi: 10.1002/cne.902920402. [DOI] [PubMed] [Google Scholar]
- Dubra A, Sulai Y. Reflective afocal broadband adaptive optics scanning ophthalmoscope. Biomed Opt Express. 2011;2:1757–1768. doi: 10.1364/BOE.2.001757. [DOI] [PMC free article] [PubMed] [Google Scholar]
- Duncan JL, Zhang Y, Gandhi J, Nakanishi C, Othman M, Branham KE, Swaroop A, Roorda A. High-resolution imaging with adaptive optics in patients with inherited retinal degeneration. Invest Ophthalmol Vis Sci. 2007;48:3283–3291. doi: 10.1167/iovs.06-1422. [DOI] [PubMed] [Google Scholar]
- Gandelman-Marton R, Arlazoroff A, Dvir Z. Ocular dominance and balance performance in healthy adults. Gait Posture. 2010;31:394–396. doi: 10.1016/j.gaitpost.2009.11.015. [DOI] [PubMed] [Google Scholar]
- Gao H, Hollyfield JG. Aging of the human retina. Differential loss of neurons and retinal pigment epithelial cells. Invest Ophthalmol Vis Sci. 1992;33:1–17. [PubMed] [Google Scholar]
- Grosvenor T, Scott R. Three-year changes in refraction and its components in youth-onset and early adult-onset myopia. Optom Vis Sci. 1993;70:677–683. doi: 10.1097/00006324-199308000-00017. [DOI] [PubMed] [Google Scholar]
- Grosvenor T, Scott R. Role of the axial length/corneal radius ratio in determining the refractive state of the eye. Optom Vis Sci. 1994;71:573–579. doi: 10.1097/00006324-199409000-00005. [DOI] [PubMed] [Google Scholar]
- Huang H, Inoue T, Tanaka H. Stabilized high-accuracy correction of ocular aberrations with liquid crystal on silicon spatial light modulator in adaptive optics retinal imaging system. Opt Express. 2011;19:15026–15040. doi: 10.1364/OE.19.015026. [DOI] [PubMed] [Google Scholar]
- Li KY, Roorda A. Automated identification of cone photoreceptors in adaptive optics retinal images. J Opt Soc Am A Opt Image Sci Vis. 2007;24:1358–1363. doi: 10.1364/josaa.24.001358. [DOI] [PubMed] [Google Scholar]
- Li KY, Tiruveedhula P, Roorda A. Intersubject variability of foveal cone photoreceptor density in relation to eye length. Invest Ophthalmol Vis Sci. 2010;51:6858–6867. doi: 10.1167/iovs.10-5499. [DOI] [PMC free article] [PubMed] [Google Scholar]
- Liang J, Williams DR, Miller DT. Supernormal vision and high-resolution retinal imaging through adaptive optics. J Opt Soc Am A Opt Image Sci Vis. 1997;14:2884–2892. doi: 10.1364/josaa.14.002884. [DOI] [PubMed] [Google Scholar]
- Lombardo M, Lombardo G, Ducoli P, Serrao S. Adaptive optics photore-ceptor imaging. Ophthalmology. 2012;119:1498–1498. e2. doi: 10.1016/j.ophtha.2012.03.019. [DOI] [PubMed] [Google Scholar]
- McBrien NA, Millodot M. A biometric investigation of late onset myopic eyes. Acta Ophthalmol (Copenh) 1987;65:461–468. doi: 10.1111/j.1755-3768.1987.tb07024.x. [DOI] [PubMed] [Google Scholar]
- Morgan JI, Dubra A, Wolfe R, Merigan WH, Williams DR. In vivo autofluorescence imaging of the human and macaque retinal pigment epithelial cell mosaic. Invest Ophthalmol Vis Sci. 2009;50:1350–1359. doi: 10.1167/iovs.08-2618. [DOI] [PMC free article] [PubMed] [Google Scholar]
- Ooto S, Hangai M, Sakamoto A, Tsujikawa A, Yamashiro K, Ojima Y, Yamada Y, Mukai H, Oshima S, Inoue T, Yoshimura N. High-resolution imaging of resolved central serous chorioretinopathy using adaptive optics scanning laser ophthalmoscopy. Ophthalmology. 2010;117:1800–1809. 1809.e1–2. doi: 10.1016/j.ophtha.2010.01.042. [DOI] [PubMed] [Google Scholar]
- Ooto S, Hangai M, Takayama K, Sakamoto A, Tsujikawa A, Oshima S, Inoue T, Yoshimura N. High-resolution imaging of the photoreceptor layer in epiretinal membrane using adaptive optics scanning laser ophthalmoscopy. Ophthalmology. 2011;118:873–881. doi: 10.1016/j.ophtha.2010.08.032. [DOI] [PubMed] [Google Scholar]
- Pircher M, Zawadzki RJ, Evans JW, Werner JS, Hitzenberger CK. Simultaneous imaging of human cone mosaic with adaptive optics enhanced scanning laser ophthalmoscopy and high-speed transversal scanning optical coherence tomography. Opt Lett. 2008;33:22–24. doi: 10.1364/ol.33.000022. [DOI] [PMC free article] [PubMed] [Google Scholar]
- Roorda A. Adaptive optics ophthalmoscopy. J Refract Surg. 2000;16:S602–S607. doi: 10.3928/1081-597X-20000901-23. [DOI] [PubMed] [Google Scholar]
- Roorda A, Romero-Borja F, Donnelly W, III, Queener H, Hebert T, Campbell M. Adaptive optics scanning laser ophthalmoscopy. Opt Express. 2002;10:405–412. doi: 10.1364/oe.10.000405. [DOI] [PubMed] [Google Scholar]
- Song H, Chui TY, Zhong Z, Elsner AE, Burns SA. Variation of cone photoreceptor packing density with retinal eccentricity and age. Invest Oph-thalmol Vis Sci. 2011;52:7376–7384. doi: 10.1167/iovs.11-7199. [DOI] [PMC free article] [PubMed] [Google Scholar]
- Wolfing JI, Chung M, Carroll J, Roorda A, Williams DR. High-resolution retinal imaging of cone-rod dystrophy. Ophthalmology. 2006;113:1019, e1. doi: 10.1016/j.ophtha.2006.01.056. [DOI] [PubMed] [Google Scholar]
- Zhang Y, Poonja S, Roorda A. MEMS-based adaptive optics scanning laser ophthalmoscopy. Opt Lett. 2006;31:1268–1270. doi: 10.1364/ol.31.001268. [DOI] [PubMed] [Google Scholar]
- Zhang Y, Roorda A. Evaluating the lateral resolution of the adaptive optics scanning laser ophthalmoscope. J Biomed Opt. 2006;11:014002. doi: 10.1117/1.2166434. [DOI] [PubMed] [Google Scholar]