

This crystallization and data collection are reported for a complex of Reb1 bound to Ter3 DNA.
Keywords: protein–DNA complex, Reb1, transcription termination, eukaryotic, RNA Pol I
Abstract
The Reb1 protein from Schizosaccharomyces pombe is a member of a family of proteins that control programmed replication termination and/or transcription termination in eukaryotic cells. These events occur at naturally occurring replication fork barriers (RFBs), where Reb1 binds to termination (Ter) DNA sites and coordinates the polar arrest of replication forks and transcription approaching in opposite directions. The Reb1 DNA-binding and replication-termination domain was expressed in Escherichia coli, purified and crystallized in complex with a 26-mer DNA Ter site. Batch crystallization under oil was required to produce crystals of good quality for data collection. Crystals grew in space group P21, with unit-cell parameters a = 68.9, b = 162.9, c = 71.1 Å, β = 94.7°. The crystals diffracted to a resolution of 3.0 Å. The crystals were mosaic and required two or three cycles of annealing. This study is the first to yield structural information about this important family of proteins and will provide insights into the mechanism of replication and transcription termination.
1. Introduction
Correct DNA-replication termination is critical for cell viability (Boddy & Russell, 2001 ▶; Lambert & Carr, 2005 ▶). In prokaryotic systems, termination of DNA replication occurs in a polar mode through the binding of replication-termination proteins to specific sites called replication termini (Bastia & Mohanty, 1996 ▶; Bastia et al., 2008 ▶). In contrast, eukaryotic replication termination can take place through different mechanisms that reflect the complexity of the eukaryotic genome. Physiologically programmed polar replication termination in eukaryotes is important to coordinate transcription and replication centers during cell division (Bastia & Mohanty, 1996 ▶; Krings & Bastia, 2006 ▶; Kaplan & Bastia, 2009 ▶). The process is limited to certain regions of the chromosome such as the nontranscribed spaces of ribosomal DNA. In these regions, terminator proteins bind specifically to DNA Ter sites and arrest replication forks approaching in one direction and transcription from the opposite direction (Brewer & Fangman, 1988 ▶; Sanchez et al., 1998 ▶). In Schizosaccharomyces pombe, the terminator protein Reb1 binds to Ter2 and Ter3 sites and promotes replication termination through a mechanism that involves chromosome kissing (Singh et al., 2010 ▶; Bastia & Singh, 2011 ▶). Reb1 is a 504-residue protein with a putative N-terminal dimerization domain and a C-terminal DNA-binding domain that is necessary and sufficient to bind Ter3 DNA and promote fork arrest (Biswas & Bastia, 2008 ▶). Reb1 belongs to the Myb family of proteins, which contain two Myb/SANT domains that are known to bind to the major groove of DNA (Krings & Bastia, 2005 ▶). In addition, Reb1, like its human homologue TTF-I, can also promote transcription termination of RNA Pol I (Längst et al., 1997 ▶; Zhao et al., 1997 ▶). To understand the detailed molecular mechanism of fork arrest and replication termination in eukaryotes, we here report the crystallization of Reb1 bound to a Ter3 DNA sequence.
2. Materials and methods
2.1. Macromolecule production
The cDNA coding for N-terminally truncated Reb1 (residues 146–504) was amplified using the polymerase chain reaction and cloned into the NdeI and XhoI restriction sites of the pET-15b vector (Novagen). The expression plasmid was used to transform Escherichia coli strain BL21(DE3)pLysS cells. A single colony was picked and used to inoculate 100 ml Luria–Bertani medium containing 25 g ml−1 chloramphenicol and 100 g ml−1 ampicillin. Cells were incubated at 37°C and 250 rev min−1 in a shaker for ∼16 h. About 10 ml of inoculum was transferred to 1 l Luria–Bertani medium containing 100 g ml−1 ampicillin and incubated at 37°C until an OD600 nm of 0.6 was reached. At this point, the temperature was lowered to 18°C and IPTG was added to a final concentration of 1 mM and incubated for ∼18 h. The bacterial culture was harvested by centrifugation at 6000 rev min−1 for 15 min, resuspended in 5 ml osmotic buffer [50 mM HEPES pH 7.9, 20%(w/v) sucrose, 1 mM EDTA] per gram (wet weight) of pellet and centrifuged at 7500g for 30 min. The pellets were resuspended in 5 mM MgSO4 [3 ml per gram (wet weight) of pellet] and centrifuged at 4500g for 30 min. The pellets were stored at −80°C. For purification, the pellets were thawed and resuspended in SP Sepharose binding buffer (20 mM HEPES pH 7.0, 100 mM NaCl, 1 mM TCEP, 1 mM EDTA, 10% glycerol). The resuspended cells were ultrasonicated on ice using rounds of 10 s at 95% power with 20 s between each sonication round for 2 min. The resulting cell lysate was centrifuged at 17 000 rev min−1 for 30 min at 4°C. The supernatant was filtered using a 0.22 µm filter prior to loading onto a 5 ml SP Sepharose Fast Flow column (GE Healthcare) previously equilibrated with SP Sepharose binding buffer. The fusion protein was eluted with an increasing gradient (0–100%) of SP Sepharose elution buffer [20 mM HEPES pH 7.0, 1 M NaCl, 1 mM TCEP, 1 mM EDTA, 10%(v/v) glycerol]. The protein fractions were pooled and then loaded onto a 5 ml Ni–NTA Fast Flow (Qiagen) column pre-equilibrated with buffer A [20 mM Tris–HCl pH 7.9, 500 mM NaCl, 5 mM TCEP, 0.2%(w/v) CHAPS, 1 mM EDTA, 10%(v/v) glycerol, 5 mM imidazole]. The fusion protein was eluted using a stepwise gradient (5 and 30%) of buffer B [20 mM Tris–HCl pH 7.9, 500 mM NaCl, 5 mM TCEP, 0.2%(w/v) CHAPS, 1 mM EDTA 10%(v/v) glycerol, 1 M imidazole]. The fractions were pooled and loaded onto a HiPrep 26/10 Desalting (GE Healthcare) column pre-equilibrated with thrombin buffer [20 mM Tris–HCl pH 8.0, 200 mM NaCl, 10%(v/v) glycerol] for buffer exchange. The N-terminal His6 tag was proteolytically cleaved from the fusion protein by incubation with human thrombin (Haematologic Technologies Inc.; one unit of thrombin per 5 mg of recombinant protein) at 4°C for ∼16 h. The His6-tag cleavage efficiency was checked on a 12% SDS–PAGE gel. Inhibition of thrombin was carried out using benzidine–HCl at a final concentration of 1 mM. The His6 tag-free protein was concentrated to a final volume of ∼2.5 ml using an Amicon Ultra concentrator with a 10 kDa molecular-weight cutoff (Millipore) and loaded onto a HiLoad 16/60 Superdex 75 prep-grade (GE Healthcare) column pre-equilibrated with size-exclusion buffer (20 mM Tris–HCl pH 7.5, 200 mM NaCl, 5 mM TCEP, 1 mM EDTA, 10% glycerol). The elution profile is shown in Fig. 1 ▶(a). The fractions with target protein were pooled, concentrated to ∼5 mg ml−1 and stored at −80°C. The Reb1 protein was >98% pure as shown by SDS–PAGE (Fig. 1 ▶ b). The Reb1 concentration was estimated using the calculated molar extinction coefficient as computed from the Reb1 polypeptide sequence with the ExPASy ProtParam tool. A series of DNA sites were designed based on the minimal Ter3 DNA site as determined in previous studies and are shown in Supplementary Fig. S1 (Biswas & Bastia, 2008 ▶). Individual DNA strands (Integrated DNA Technology) were purified on a Mono Q 5/50 GL column (GE Healthcare) based on a protocol described elsewhere (Aggarwal, 1990 ▶). In brief, the column was pre-equilibrated with Q binding buffer (10 mM NaOH pH 12, 100 mM NaCl). DNA was eluted with an increasing gradient (0–100%) of Q elution buffer (10 mM NaOH pH 12, 1 M NaCl). The fractions were pooled and loaded onto an Econo-Pac 10DG Desalting column (Bio-Rad) pre-equilibrated with deionized water. The oligomer was eluted with 4 ml deionized water. The collected DNA was flash-frozen in liquid nitrogen and lyophilized. Lyophilized complementary DNA strands were resuspended in TES buffer (10 mM Tris–HCl pH 8.0, 1 mM EDTA, 50 mM NaCl), mixed in an equimolar ratio and annealed. The annealing reaction involved subjecting mixed strands to 94°C for 7 min and then gradually cooling the sample to room temperature. We performed fluorescence anisotropy experiments to determine the dissociation constant using fluorescein-labeled Ter3 DNA. The Ter3 site (5 nM) was titrated with the protein and a dissociation constant of 34 nM was obtained (Fig. 1 ▶ c). Macromolecule-production information is summarized in Table 1 ▶.
Figure 1.

Reb1 purification. (a) Gel-filtration elution profile of Reb1 on Superdex 75 16/60 in buffer consisting of 20 mM Tris–HCl pH 7.5, 200 mM NaCl, 5 mM TCEP, 1 mM EDTA, 10% glycerol. (b) 12% SDS–PAGE of pooled fractions stained with Coomassie Blue. Lane 1, molecular-weight markers (labeled in kDa); lane 2, Reb1. (c) Binding isotherm of the fluorescein-labeled Ter3 DNA site at 5 nM with Reb1. Reactions were performed at 20°C in an ISS PC1 fluorimeter. Data were analyzed using a single binding-site model using nonlinear fitting with Origin.
Table 1. Macromolecule-production information.
| Source organism | S. pombe |
| DNA source | S. pombe |
| Forward primer | AAAAAAACATATGGATCCATTTTTGAAAGGTAGTGCTAGATCGAC |
| Reverse primer | AAAACTCGAGTTAATTGGAGAATCCAGAAAGTACCACTTTAAAGTC |
| Expression vector | pET-15b |
| Expression host | E. coli (DE3) pLysS |
| Complete amino-acid sequence of the construct produced | MGSSHHHHHHSSGLVPRGSHMDPFLKGSARWTAEHWDYLERRMQNFCQTYSLDHTQVADSLHEKRLHGPLSSLVKLLVQEMPSFTRRTILRHLRALYNIPGYEKYSRKNSSGRGDFGVQETAIISQEVHNFIMDQGWSEYQFCNQIWAGKCPKTIRMFYSNLYKKLSHRDAKSIYHHVRRAYNPFEDRCVWSKEEDEELRKNVVEHGKCWTKIGRKMARMPNDCRDRWRDVVRFGDKLKRNAWSLEEETQLLQIVAELRNREDLSSDINWTLVAQMLGTRTRLQCRYKFQQLTKAASKFELQENVWLLERIYDSLLNNGGKIHWENIVKEANGRWTRDQMLFQFINLKKMIPSYDNLPLLEATKSAIDDFKVVLSGFSN |
| Molecular weight, Reb1 (Da) | 43113.2 |
| Molecular weight, complex (Da) | 71219.8 |
2.2. Crystallization
The Reb1–Ter3 DNA complex was produced using a 1:1.2 protein:DNA molar ratio (5 mg ml−1 Reb1 stock). The complex was incubated at room temperature for 20 min and then concentrated using Vivaspin microcentrifuge concentrators (Sartorius Biotech) to one third of the original volume (theoretically three times the concentration; i.e. 15 mg ml−1). The corresponding absorbance A 260 of the complex was ∼82–85 using a NanoDrop spectrophotometer. Crystallization attempts were initially made by screening all conditions from Crystal Screen, Crystal Screen 2, Natrix (Hampton Research) and Wizard I, II and III (Emerald Bio) using the hanging-drop vapor-diffusion technique in a 24-well format crystallization plate (Hampton Research). The final volume of the drop was 2 µl, with 1 µl each of reservoir solution and protein–DNA complex; the total reservoir volume was 500 µl and the tray was incubated at a constant temperature of 16°C. The length of the DNA was varied from 20 to 28 bp with different overhangs. Initial crystals were obtained with a 21 bp DNA but only diffracted to ∼7–9 Å resolution (Supplementary Table S1). Further optimization of the DNA sites included shifting the core binding site by a few nucleotides in either direction. This strategy resulted in better diffracting crystals with a 26 bp DNA. However, the crystals grew very rapidly, appearing after ∼1 h; they were very small and grew in bunches. To slow the crystallization process, we varied the concentration of both the precipitant and the complex and lowered the crystallization temperature to 4°C, but these changes did not improve the quality of the crystals. Only batch crystallization under oil was able to generate single good-sized crystals. In brief, Reb1–Ter3 complex crystals were grown under oil using batch crystallization trays from Hampton Research. 1 µl complex solution was mixed with 1 µl precipitant solution and the mixture was pipetted into a tray that had previously been layered with paraffin oil. The trays were incubated at 20°C. Under these conditions crystals grew to maximum dimensions of 200 × 150 × 75 µm within 1–2 d (Fig. 2 ▶ a). The crystals were screened for the presence of both protein and DNA by polyacrylamide gel electrophoresis as shown in Figs. 2 ▶(b) and 2 ▶(c). Crystallization information is summarized in Table 2 ▶.
Figure 2.
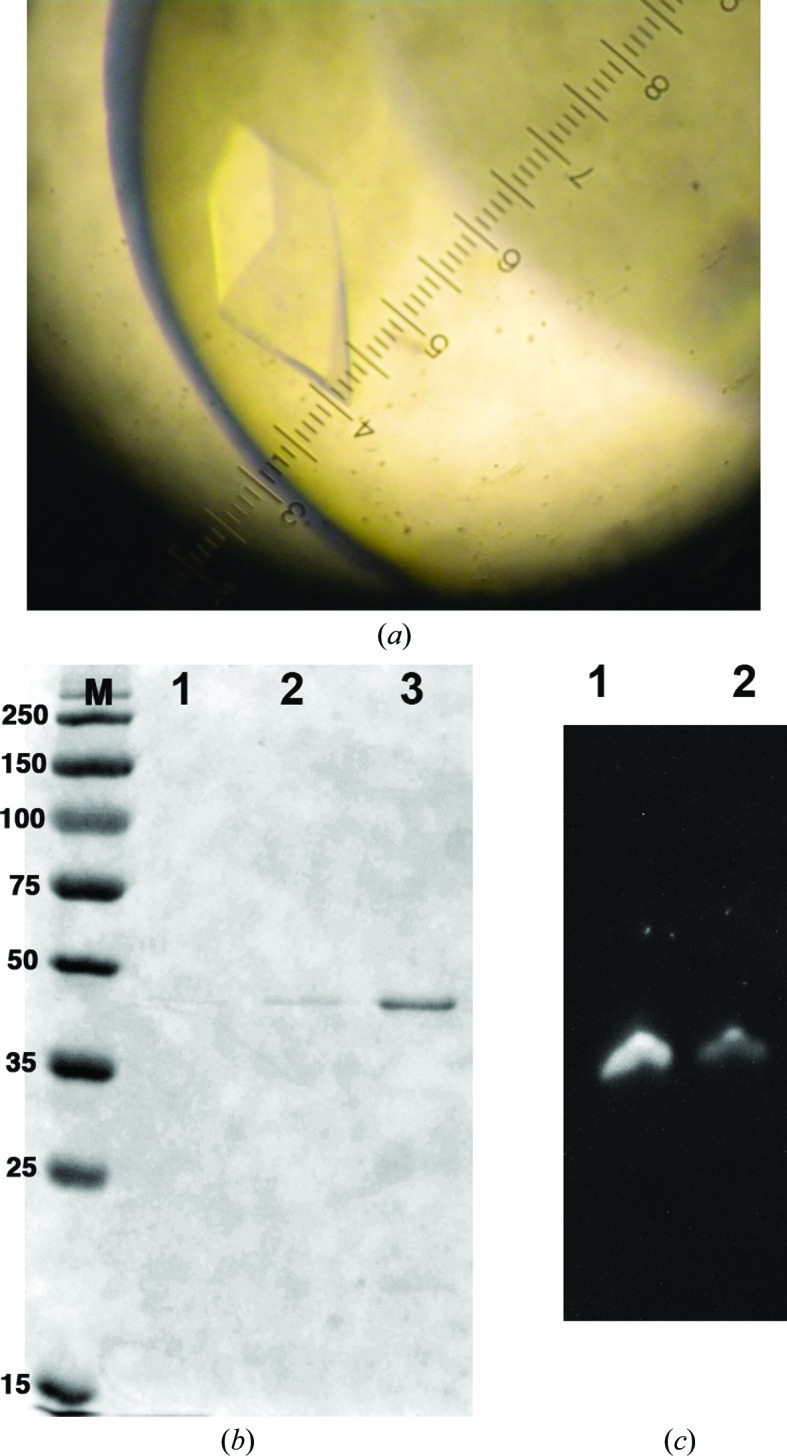
Reb1–Ter3 crystals. (a) Crystals of data-collection quality were grown by batch crystallization under oil in 0.1 M MES pH 6.5, 0.2 M ammonium sulfate, 20% PEG MME. (b) 12% SDS–PAGE of crystals; crystals were washed in mother liquor and loaded onto the gel. Lane M, molecular-weight markers (labeled in kDa); lane 2, crystal wash solution; lane 3, crystals. (c) 8% acrylamide gel analysis of the crystals. Lane 1, Ter3 DNA site used for crystallization; lane 2, crystals. DNA was stained with SYBR Green.
Table 2. Crystallization.
| Method | Batch crystallization under oil |
| Plate type | Microbatch 72 Well Plate (Greiner) |
| Temperature (K) | 292 |
| Protein concentration (mgml1) | 15 |
| Buffer composition of protein solution | 20mM TrisHCl pH 7.5, 200mM NaCl, 5mM TCEP, 1mM EDTA, 10% glycerol |
| Composition of reservoir solution | 0.1M MES pH 6.5, 0.2M ammonium sulfate, 20% PEG 5K monomethyl ether |
| Volume and ratio of drop | 24l, 1:1 |
| DNA element (Ter3) | 5-GTAAAAGGTAAGGGTAATGCACTTTT-3 |
| 3-ATTTTCCATTCCCATTACGTGAAAAC-5 |
2.3. Data collection and processing
The crystals diffracted to ∼3.0 Å resolution on beamline X6a at NSLS (Fig. 3 ▶ a). A total of 120 images were collected with a crystal-to-detector distance of 320 mm. The data were indexed, integrated and scaled using the HKL-2000 program suite (Otwinowski & Minor, 1997 ▶). Details of the data-collection parameters and statistics are shown in Table 3 ▶. Native Patterson analysis using the phenix.xtriage routine indicated that no translational pseudosymmetry was present (data not shown). The calculated self-rotation function confirms the presence of noncrystallographic twofold peaks in the ac plane (Fig. 3 ▶ b).
Figure 3.

(a) X-ray diffraction pattern of the Reb1–Ter3 crystals collected on beamline X6a at NSLS. The circle represents 3.0 Å resolution. (b) Representation of the Patterson self-rotation function for the P21 data set of the Reb1–Ter3 complex. The plot was calculated using GLRF using a spherical integration radius of 20 Å and diffraction data from 8 to 4 Å resolution (Tong & Rossmann, 1990 ▶). The plot indicates the presence of a strong peak at ϕ = 0, ψ = 0, κ = 180°, as expected for the 21 screw axis. There are additional noncrystallographic twofold peaks located at ψ = 90, κ = 180° (ac plane).
Table 3. Data collection and processing.
Values in parentheses are for the outer shell.
| Diffraction source | X6a, NSLS |
| Wavelength () | 0.976 |
| Temperature (K) | 110 |
| Detector | ADSC Q270 |
| Crystal-to-detector distance (mm) | 320 |
| Rotation range per image () | 1 |
| Total rotation range () | 120 |
| Exposure time per image (s) | 30 |
| Space group | P21 |
| a, b, c () | 68.9, 162.9, 71.1 |
| , , () | 90, 94.7, 90 |
| Mosaicity () | 0.7 |
| Resolution range () | 503.0 |
| Total No. of reflections | 360125 |
| No. of unique reflections | 77916 |
| Completeness (%) | 93 (95.5) |
| Multiplicity | 2.7 (2.6) |
| I/(I) | 10.3 (2.3) |
| R r.i.m. | 0.067 (0.58) |
3. Results and discussion
The minimal region of Reb1 that possesses the DNA-binding and replication-termination abilities (amino acids 146–504) was purified to homogeneity. The initial SP Sepharose step was necessary to remove the majority of the E. coli proteins that were interfering with the Ni–NTA chromatography step. The final yield was ∼4 mg per litre. Reb1 could not be concentrated to greater than 5 mg ml−1. However, upon addition of DNA the complex could be concentrated to 15 mg ml−1. The preliminary crystals were screened for the presence of both DNA and protein on 8% TBE acrylamide and SDS–PAGE gels, respectively (Fig. 2 ▶). Crystals obtained using the hanging-drop method only produced needles that grew in clusters. To overcome these problems, we tried different approaches including sitting-drop, batch and dialysis crystallization, cryoprotectant screening, a gradual increase in cryoprotectant concentration, macroseeding and microseeding. Optimal crystals were obtained using batch crystallization under oil. Moreover, during data collection, crystals were taken out of the cryostream, incubated in 2 µl cryoprotectant (mother liquor plus 10% glycerol) for 60–90 s and placed back in the cryostream. Repeating this annealing for two or three cycles helped to reduce the mosaicity of the crystals, but further cycles resulted in permanent crystal decay in most cases (data not shown). Preliminary crystallographic analysis gave a calculated Matthews coefficient of 3.3 Å3 Da−1 with a solvent content of 63.6%, assuming the presence of two molecules in the asymmetric unit. We have prepared and obtained crystals of a selenomethionine-derivatized Reb1–Ter3 complex to allow structural determination by single anomalous dispersion (SAD). We have successfully calculated the phases using SHELX. Refinement is in progress.
Supplementary Material
Supplementary Table.. DOI: 10.1107/S2053230X15004112/rl5092sup1.pdf
Acknowledgments
This work was supported by grants 5R01GM098013 and SCTR #1211 awarded to DB and 1R01GM092854 and ACS-IRG 11997-IRG-73-001-34-IRG to CRE. We would like to thank members of NSLS beamline X6a, Vivian Stojanoff, Jean Jakoncic and Edwin Lazo, for their valuable help in data collection.
References
- Aggarwal, A. K. (1990). Methods, 1, 83–90. [DOI] [PubMed]
- Bastia, D. & Mohanty, B. K. (1996). Mechanisms for Completing DNA Replication. New York: Cold Spring Harbor Laboratory Press.
- Bastia, D. & Singh, S. K. (2011). Bioarchitecture, 1, 24–28. [DOI] [PMC free article] [PubMed]
- Bastia, D., Zzaman, S., Krings, G., Saxena, M., Peng, X. & Greenberg, M. M. (2008). Proc. Natl Acad. Sci. USA, 105, 12831–12836. [DOI] [PMC free article] [PubMed]
- Biswas, S. & Bastia, D. (2008). Mol. Cell. Biol. 28, 6844–6857. [DOI] [PMC free article] [PubMed]
- Boddy, M. N. & Russell, P. (2001). Curr. Biol. 11, R953–R956. [DOI] [PubMed]
- Brewer, B. J. & Fangman, W. L. (1988). Cell, 55, 637–643. [DOI] [PubMed]
- Kaplan, D. L. & Bastia, D. (2009). Mol. Microbiol. 72, 279–285. [DOI] [PubMed]
- Krings, G. & Bastia, D. (2005). J. Biol. Chem. 280, 39135–39142. [DOI] [PubMed]
- Krings, G. & Bastia, D. (2006). Mol. Cell. Biol. 26, 8061–8074. [DOI] [PMC free article] [PubMed]
- Lambert, S. & Carr, A. M. (2005). Biochimie, 87, 591–602. [DOI] [PubMed]
- Längst, G., Blank, T. A., Becker, P. B. & Grummt, I. (1997). EMBO J. 16, 760–768. [DOI] [PMC free article] [PubMed]
- Otwinowski, Z. & Minor, W. (1997). Methods Enzymol. 276, 307–326. [DOI] [PubMed]
- Sanchez, J. A., Kim, S.-M. & Huberman, J. A. (1998). Exp. Cell Res. 238, 220–230. [DOI] [PubMed]
- Singh, S. K., Sabatinos, S., Forsburg, S. & Bastia, D. (2010). Cell, 142, 868–878. [DOI] [PMC free article] [PubMed]
- Tong, L. & Rossmann, M. G. (1990). Acta Cryst. A46, 783–792. [DOI] [PubMed]
- Zhao, A., Guo, A., Liu, Z. & Pape, L. (1997). Nucleic Acids Res. 25, 904–910. [DOI] [PMC free article] [PubMed]
Associated Data
This section collects any data citations, data availability statements, or supplementary materials included in this article.
Supplementary Materials
Supplementary Table.. DOI: 10.1107/S2053230X15004112/rl5092sup1.pdf