Abstract
Objective
The comparative mortality figure (CMF) is the expected number of deaths in the standard population compared with those observed. We assessed state-based CMFs for people with HIV infection to allow standardized assessment of mortality in all states.
Methods
We used National HIV Surveillance System data to compute CMFs for people diagnosed with HIV and AIDS from 2001 to 2010 who met the CDC HIV case definition; were alive on December 31, 2009; and died during 2010.
Results
In 33 U.S. states with name-based HIV reporting since 2001, the 2010 CMF for people with an HIV diagnosis was 2.8 compared with 4.5 for those with an AIDS diagnosis. CMFs for males were higher than for females (3.4 vs. 3.1) and black people had higher CMFs than white people for HIV (3.2 vs. 2.2) and AIDS (4.7 vs. 4.3). CMFs by state ranged from 0.9 to 4.2 for HIV and 1.9 to 9.7 for AIDS. In 50 states and the District of Columbia with AIDS reporting, CMFs for males and females were similar (4.5 and 4.6, respectively), CMFs for black people remained higher than for white people (5.0 and 3.9, respectively), and the range for states remained broad (1.2–9.4).
Conclusion
State mortality figures varied based on population composition and disease stage at diagnosis, possibly indicating a need for state-specific testing, linkage to care, and viral suppression strategies to reduce mortality.
State mortality rates for people infected with human immunodeficiency virus (HIV) vary greatly, and comparability among states will benefit from enhanced standardization. The 2010 death rate of HIV-infected people aged ≥13 years in the United States was 7.5 per 100,000 population, with state rates ranging broadly from 0.4 per 100,000 population in Maine to 38.8 per 100,000 population in the District of Columbia (DC).1 Similarly, in the same age group of people diagnosed with HIV infection, those with stage 3 infection (i.e., acquired immunodeficiency syndrome [AIDS])2 had a death rate of 6.1 per 100,000 population in 2010, with state rates also ranging broadly from 0.3 per 100,000 population in Maine to 33.7 per 100,000 population in DC. The large disparity among state death rates for people with HIV infection, and the disproportionate impact on some racial/ethnic, risk factor, and age groups,3 indicates a need for standardization of each state rate to a fixed population to enhance comparability. This study provides those results.
Testing for HIV infection is recommended by the U.S. Preventive Services Task Force for all adolescents and adults aged 15–65 years and for all pregnant women4 to increase early detection, facilitate treatment, reduce transmission, and reduce mortality.5,6 While testing with rapid tests, in-home, and at other nonmedical facilities has increased the number of people with HIV infection who know their status, it is estimated that in 2010, one in six people with HIV infection did not know they were infected.7
In addition, despite implementation of a variety of prevention strategies,8 increased testing, linkage-to-care activities, and improved HIV infection treatments aimed at viral load suppression have resulted in increased prevalence of people living with HIV infection. The 2013 Presidential Continuum of Care Initiative recommends further enhancements to identify and address gaps in care along the continuum, beginning with diagnosis and moving though sequential stages for linkage to care, retention in care, and antiretroviral treatment (ART) utilization, resulting in viral suppression.9
Comparisons of state mortality, the ultimate indicator of success along the continuum of care, can inform HIV infection testing and care initiatives, and evaluate the impact of linkage to and retention-in-care activities. However, the method selected for analysis can significantly affect the results.10 Standardized methods for presenting state death rates are necessary to ensure comparability of state mortality.
Numerous methodologies for assessing standardized mortality rates have been documented.10,11 The standardized mortality ratio for indirect standardization is commonly reported, although the comparative mortality figure (CMF) (or comparative mortality ratio [CMR] derived from CMFs) for direct standardization is recommended for geographic comparisons among heterogeneous populations.12–14 While the CMF has been used for mortality studies of chronic disease and disability,15–19 it has not previously been used to compare state-level CMFs for people diagnosed with HIV infection using data from a national HIV surveillance system.
METHODS
The Centers for Disease Control and Prevention's (CDC's) population-based National HIV Surveillance System (NHSS) captures and links multiple source documents (e.g., HIV case report forms, laboratory and physician reports, and death certificates) for each person known to be infected with HIV to populate demographic, risk factor, clinical care, laboratory result, and mortality data elements. Reporting of data on people diagnosed with HIV infection is mandatory in all states, DC, and U.S. dependent areas, and the jurisdictions send the data to CDC without personal identifying information. State and local linkage of NHSS to vital statistics death certificates, the Social Security Death Master File (SSDMF),20 and the National Death Index (NDI)21 is required no less than annually to identify with HIV infection those who are deceased22–24 from any cause, not just deaths resulting from HIV infection. Our analysis allowed for 24 months of reporting delay to identify deaths in NHSS.
For this analysis, we included people diagnosed with HIV infection who met the CDC HIV infection case definition;25 were diagnosed with HIV infection at any stage from January 1, 2001, to December 31, 2010; and were alive on December 31, 2009 (defined as the absence of a death certificate or other confirmation of death in the surveillance system). Because name-based HIV reporting was implemented over time in different jurisdictions, data were not available for all areas for the analysis time period. We included data for those who were residents at the earliest date of HIV or AIDS diagnosis of one of 33 states with name-based HIV reporting as of 2001. Those states include Alabama, Alaska, Arizona, Arkansas, Colorado, Florida, Idaho, Indiana, Iowa, Kansas, Louisiana, Michigan, Minnesota, Mississippi, Missouri, Nebraska, New Jersey, New Mexico, Nevada, New York, North Carolina, North Dakota, Ohio, Oklahoma, South Carolina, South Dakota, Tennessee, Texas, Utah, Virginia, West Virginia, Wisconsin, and Wyoming. We assessed mortality among those with HIV who died from January 1, 2010, to December 31, 2010 (defined as the presence of a death certificate or other confirmation of death in the NHSS with a 2010 date of death). We obtained the 2010 standard population and number of deaths from CDC's National Center for Health Statistics WONDER dataset.26 All data reported to the national surveillance system as of December 31, 2012, were used in the analysis.
Stage of disease at diagnosis was defined as the absence of an AIDS diagnosis within three months of an HIV diagnosis (hereinafter referred to as “early stage”) or the presence of a confirmed AIDS diagnosis within three months of an HIV diagnosis (hereinafter referred to as “late stage”).
Data were adjusted for case reporting delay, death reporting delay, and age group. No adjustment was made for underreporting. We calculated age categories using the age in years on December 31, 2009, for those in the study population who were still alive and age at death for those who died in 2010. We calculated CMFs using the following formulas:
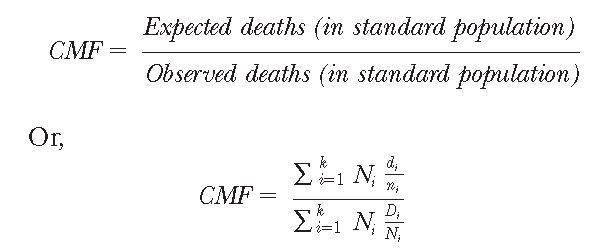 |
where Ni is the number of people in the standard population, Di is the number of deaths in the standard population, and ni and di are the number of people and number of deaths in the study population, respectively.13
Results are presented by stage of disease at diagnosis in aggregate and by state for the 33 states with name-based reporting since 2001. The health status of a place is judged to be better when the CMR of that place is lower than other places.12
We calculated CMRs using the following formula:
 |
Subsequent tables present results for all 50 states and DC and include the CMFs for those diagnosed with AIDS from 2001 to 2010 regardless of date of first HIV infection diagnosis. These tables provide comparative data for all states including those that did not have HIV infection name-based reporting until after 2001 and for which only AIDS information was available.
RESULTS
As shown in Table 1, there were 6,564 deaths of those initially diagnosed with early- or late-stage HIV infection from 2001 to 2010 who were alive on December 31, 2009, but died during 2010 in the 33 states included in this analysis (4,765 males and 1,799 females). The CMFs for males and females initially diagnosed during early-stage HIV infection were similar (2.8 and 2.7, respectively). As expected, those initially diagnosed during the late stage had higher mortality than those diagnosed at an early stage, and mortality was higher for males (4.6) than for females (4.1). Compared with white people, black/African American people had higher mortality among those diagnosed with early-stage disease (2.2 and 3.2 per 100,000 population, respectively), as well as those with late-stage disease (4.3 and 4.7, respectively). Among all racial/ethnic groups, those of multiple races had the highest mortality regardless of stage at diagnosis (early-stage CMF = 4.5, late-stage CMF = 6.9). In contrast with all other racial/ethnic groups, American Indians/Alaska Natives had lower CMFs for those diagnosed at late stage (3.2) compared with those diagnosed in the early stage (4.4). The greatest difference in CMFs between early- and late-stage disease was among Asians (early stage CMF = 2.9, late-stage CMF = 5.2).
Table 1.
CMFs for people diagnosed with HIV infection from 2001 to 2010 who were alive on December 31, 2009, and died during 2010, by stage of disease at diagnosis and selected demographic characteristics: 33 U.S. states,a 2010
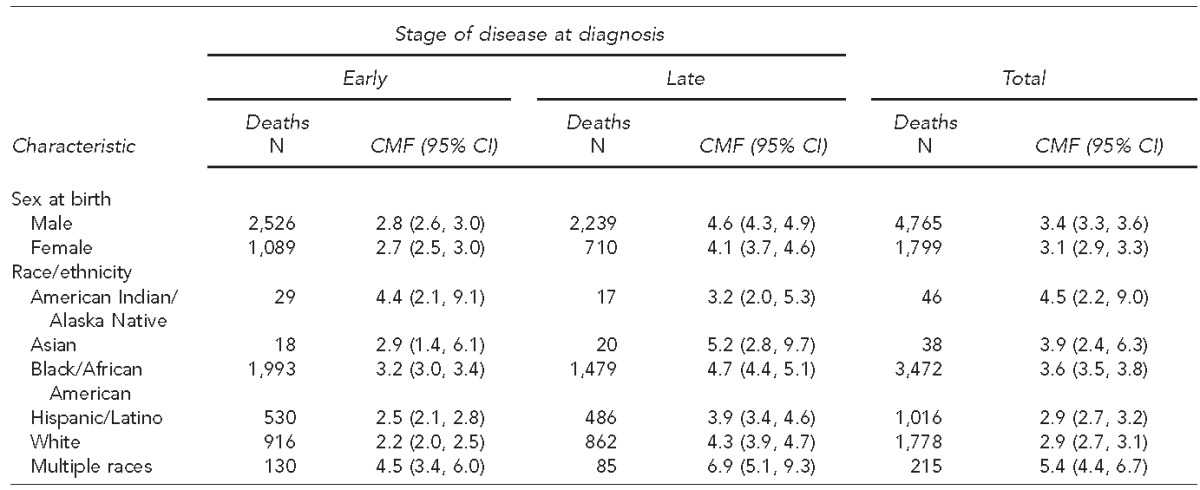
Includes 33 states with name-based reporting since 2001: Alabama, Alaska, Arizona, Arkansas, Colorado, Florida, Idaho, Indiana, Iowa, Kansas, Louisiana, Michigan, Minnesota, Mississippi, Missouri, Nebraska, Nevada, New Jersey, New Mexico, New York, North Carolina, North Dakota, Ohio, Oklahoma, South Carolina, South Dakota, Tennessee, Texas, Utah, Virginia, West Virginia, Wisconsin, and Wyoming.
CMF = comparative mortality figure
HIV = human immunodeficiency virus
CI = confidence interval
The CMFs for the 33 states with name-based reporting were 2.8 (95% confidence interval [CI] 2.6, 2.9) for those diagnosed with early-stage disease and 4.5 (95% CI 4.2, 4.7) for those with late-stage disease. This increase in mortality for those diagnosed with late-stage disease was true for all individual states with the exception of Arkansas, where the CMFs were similar (early-stage diagnosis = 4.2 and late-stage diagnosis = 4.1) and Iowa and Kansas, where people experienced higher mortality among patients diagnosed in early stage rather than late stage (Iowa = 2.7 and 1.9 and Kansas = 3.3 and 2.1 for early and late stages, respectively) (Table 2).
Table 2.
CMFs for people diagnosed with HIV infection from 2001 to 2010 who were alive on December 31, 2009, and died during 2010, by stage of disease and state of residence at diagnosis: 33 U.S. states,a 2010
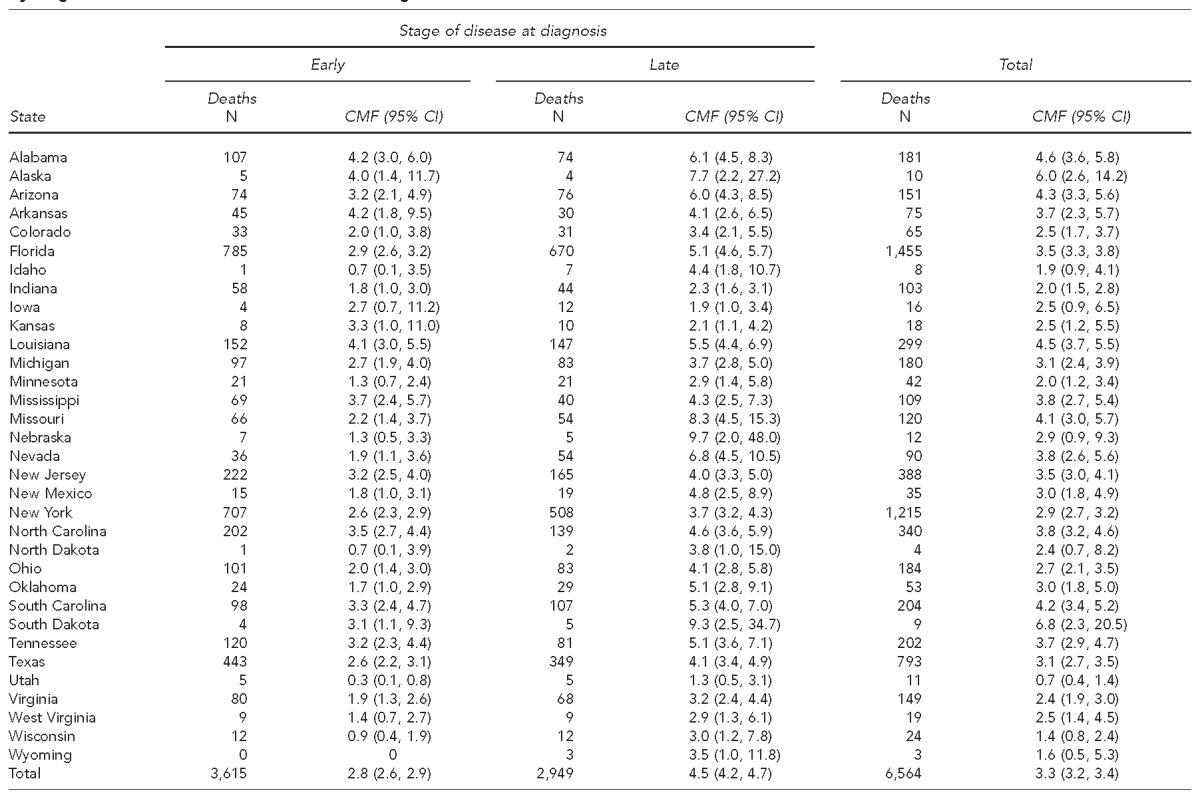
Includes 33 states with name-based reporting since 2001
CMF = comparative mortality figure
HIV = human immunodeficiency virus
CI = confidence interval
Excluding the six potentially unstable CMFs in states with fewer than 12 deaths, early-stage diagnosis CMFs by state ranged from 0.9 in Wisconsin to more than four times that (4.2 each) in Alabama and Arkansas, CMFs for late stage varied from 1.9 in Iowa to nearly five times that (9.7) in Nebraska, and total (all stages) ranged from 1.4 in Wisconsin to 4.6 in Alabama. The mean difference between early- and late-stage CMFs was 1.9, excluding the six low death count states, and 2.2 for all 33 states (Table 2).
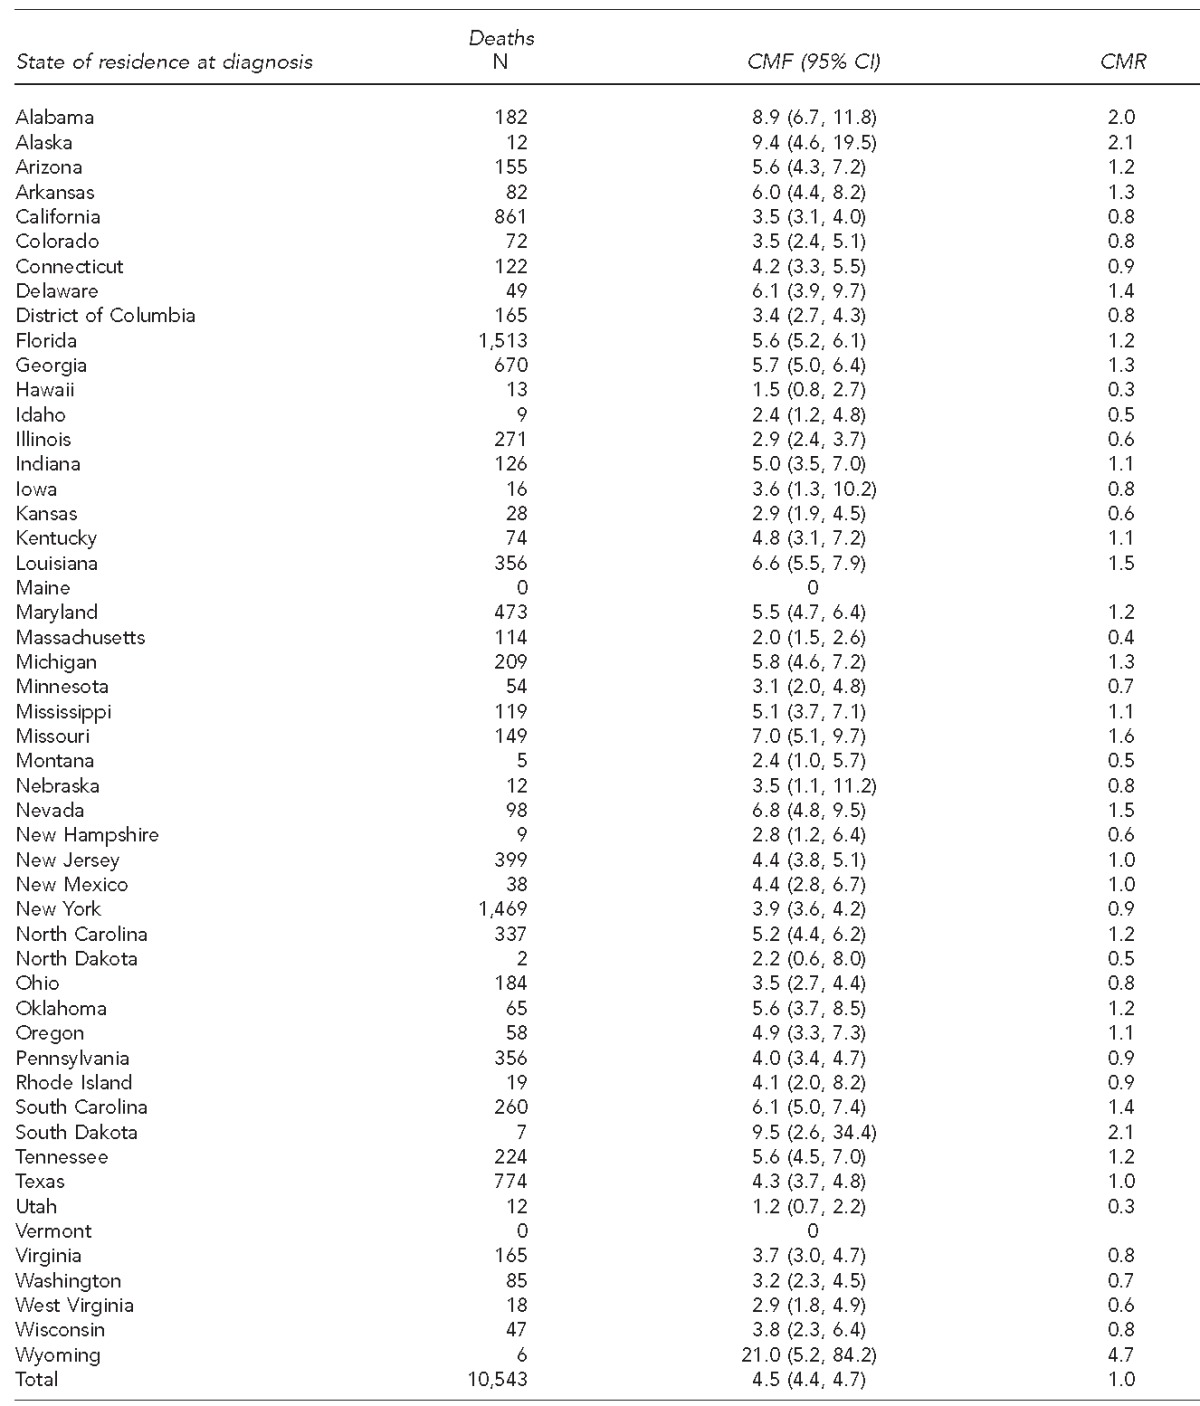
The 2010 CMF for those diagnosed with late-stage HIV infection from 2001 to 2010 and alive on December 31, 2009, in all 50 states and DC was 4.5 (95% CI 4.4, 4.7) (Table 3), which was identical to the CMF for those diagnosed with late-stage HIV infection from 2001 to 2010 in the 33 states. Other commonalities between the 33-state and 50-state populations with late-stage diagnosis included the highest mortality among those of multiple races and higher mortality among black/African Americans when compared with white people. Excluding the eight potentially unstable CMFs in states with fewer than 12 deaths, CMFs among the remaining 42 states and DC ranged from 1.2 in Utah to 9.4 in Alaska (Table 4).
Table 3.
CMFs for people diagnosed with late-stage HIV infection from 2001 to 2010 who were alive on December 31, 2009, and died during 2010, by selected demographic characteristics: U.S., 2010
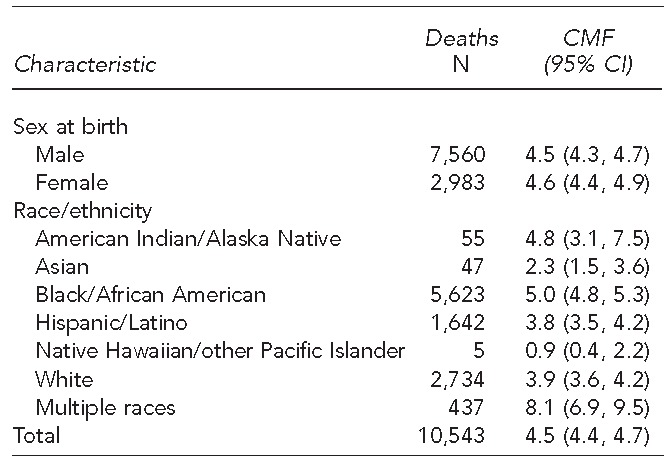
CMF = comparative mortality figure
HIV = human immunodeficiency virus
CI = confidence interval
Table 4.
CMFs for people diagnosed with late-stage HIV infection from 2001 to 2010 who were alive on December 31, 2009, and died during 2010, by state of residence at AIDS diagnosis: U.S., 2010
CMF = comparative mortality figure
HIV = human immunodeficiency virus
AIDS = acquired immunodeficiency syndrome
CI = confidence interval
CMR = comparative mortality ratio
DISCUSSION
The CMFs showed substantial variation in mortality among states even after adjusting for age and reporting delay. Differences in mortality by state of residence among those diagnosed with HIV may be due to differences in additional population characteristics (e.g., sex), jurisdictional capacity to deliver care, individual ability to access care, and socioeconomic factors. The percentage of those diagnosed with advanced-stage HIV disease varied by state, and survival among those with advanced disease was lower than among those diagnosed with early-stage disease.2,27 Little information exists on any differences among states in the prescription or use of ART. However, geographic differences exist in prompt linkage to care after HIV diagnosis and retention in HIV care and viral suppression among those living with HIV.28 The percentage of people who did not have health insurance coverage also varied by state.29 Early diagnosis of HIV, prompt linkage to and sustained HIV care, and ART prescriptions are the necessary steps in the continuum of care to ultimately achieve viral suppression for optimal health. Yet, about one-third of those with HIV are diagnosed with late-stage disease annually,27 and many people with HIV are not in continuous care, on ART, or have a suppressed viral load,30 the result of which is often death.
Late diagnosis, however, is unlikely to explain the disparity in death rates between black/African Americans and white people, as there was little difference in the percentage classified with late stage at diagnosis between these groups.27 The results correspond to earlier findings of significantly higher case fatality (i.e., deaths among those living with HIV) among black/African Americans compared with the non-Hispanic, non-black/African American population living with HIV,2,10 and life expectancy has been found to be lower in black/African American and Hispanic or Latino males than in white males.31 The results may possibly be due to differences in care and treatment due to community capacity to provide care and individual factors. The percentage of black/African Americans who are linked to care within three months of diagnosis, who are in continuous care, and who have a suppressed viral load is lower than that of white people.32,33 Black/African Americans are less likely than white people to have health insurance (21% vs. 16%, respectively)34 and may experience other socioeconomic situations, such as poverty and lack of transportation, that hinder accessing care. Additional factors that may lead to differences in accessing and remaining in HIV care among states as well as between subpopulations within states may include the distribution of groups with specific risk factors, lack of social support, unstable housing, lack of transportation, lower education, poverty, unemployment, racism, and stigma.35–37 Bridging these barriers may help states with higher mortality reduce deaths.
Limitations
This study was subject to a number of limitations related primarily to case and death ascertainment. First, not all of those with HIV infection were identified and entered in the NHSS, including many who were unaware of their HIV infection status (i.e., not yet diagnosed). However, recent capture-recapture analyses of completeness of case reporting indicate the vast majority of states identify more than 95% of their estimated number of new cases annually.38 It is not possible to know how many cases are undiagnosed in a given year although, as part of the death ascertainment process, death certificates with an indication of HIV are provided to the NHSS to ensure they were previously reported.
Second, those reported to the NHSS are assumed to be alive unless their death has been reported to CDC. Death ascertainment standards require that states match all vital statistics, SSDMF, and NDI death records to NHSS annually. However, at the time of this study, California (Los Angeles County) and Oregon had not completed that process for deaths occurring in 2010, likely resulting in an underestimate of their CMFs.38
Third, eight states are currently prohibited by state law from linking NHSS data to the NDI, as doing so requires the sharing of personal identifying information outside the state health department. These states may not obtain information for a person diagnosed with HIV infection in the state who may have died somewhere else. NDI data are also used to capture cause of death codes in addition to new deaths. Fourth, this study included deaths by all causes, not just those resulting from HIV infection; thus, they cannot be interpreted as mortality due strictly to HIV infection. While the death rate of people with HIV infection (or AIDS) is greater than the rate of people of similar ages without HIV infection (or AIDS) or without access to ART, HIV infection is almost universally fatal. Lastly, reported numbers of <12 in all tables should be interpreted with caution because the numbers have underlying relative standard errors >30% and are considered unreliable.
CONCLUSION
Death rates from all causes among those with HIV infection varied by state of residence at HIV diagnosis. People diagnosed with advanced disease and black/African Americans had a higher death rate than people who were diagnosed early or who were white, respectively. The 2010 rate ratio of deaths of black to white people with HIV infection (8.2) was 10 times as high as the rate ratio of black to white people without HIV infection (0.8).26 In addition, approximately 42% of states exceeded the national CMF for both HIV infection and AIDS. It is critical that testing efforts continue to expand and become part of routine medical care for early diagnosis. Expansion of jurisdictional capacity and individual access to health-care services and medical insurance coverage may help ensure that those diagnosed with HIV infection enter and remain in care to benefit from advances in ART. Novel approaches to improve retention in HIV care and reengage people who have not been in continuous care are needed. Providing affordable care to all those diagnosed with HIV infection according to the updated HIV treatment guidelines39 may help reduce geographic and demographic disparities in mortality. Finally, additional studies comparing high and low mortality states with similar risk group distribution, population -characteristics, health-care access, socioeconomic indicators, and similar factors will help inform future prevention and treatment strategies.
Footnotes
The findings and conclusions in this article are those of the authors and do not necessarily represent the views of the Centers for Disease Control and Prevention.
REFERENCES
- 1.Centers for Disease Control and Prevention (US), National Center for HIV/AIDS, Viral Hepatitis, STD, and TB Prevention. ATLAS online database [cited 2014 Dec 29] Available from: URL: http://gis.cdc.gov/GRASP/NCHHSTPAtlas/main.html.
- 2.Centers for Disease Control and Prevention (US), National Center for HIV/AIDS, Viral Hepatitis, STD, and TB Prevention. Rates of diagnoses of HIV infection among adults and adolescents, by area of residence, 2011—United States and 6 dependent areas. HIV Surveill Rep. 2013;23:1–84. [Google Scholar]
- 3.Fenton KA. Changing epidemiology of HIV/AIDS in the United States: implications for enhancing and promoting HIV testing strategies. Clin Infect Dis. 2007;45:S213–20. doi: 10.1086/522615. [DOI] [PubMed] [Google Scholar]
- 4.Meyer VA. Screening for HIV: U.S. Preventive Services Task Force recommendation statement. Ann Intern Med. 2013;159:1–36. doi: 10.7326/0003-4819-159-1-201307020-00645. [DOI] [PubMed] [Google Scholar]
- 5.Vital signs: HIV testing and diagnosis among adults: United States, 2001–2009. MMWR Morb Mortal Wkly Rep. 2010;59(47):1550–5. [PubMed] [Google Scholar]
- 6.Satcher Johnson A, Heitgerd J, Koenig LJ, VanHandel M, Branson BM, Connelly E, et al. Revised recommendations for HIV testing of adults, adolescents, and pregnant women in health-care settings. MMWR Recomm Rep. 2006;55(RR-14):1–17. [PubMed] [Google Scholar]
- 7.Centers for Disease Control and Prevention (US), National Center for HIV/AIDS, Viral Hepatitis, STD, and TB Prevention. National HIV prevention progress report, 2013 [cited 2013 Dec 12] Available from: URL: http://www.cdc.gov/hiv/policies/npr.
- 8.Centers for Disease Control and Prevention (US) High-impact HIV prevention: CDC's approach to reducing HIV infections in the United States [cited 2013 Nov 9] Available from: URL: http://www.cdc.gov/hiv/strategy/hihp.
- 9.White House (US) Executive order—HIV care continuum initiative [cited 2013 Dec 12] Available from: URL: http://www.whitehouse.gov/the-press-office/2013/07/15/executive-order-hiv-care-continuum-initiative.
- 10.Hanna DB, Selik RM, Tang T, Gange SJ. Disparities among U.S. states in HIV-related mortality in persons with HIV infection, 2001–2007. AIDS. 2012;26:95–103. doi: 10.1097/QAD.0b013e32834dcf87. [DOI] [PMC free article] [PubMed] [Google Scholar]
- 11.Inskip H, Beral V, Fraser P, Haskey J. Methods for age-adjustment of rates. Stat Med. 1983;2:455–66. doi: 10.1002/sim.4780020404. [DOI] [PubMed] [Google Scholar]
- 12.Chakraborty M, Dass KK. Comparative mortality ratio—a health index. Indian J Public Health. 1985;29:23–8. [PubMed] [Google Scholar]
- 13.Julious SA, Nicholl J, George S. Why do we continue to use standardized mortality ratios for small area comparisons? J Public Health Med. 2001;23:40–6. doi: 10.1093/pubmed/23.1.40. [DOI] [PubMed] [Google Scholar]
- 14.Lee WC. Standardization using the harmonically weighted ratios: internal and external comparisons. Stat Med. 2002;21:247–61. doi: 10.1002/sim.1000. [DOI] [PubMed] [Google Scholar]
- 15.Alexopoulos EC, Messolora F, Tanagra D. Comparative mortality ratios of cancer among men in Greece across broad occupational groups. Int Arch Occup Environ Health. 2011;84:943–9. doi: 10.1007/s00420-011-0622-y. [DOI] [PubMed] [Google Scholar]
- 16.Borrell C, Plasencia A, Pasarin I, Ortun V. Widening social inequalities in mortality: the case of Barcelona, a southern European city. J Epidemiol Community Health. 1997;51:659–67. doi: 10.1136/jech.51.6.659. [DOI] [PMC free article] [PubMed] [Google Scholar]
- 17.Gjesdal S, Ringdal PR, Haug K, Maeland JG, Vollset SE, Alexanderson K. Mortality after long-term sickness absence: prospective cohort study. Eur J Public Health. 2008;18:517–21. doi: 10.1093/eurpub/ckn010. [DOI] [PubMed] [Google Scholar]
- 18.Lusky A, Gurvitz R, Barell V. Variation in mortality rates in Tel Aviv region municipalities. Isr J Med Sci. 1994;30:690–8. [PubMed] [Google Scholar]
- 19.Trautner C, Icks A, Haastert B, Plum F, Berger M, Giani G. Diabetes as a predictor of mortality in a cohort of blind subjects. Int J Epidemiol. 1996;25:1038–43. doi: 10.1093/ije/25.5.1038. [DOI] [PubMed] [Google Scholar]
- 20.National Technical Information Service. Social Security Administration's death master file [cited 2015 Jan 5] Available from: URL: https://dmf.ntis.gov/recordlayout.html.
- 21.Centers for Disease Control and Prevention (US) National death index [cited 2012 Oct 23] Available from: URL: http://www.cdc.gov/nchs/ndi.htm.
- 22.Centers for Disease Control and Prevention (US) and Council of State and Territorial Epidemiologists. Atlanta: CDC; 2005. Technical guidance for HIV/AIDS surveillance programs, volume I: policies and procedures. [Google Scholar]
- 23.Council of State and Territorial Epidemiologists. AIDS case reporting: reciprocal notification. CSTE position statement 17. 1986 [cited 2012 Oct 25] Available from: URL: http://c.ymcdn.com/sites/www.cste.org/resource/resmgr/PS/1986-17.pdf.
- 24.Council of State and Territorial Epidemiologists. Reciprocal (inter-state) notification of HIV cases. CSTE position statement 01-ID-04. 2001 [cited 2015 Jan 5] Available from: URL: http://c.ymcdn.com/sites/www.cste.org/resource/resmgr/PS/2001-ID-4.pdf.
- 25.Schneider E, Whitmore S, Glynn MK, Dominguez K, Mitsch A, McKenna MT. Revised surveillance case definitions for HIV infection among adults, adolescents, and children aged <18 months and for HIV infection and AIDS among children aged 18 months to <13 years—United States, 2008. MMWR Recomm Rep. 2008;57(RR-10):1–8. [PubMed] [Google Scholar]
- 26.National Center for Health Statistics (US) CDC WONDER: about multiple cause of death, 1999–2012 [cited 2013 May 3] Available from: URL: http://wonder.cdc.gov/mcd-icd10.html.
- 27.Centers for Disease Control and Prevention (US), National Center for HIV/AIDS, Viral Hepatitis, STD, and TB Prevention. Monitoring selected national HIV prevention and care objectives by using HIV surveillance data—United States and 6 dependent areas—2011. HIV Surveill Rep. 2013;18:1–47. [Google Scholar]
- 28.Centers for Disease Control and Prevention (US), National Center for HIV/AIDS, Viral Hepatitis, STD, and TB Prevention. Monitoring selected national HIV prevention and care objectives by using HIV surveillance data—United States and 6 U.S. dependent areas—2010. HIV Surveill Rep. 2013;18(No. 2, part B):1–25. [Google Scholar]
- 29.Census Bureau (US) Number and percentage of people without health insurance coverage by state using 2- and 3-year averages: 2008–2009 and 2010–2011 [cited 2013 Dec 28] Available from: URL: http://www.census.gov/hhes/www/hlthins/data/incpovhlth/2011/tables.html.
- 30.Hall HI, Frazier EL, Rhodes P, Holtgrave DR, Furlow-Parmley C, Tang T, et al. Differences in human immunodeficiency virus care and treatment among subpopulations in the United States. JAMA Intern Med. 2013;173:1337–44. doi: 10.1001/jamainternmed.2013.6841. [DOI] [PubMed] [Google Scholar]
- 31.Hall HI, McDavid K, Ling Q, Sloggett A. Determinants of progression to AIDS or death after HIV diagnosis, United States, 1996 to 2001 [published erratum appears in Ann Epidemiol 2007;17:642] Ann Epidemiol. 2006;16:824–33. doi: 10.1016/j.annepidem.2006.01.009. [DOI] [PubMed] [Google Scholar]
- 32.Gray KM, Tang T, Shouse L, Li J, Mermin J, Hall HI. Using the HIV surveillance system to monitor the National HIV/AIDS Strategy. Am J Public Health. 2013;103:141–7. doi: 10.2105/AJPH.2012.300859. [DOI] [PMC free article] [PubMed] [Google Scholar]
- 33.Hall HI, Gray KM, Tang T, Li J, Shouse L, Mermin J. Retention in care of adults and adolescents living with HIV in 13 U.S. areas. J Acquir Immune Defic Syndr. 2012;60:77–82. doi: 10.1097/QAI.0b013e318249fe90. [DOI] [PubMed] [Google Scholar]
- 34.DeNavas-Walt C, Bernadette BD, Smith JC. Current Population Reports, P60-243. Income, poverty, and health insurance coverage in the United States: 2011. Washington: Government Printing Office (US); 2012. [Google Scholar]
- 35.Horstman E, Brown J, Islam F, Buck J, Agins BD. Retaining HIV-infected patients in care: where are we? Where do we go from here? Clin Infect Dis. 2010;50:752–61. doi: 10.1086/649933. [DOI] [PubMed] [Google Scholar]
- 36.Wohl AR, Galvan FH, Myers HF, Garland W, George S, Witt M, et al. Do social support, stress, disclosure and stigma influence retention in HIV care for Latino and African American men who have sex with men and women? AIDS Behav. 2011;15:1098–110. doi: 10.1007/s10461-010-9833-6. [DOI] [PubMed] [Google Scholar]
- 37.McNairy ML, El-Sadr WM. The HIV care continuum: no partial credit given. AIDS. 2012;26:1735–8. doi: 10.1097/QAD.0b013e328355d67b. [DOI] [PubMed] [Google Scholar]
- 38.Karch DL, Chen M, Tang T. Evaluation of the National Human Immunodeficiency Virus Surveillance System for the 2011 diagnosis year. J Public Health Manag Pract. 2014;20:598–607. doi: 10.1097/PHH.0000000000000033. [DOI] [PMC free article] [PubMed] [Google Scholar]
- 39.Department of Health and Human Services (US), Panel on Antiretroviral Guidelines for Adults and Adolescents. Guidelines for the use of antiretroviral agents in HIV-1-infected adults and adolescents. Rockville (MD): HHS; 2013. Also available from: URL: http://aidsinfo.nih.gov/contentfiles/lvguidelines/AdultandAdolescentGL.pdf [cited 2013 Sep 3] [Google Scholar]


