Abstract
Sedimentation field-flow fractionation (sedFFF) was evaluated to characterize the size of Δ(4–23)TEM-β-lactamase inclusion bodies (IBs) overexpressed in fed-batch cultivations of Escherichia coli. Heterologous Δ(4–23)TEM-β-lactamase protein formed different sizes of IBs, depending upon the induction conditions. In the early phases of recombinant protein expression, induced with low concentrations of IPTG (isopropyl-β-d-thiogalactoside), IB masses were larger than expected and showed heterogeneous size distributions. During cultivation, IB sizes showed a Gaussian distribution and reached a broad range by the end of the fed-batch cultivations. The obtained result proved the aptitude of sedFFF to rapidly assess the size distribution of IBs in a culture.
Keywords: Sedimentation field-flow fractionation, Inclusion bodies, β-Lactamase, Fed-batch cultivation
1. Introduction
1.1. Inclusion bodies
Escherichia coli is commonly used as a host to express recombinant proteins. E. coli offers several advantages for expressing heterologous proteins: the cells grow quickly on cheap media and there are a large number of plasmids to use for expressing proteins in various ways. However, one phenomenon frequently observed is that many heterologous proteins become incorrectly folded and form the so-called inclusion bodies (IBs).
IBs are observed as refractive particles either in the cytoplasm or in the periplasmic space (if the heterologous protein is engineered for secretion) (Georgiou et al., 1986). They can grow to more than 1 μm in diameter (Bowden et al., 1991), a large proportion of a single bacterial cell, and thus are clearly visible under a microscope. Their density is approximately 1.3 g/ml, but their buoyant density varies depending on the dispersing medium, because their void volume is sometimes very high (Taylor et al., 1986). IBs contain mostly recombinant protein (up to 99%), but are also contaminated with both chaperones and membrane fragments that adhere to the IBs during preparation (Bowden et al., 1991; Rinas and Bailey, 1992; Valax and Georgiou, 1993; Carrió and Villaverde, 2005).
Because IBs are usually mechanically stable, they can be isolated from cells and separated by centrifugation once they have reached an adequate mass. Although the recombinant proteins entrapped in an IB often show native-like secondary structures and activity, the proteins are not fully folded into their native conformations (Oberg et al., 1994; Khan et al., 1998; Patra et al., 2000; Panda, 2003; Garcia-Fruitos et al., 2005, 2007; Ami et al., 2006; de Groot and Ventura, 2006). To obtain natively folded proteins, IBs are usually dissolved by highly concentrated chaotropic agents like 8 M urea or 6 M guanidine hydrochloride. After removal (e.g. dialysis, column) or dilution of the chaotrop renaturation is achieved to different extents depending on the protein.
Several techniques are available to characterize the size of particles within the nm to μm range. There are three general classes of techniques or methods: physical, imaging, and light scattering (Black et al., 1996). Imaging methods are constantly being improved; however, they currently suffer from the disadvantage of user-dependent tuning (e.g. contrast and shading). Also, due to the relatively small number of particles captured in each image, several images of each sample must be analyzed to attain statistical reliability. Light scattering methods are extensively used in several different sizing applications (e.g. the fields of combustion and droplet forming techniques). Light scattering methods could potentially be used for size characterization of particles such as IBs, delivering average values of size. However, aggregates can severely skew the average size towards higher numbers what completely falsifies the results. Physical techniques include sieving, sedimentation, and electrical methods. Both sedimentation and electrical zone sensing have already been used to characterize the size of IBs (Taylor et al., 1986). However, the two methods delivered different results presumably due to the porous conformation of the inclusion bodies.
1.2. Sedimentation field-flow fractionation
Many different classes of particles have been successfully analyzed by means of field-flow fractionation (Giddings, 1989; Schimpf et al., 2000), of which there are four types: thermal, electrical, cross-flow, and sedimentation, whereby cross-flow FFF already was applied for GFP-IBs (Luo et al., 2006). Using these techniques, the particles are analyzed in the following way: particles are transferred to a rectangular channel with the aid of a laminar flow of buffer (mobile phase). The channel is usually 2-cm wide and 250-μm high, but the length varies depending on the technique. The flow velocity develops a parabolic profile between the upper and the lower walls, whereby the velocity approaches zero at the walls and approaches its maximum in the middle of the channel. The applied field forces the particles toward one wall, the so-called accumulation wall. This effect of the field is counteracted by diffusion. The result is a steady-state distribution of the particles in exponentially distributed layers, between the upper and lower walls. Each layer is characterized by its dimensionless layer thickness (λ).
For sedimentation field-flow fractionation (sedFFF), λ is defined by the following equation (Giddings et al., 1974):
| (1) |
In this equation, k is the Boltzmann constant, T is the temperature (Kelvin), g is the gravitational acceleration, m is the mass of the sample particle with density (ρ), Δρ is the difference between the particle density and the solvent density, and w is the channel height. In sedFFF, the channel is curved to fit inside a rotor basket and centrifugal forces act on the particles when the rotor is spinning. Thus, forces can be adjusted by the spin rate. The retention ratio R, defined as Vo/Ve (Vo and Ve being void and elution volumes, respectively) is expressed in terms of λ as follows:
| (2) |
SedFFF is a fractionation method which has strong advantages compared to methods delivering average sizes such as light scattering. Thereby aggregates and outliers can easily be detected and the fractions can be collected and further analyzed. As the size characterization of standardized particles by analytical ultra centrifugation and sedFFF showed identical results (Li et al., 1990) sedFFF is qualified to determine the size distribution of IBs.
2. Materials and methods
2.1. Bacterial strain and plasmid
The E. coli K12 strain HMS174 (DE3) was used to express Δ(4–23)-TEM1-β-lactamase (from here on referred to as β-lactamase). Amino acids 4–23 of the leader peptide (23 aas in length) were deleted from the β-lactamase gene. This deletion prevents the secretion and transportation of the protein to the periplasm. When highly overexpressed, β-lactamase forms different kinds of IBs depending on where in the cell the IBs form (i.e. in the cytoplasm versus in the periplasm) (Bowden et al., 1991). Genes were cloned into the vector pET30a (Novagen) and expressed through T7-RNA-polymerase (Studier and Maizel, 1969).
2.2. Media composition
A minimal salt medium was used for the fed-batch cultivations that consisted of a phosphate buffer (3 g KH2PO4 and 6 g K2HPO4·3H2O per l) and other components. The other components were calculated based on the final grams of biomass dry matter (BDM) expected: 0.25 g C6H5Na3O7·2H2O (Na-citrate), 0.10 g MgSO4·7H2O, 0.01 g CaCl2·2H2O, 3.30 g glucose·H2O, and 50 μl of trace element solution. For the antecedent batch process, 0.15 g of yeast extract per g BDM was added to accelerate the initial growth. To prevent foam formation, 0.5 ml/l of PPG2000 antifoam reagent was admixed.
The trace element solution was prepared in 5N HCl (per l): 40.0 g FeSO4·7H2O, 10.0 g MnSO4·H2O, 10.0 g AlCl3·6H2O, 4.0 g CoCl2, 2.0 g ZnSO4·7H2O, 2.0 g Na2MoO2·2H2O, 1.0 g CuCl2·2H2O, 0.50 g H3BO3. Isopropyl-β-d-thiogalactopyranoside (IPTG) was used to induce recombinant protein expression. Most media components were bought from Merck Germany. Na-citrate was from Acros Organics and PPG2000 from Bayer Material Science Customer Services GmbH & Co KG.
2.3. Growth conditions
Fed-batch cultivations with an exponential substrate feed were performed at either 37 °C or 30 °C in a 20 l (12-l net volume, 4-l batch volume), computer-controlled MBR bioreactor equipped with standard measurement and control units (pH, pO2, temperature, rpm). The concentration of both O2 and CO2 in the outlet air was determined by a Hartmann and Braun Advanced Optima gas analyzer. The pH was maintained at a set-point of 7.0±0.05 by adding 25% (w/w) ammonia solution. In order to maintain aerobic growth, the dissolved oxygen level was stabilized above 30% via adjusting the stirrer speed and thus the aeration rate. Foaming was suppressed by adding an antifoam agent to both the batch and feed media. The inoculum (1 ml, OD600 = 1), taken from a −80 °C working cell bank, was transferred aseptically to the bioreactor.
Fed-batch regimens with an exponential substrate feed were designed to provide a constant growth rate of μ = 0.1 h−1 during four doubling times. Feed control was achieved by increasing the pump speed according to the exponential growth algorithm, x = x0 eμt, with superimposed feedback by weight control of the substrate tank. x0 is the biomass in the bioreactor at the end of the batch, x is the actual biomass, μ is the growth rate, and t is the elapsed feed time in hours.
Recombinant protein production was induced by IPTG either one generation (7 h) after the start of feeding (part-induction) or at the beginning (21 h of feed) of the last generation (full-induction). For part-induction, either 0.5 μmol or 1 μmol IPTG per g final BDM was injected aseptically into both the bioreactor and the substrate tank. For full-induction, 20 μmol IPTG per g final BDM was injected (Striedner et al., 2003).
2.4. Biomass determination
Optical density (OD) of the culture was measured at λ = 600 nm. The OD was used for a fast approximation of the biomass. The real biomass dry matter (BDM) was determined as following: 10 ml of the cell culture was centrifuged and the pellet was resuspended in distilled water. The solution was again centrifuged and the pellet resuspended and transferred to a pre-weighed beaker. The solution was dried at 105 °C for 24 h and then weighed.
2.5. Quantification of recombinant protein concentration
Cell pellets equivalent to 1 mg BDM were digested by lysozyme (0.66 mg ml−1, incubated for 10 min at 25 °C). The IBs were separated from soluble protein and pelleted by centrifugation (16,000 × g, 10 min at 4 °C). The pellets were dissolved in solubilization buffer (8 M urea, 100 mM Tris/Cl–buffer pH 8.2, 100 mM β-mercaptoethanol). SDS–PAGE with Coomassie staining was used to analyze both protein composition and to quantitate the amount of solubilized IBs. SDS–PAGE was carried out with 10% NuPAGE® Novex Bis-Tris gels in MOPS running buffer. Gels were stained according to standard protocols for Coomassie staining. Gels were scanned with an Epson Expression 1680 Pro scanner and analyzed with ImageQuant TL (GE Healthcare).
2.6. Electron microscopy
For negative staining, 300-mesh copper grids, coated with Piolo-form film, stabilized by carbon evaporation, and freshly glow discharged, were floated for 30 s, face down, on the surface of approximately 10 μl of a suspension of inclusion bodies in water. Subsequently, the samples were stained on 1 drop of a 1% uranyl acetate solution in water for 1 min. After removal of the excess stain by blotting with filter paper, the grids were air-dried (Hayat and Miller, 1990). The negatively stained specimens were analyzed in a Philips CM12 transmission electron microscope (Eindhoven, The Netherlands), operating at 80 keV.
2.7. SedFFF
2.7.1. Preparation of IBs
A cell pellet from 1.8 ml of fermentation broth was disintegrated by sonication in buffer (100 mM Tris/Cl, pH 8, 1% Triton X-100, 5 mM EDTA). IBs were washed with a 1 M NaCl solution to reduce adherent DNA content. They were then washed with a 1% Triton X-100 solution (30 mM Tris/Cl, pH 8, 5 mM EDTA), which mainly reduces adhering membrane particles. Finally, they were washed with water. Re-dispersion after centrifugation was performed by sonication. The IBs were stored at −20 °C until further analysis. For sonication, the VIBRA CELL ultra sonic device (Sonics & Materials Inc. Danbury, CT, USA) was used with the output level adjusted to 5. Pulses of 20 s at 50% duty were applied for 3 cycles with intermediate cooling on ice for 3 min between each cycle.
2.7.2. Carrier liquid
Selection of an appropriate carrier liquid for sedFFF is particularly important in order to avoid swelling, shrinking, aggregation, and aging of particles. Also, both attraction to and rejection of the particles from the surface of channel walls should be minimized. The most common carrier liquid for sedFFF is water, combined with a surfactant. However, buffers are also used. For hydrophobic particles, non-aqueous solvents have been used successfully (Schimpf et al., 2000).
IBs tend to aggregate in water. However, since they consist of proteins interacting via both hydrogen bonds and hydrophobic interactions, the proteins can be disassembled under certain harsh conditions. For β-lactamase IBs, 10 mM Tris/Cl buffer (pH 8.2) with 0.01% w/v of Tween-20 was used. The IB samples in this buffer still contained some aggregations, but stronger detergents or higher pH accelerated the solubilization of persistent IBs. The stability of the IBs in this buffer was confirmed by analyzing a sample with sedFFF analysis. Repeated analysis of this sample revealed a constant size of IBs within a period of 12 h of storage in this buffer.
2.7.3. Density determination
The density of the carrier liquid was determined by means of a Paar DMA 60+DMA 602 density meter to 0.9975 g/ml at 25 °C.
2.7.4. SedFFF protocol
The used sedFFF unit was essentially identical to the model S101 from Postnova Analytics Inc. (Salt Lake City, UT, USA). IBs suspended in the carrier liquid (10 mM Tris/Cl, pH 8, 0.01% Tween-20) to a final concentration of ~1% (w/v) were dispersed by sonication for 1 s. Usually 10 μl of IB-suspension was loaded and then pumped 0.5 ml into the separation channel. At this point, the pumping was stopped and the sedimentation field was applied. The sedFFF device has a void volume of 5.0 ml and a channel height (w) = 245 μm. The radius of the rotor basket, in which the channel is wound, is r = 15.5 cm. The spin rate was monitored with a SHIMPO EE-2 digital tachometer. After a predetermined “relaxation time”, the equilibrium layers were considered stable and the flow was resumed. The solution was eluted from the sedFFF device at a rate of 1 ml/min using a Jasco PU-980 HPLC pump. Elution of the particles was detected by a Jasco HPLC UV-975 UV–Vis detector, adjusted to a wavelength of 254 nm. Signals were recorded with Clarity™ software from DataApex. The relaxation time (τ) can be calculated with the following equation, derived from the Stoke’s equation:
| (3) |
In Eq. (3), w is the channel height, η is the viscosity, Δρ is the difference between the density of the particle and the carrier-liquid, g is the gravitational acceleration, and d is the diameter of the spherical particle.
3. Results and discussion
3.1. Experimental setup
We investigated the aptitude of sedimentation field-flow fractionation (sedFFF) to characterize the size of bacterial inclusion bodies (IBs). Therefore three different fed-batch cultivations were carried out under specific conditions to influence both expression and folding of the recombinant protein. In particular, the level of IPTG (the inducer) in the culture was adjusted to tune the rate of gene expression and hence protein production (i.e. raising the concentration of IPTG increased the rate of gene expression and vice versa). Additionally, the cultivation temperature was adjusted to shift the ratio of IBs formed to soluble β-lactamase (i.e. lowering the temperature increased the amount of soluble protein and vice versa).
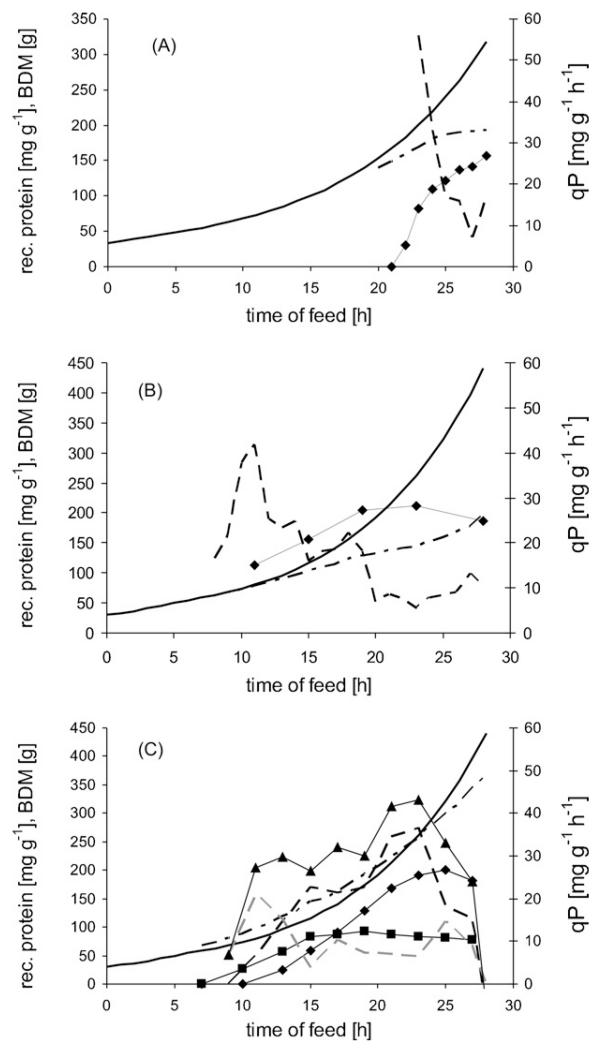
The first cultivation (Cult1) was a fed-batch with a growth rate of 0.1 h−1 over four generations grown at 37 °C. Protein expression was induced at the beginning of the last generation by 20 μmol IPTG per g BDM. Due to this rather strong induction, IB formation started immediately and biomass growth was reduced (Fig. 1A). As a consequence, the β-lactamase formation rate decreased from more than 50 mg g−1 h−1 at the beginning of induction to an average of 15 mg g−1 h−1 during the last 4 h of cultivation. All of the β-lactamase protein produced by the end of cultivation was present in the IB fraction at a concentration of 157 mg per g BDM.
Fig. 1.
(A) Cult1 cultivation trend during fed-batch. (B) Cult2 cultivation trend during fed-batch. (C) Cult3 cultivation trend during fed-batch. ◆: recombinant protein concentration in IBs; ■: combinant protein concentration in soluble form; solid line: fed-batch target-biomass, dot and dash line: achieved biomass; dashed line: product formation rate. In (C)—▲: overall product formation rate; black dashed line: product formation rate of IBs; grey dashed line: product formation rate of soluble recombinant protein.
Cult2 was also grown at 37 °C. Protein expression was induced after 7 h of feed during the following 21 h with 1 μmol IPTG per g BDM. This protocol extended the induction time but lowered the induction dose. As a result, a higher specific concentration of recombinant protein was attained (187 mg g−1). The protein produced by this method was completely incorporated into IBs. Nonetheless, the induction may have been too strong (even though the IPTG dose was reduced) because the expected biomass was not obtained (Fig. 1B). The rate of production (qP) of the recombinant protein quickly reached 40 mg g−1 h−1 in the first phase of induction, leveled off to 20 mg g−1 h−1 in the middle phase, and finally decreased to 10 mg g−1 h−1 during the last 8 h of cultivation.
In Cult3, we intended to enhance native folding of β-lactamase, resulting in the production of more of the soluble form. This was accomplished by lowering the cultivation temperature to 30 °C during 21 h of feed. We also lowered the concentration of IPTG to 0.5 μmol per g biomass. As shown in Fig. 1C, a proportion of the β-lactamase was soluble. The β-lactamase IBs accumulated very slowly compared to Cult1 and Cult2. This is represented in the qP graphs of soluble proteins and IBs. Soluble β-lactamase was produced at a rate of 20 mg g−1 h−1 in the beginning of induction phase and then decreased to less than 10 mg g−1 h−1. The IB formation rate started from 0 mg g−1 h−1, increased to 36 mg g−1 h−1, but then ultimately decreased over the last 5 h of the cultivation. Using this cultivation procedure, a maximum of 200 mg per g BDM IB-β-lactamase and 80 mg g−1 soluble β-lactamase was obtained, a higher yield than either Cult1 or Cult2.
3.2. Operating parameters for sedFFF
3.2.1. Spin rate
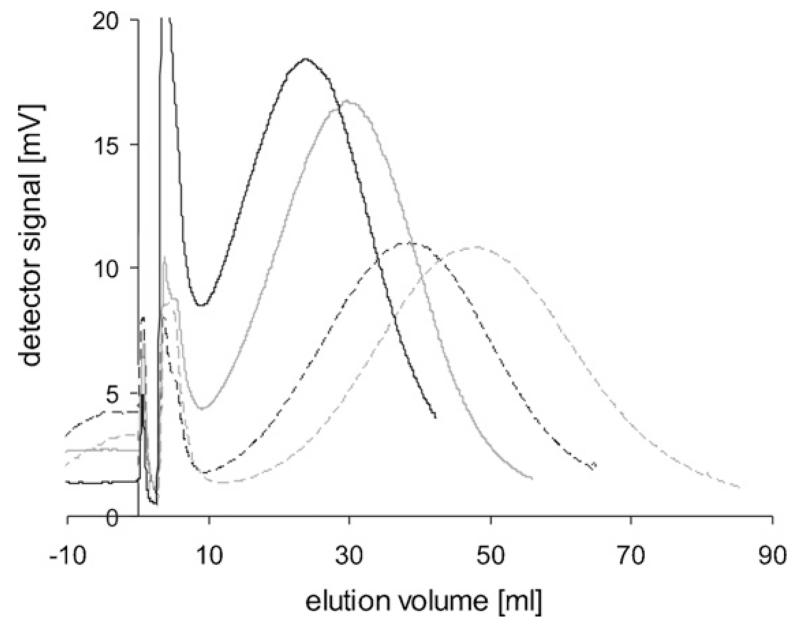
To determine the optimal sedFFF operating parameters for IBs, several spin rates were tested. IBs were obtained at the end of the Cult1 cultivation and used for this experiment. The elution profiles are shown in Fig. 2. Sizes were calculated with Eqs. (1) and (2) (Table 1). At 200 rpm and 230 rpm, the IBs eluted earlier than were expected from calculations based on the elution at lower spin rates (150 rpm and 170 rpm). Li and Caldwell (Li et al., 1990) also previously observed a similar phenomenon, i.e. larger particles eluted too early, presumably due to repulsive wall effects. To analyze samples from different cultivation time points, we chose the spin rate of 170 rpm for IB sizes large enough to yield measurable retardation, i.e. clear separation of void and sample peak. Otherwise a higher spin rate was used.
Fig. 2.
Elution of β-lactamase IBs harvested at the end of Cult1 cultivation at different spin rates, void peaks at 4.5 ml elution volume, and a shoulder at 3 ml arising from aggregations or big particles. Solid black line: 150 rpm; solid grey line: 170 rpm; dashed black line: 200 rpm; dashed grey line: 230 rpm.
Table 1.
Calculated sizes of IBs at different spin rates
| Spin rate (rpm) | 150 | 170 | 200 | 230 |
| Elution volume (ml) | 23.8 | 30.1 | 38.5 | 48.0 |
| Calculated size (nm) | 415 | 415 | 406 | 399 |
3.2.2. Particle density
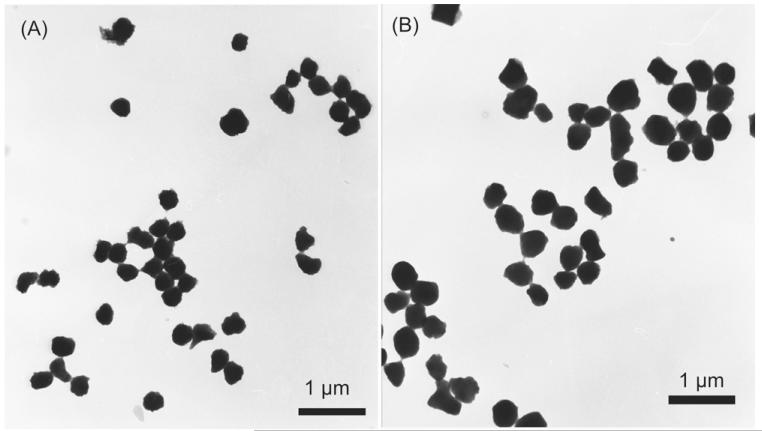
Particle density influences the retention time in sedFFF (see Eq. (1)). The determination of IB density is complicated by their porosity, which can reach 85% of the total volume for prochymosin IBs. Therefore, to calculate the IB density one must take into account the influence of the centrifugation medium (Taylor et al., 1986). Because the apparent buoyant density is the critical density in sedFFF (Giddings and Moon, 1991), we decided to determine the density from sedFFF. Therefore, we needed the mass in order to calculate the density from an elution profile. For this purpose, IBs from Cult1, sample 24 (Cult1_24) and sample 28 (Cult1_28) were analyzed using both the sedFFF device and by transmission electron microscopy (Fig. 3). The elution peak of the Cult1_24 and Cult1_28 IBs showed a Gaussian profile with a median elution volume of 29.1 ml (240 rpm) and 29.2 ml (170 rpm) respectively. In agreement with the Gaussian profile, size distribution derived from electron microscopy images showed a similar pattern. The IBs were spherical, ellipsoid, cylindrical, and barrel-shaped. No obvious morphological change of IBs was observed between unstained (data not shown) and negatively stained samples and during subsequent transmission electron microscopy. The dimensions of the IBs were calculated from the EM images. Using these dimensions, each of the volumes of the spheres, ellipsoids, and cylinders were calculated. By knowing both the elution volume and the volume of the particles, the mass and density of the IBs can be calculated iteratively using Eqs. (1) and (2).
Fig. 3.
Electron microscopy of negatively stained IBs from Cult1 sample 24 (A) and sample 28 (B) sampled 2 h and 6 h after induction respectively.
Using this procedure, we found that IBs have a density of 1.33 g ml−1 and, assuming a spherical shape, Cult1_28 IBs have a median diameter of 410 nm and Cult1_24 IBs a median diameter of 325 nm. An IB density of 1.33 g ml−1 indicates a high compactness with a low porosity of 20% (referring to a proposed average density of proteins of 1.41 g ml−1 (Fischer et al., 2004)). Our calculated IB density is consistent with the value commonly used (1.3 g ml−1) in the literature. For example, Taylor et al. (1986), reported buoyant densities ranging from 1.25 g ml−1 to 1.34 g ml−1 for γ-interferon IBs and ranging from 1.20 g ml−1 to 1.29 g ml−1 for prochymosin IBs (depending on the method used).
In addition, size distribution of IBs derived from electron microscopic images compared to sedFFF elution profiles coincided. These results clearly show the aptitude of sedFFF to determine accurately the size of IBs.
3.3. Reproducibility
β-Lactamase IBs, harvested at the end of Cult1 cultivation, were dispersed in the carrier liquid by sonication. The resulting IB dispersion was applied onto the sedFFF machine three times over a 12-h time period. Elution profiles were derived with peaks at 29.5 ml, 28.9 ml and 29.2 ml, respectively. These results indicate that this method can be used reliably to determine the elution time of IBs and that β-lactamase IBs are stable in the chosen carrier liquid.
3.4. SedFFF analysis of IB samples from fed-batch cultivations
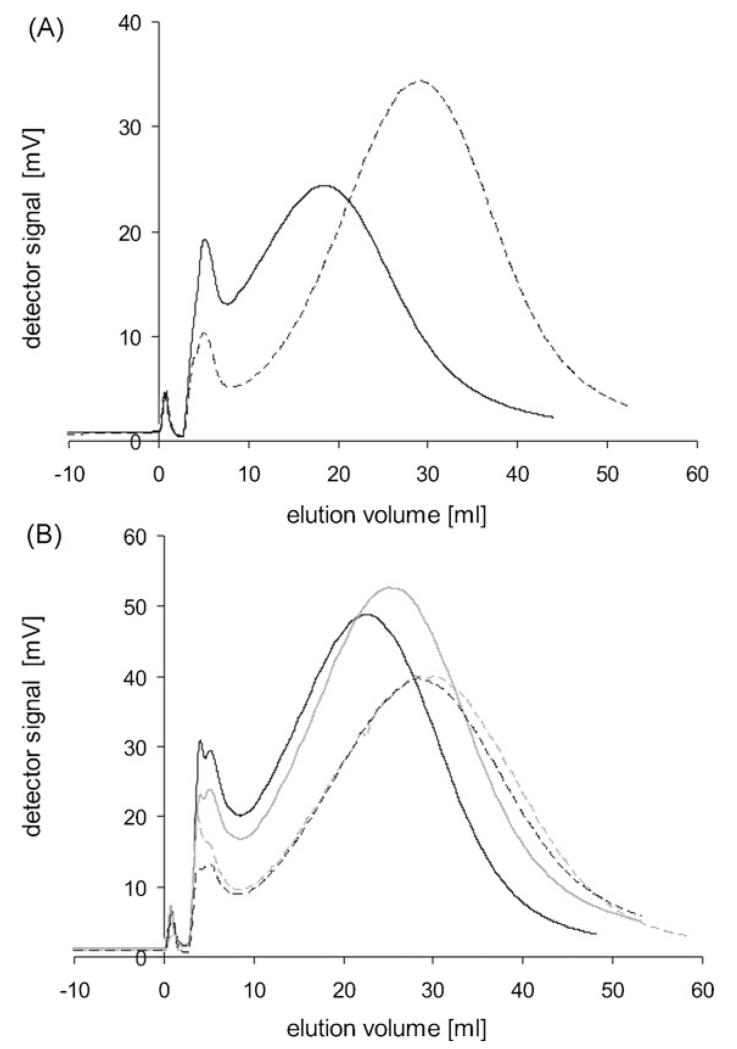
Fig. 4 shows the elution peaks of prepared IBs from Cult1. Cult1 was sampled hourly, starting 1 h after induction (sample identifier 23). Samples 23 and 24 (Fig. 4A) were not adequately retarded at 170 rpm, thus a stronger sedimentation field (240 rpm) had to be applied to these samples. All elution peaks showed a Gaussian shape, indicating homogenous size distributions, whereby a part of the peak width is due to the instrumental band broadening. The median IB size increased during the course of cultivation from 276 nm, one hour after induction, to 414 nm, at the end of cultivation (Table 2). The size increase positively correlated with an increase in the concentration of β-lactamase during the induction phase.
Fig. 4.
Elution peaks of Cult1 IBs at 240 rpm (samples 23 and 24) and at 170 rpm (samples 25–28). (A) Solid black line 240 rpm: sample 23 (1 h after induction); dashed black line 240 rpm: sample 24. (B) 170 rpm; solid black: sample 25; solid grey: sample 26, dashed black: sample 27; dashed grey: sample 28 (6 h after induction).
Table 2.
Size and mass of IBs, sampled at different time points after induction, calculated from the elution peaks
| Identifier | Time after induction (h) | Ysoluble/X (mg g−1 ) | YIB/X (mg g−1) | Elution volume (ml) | IB mass (×10−14g) | Median spherical diameter (nm) |
|---|---|---|---|---|---|---|
| Cult1 | ||||||
| 23 | 1 | 5 | 30 | 18.4 (240 rpm) | 1.46 | 276 |
| 24 | 2 | ≤3 | 82 | 29.1 (240 rpm) | 2.41 | 326 |
| 25 | 3 | ≤3 | 110 | 22.5 | 3.64 | 374 |
| 26 | 4 | ≤3 | 122 | 25.4 | 4.13 | 390 |
| 27 | 5 | ≤3 | 137 | 28.7 | 4.69 | 407 |
| 28 | 6 | ≤3 | 142 | 29.2 | 4.80 | 410 |
| 29 | 7 | ≤3 | 157 | 30.0 | 4.94 | 414 |
| Cult2 | ||||||
| 12 | 4 | ≤3 | 113 | 20.1 (shoulder) | 3.22 | 359 |
| 12 | 4 | 33.7 | 5.61 | 432 | ||
| 16 | 8 | ≤3 | 156 | 35.3 | 5.89 | 439 |
| 20 | 12 | ≤3 | 205 | 42.8 | 7.18 | 469 |
| 24 | 16 | ≤3 | 212 | 44.7 | 7.51 | 476 |
| 29 | 21 | ≤3 | 187 | 52.3 | 8.81 | 502 |
| Cult3 | ||||||
| 14 | 6 | 56 | 25 | 29.0 | 4.76 | 409 |
| 16 | 8 | 84 | 59 | 30.4 | 5.01 | 416 |
| 18 | 10 | 87 | 91 | 30.0 | 4.94 | 414 |
| 20 | 12 | 92 | 129 | 35.6 | 5.93 | 440 |
| 22 | 14 | 87 | 168 | 37.2 | 6.22 | 447 |
| 24 | 16 | 83 | 191 | 38.5 | 6.43 | 452 |
| 26 | 18 | 82 | 200 | 40.3 | 6.73 | 459 |
| 28 | 20 | 77 | 181 | 41.1 | 6.87 | 462 |
YIB/X is the specific recombinant protein concentration in IBs per g BDM, Ysoluble/X is the specific recombinant protein concentration in soluble form per g BDM. All Cult1 samples, except 23 and 24, were eluted at 170 rpm in sedFFF.
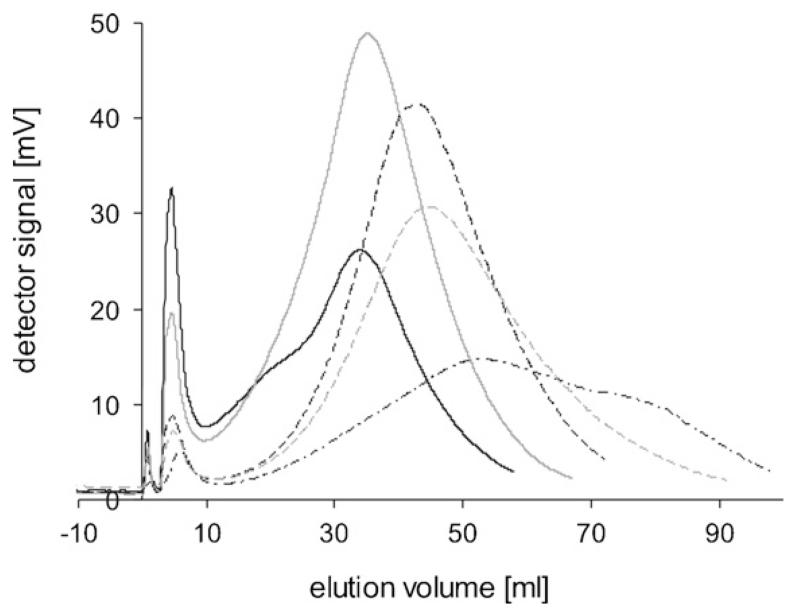
The elution profiles of Cult2 (Fig. 5) showed that IB sizes increased during the course of the induction phase. However, the peak profiles were quite different from the Cult1 profiles. Samples 12 (from the early phase) and 29 (from the late induction phase), showed distinct shoulders. Sample 24 deviated from a Gaussian distribution with a peak tailing to higher IB masses. At the end of the cultivation (sample 29), the elution peak was at 52.3 ml, corresponding to an IB size of 502 nm with a shoulder at 75 ml, corresponding to 570 nm.
Fig. 5.
Elution peaks of Cult2 IBs at 170 rpm. Solid black line: sample 12 (4 h after induction) with a distinct shoulder at 20.1 ml elution volume and a peak at 33.7 ml; solid grey: sample 16; dashed black: sample 20; dashed grey: sample 24; dotted black: sample 29 (end of cultivation, 21 h of induction) with a broad shoulder at 75 ml elution volume.
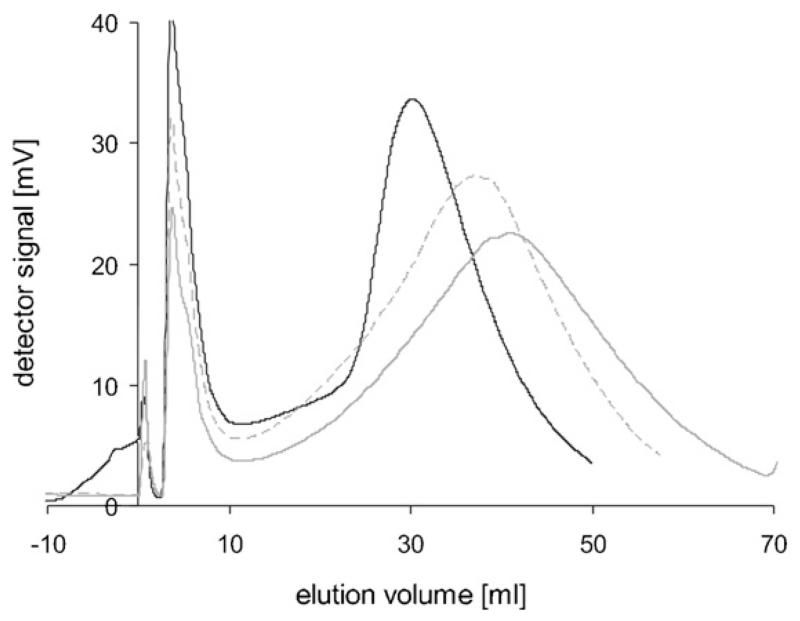
Cult3 samples also showed different elution profiles (Fig. 6 shows three characteristic elution profiles). Samples 14–18 showed non-Gaussian peak profiles. Sample 28, taken at the end of the cultivation, had no shoulder and a smaller distribution compared to Cult2. IBs of the end sample had a median diameter of 462 nm.
Fig. 6.
Significant elution peaks of Cult3 IBs. Solid black line: sample 18 (10 h after induction) with a non-Gaussian peak profile; dashed grey: sample 22; solid grey: sample 28 (20 h after induction).
SedFFF analyses of IBs from the different fed-batch cultivations showed different size distributions. The Cult1 IBs increased in size during the course of protein expression. This correlated to the increase of the specific protein concentration per biomass (Table 2) and was expected for a full-induction process. Due to the high concentration of IPTG, cells immediately started to express the recombinant protein and also stopped growing (Fig. 1A). For this reason, the size distribution of IBs in all samples was homogeneous.
The IB size distribution of part-induction processes brought interesting insights into these cultivation procedures. It may be worth investigating them in a more expanded experiment. In this vein, however, Cult3 cultivation may be informative. This cultivation was run at 30 °C with a low concentration of IPTG to express a proportion of the β-lactamase into the soluble fraction. In the early phase of expression, most of the recombinant protein was found in its soluble form and we expected the IBs to be small. The sedFFF elution profiles indicated that the IBs were large. Gel electrophoresis showed a high content of contaminating protein in the IBs of early samples with a very strong band at 38 kDa. Samples 14, 16 and 18 consisted of 34%, 48% and 65% β-lactamase respectively (data not shown). During the course of cultivation, the β-lactamase content of IBs increased to 90%. Cult1 and Cult2 IBs had a recombinant protein content of at least 85% in all investigated samples. This phenomenon must be considered when interpreting the size distribution of IBs over the course of cultivations.
4. Conclusion
In this work we showed that sedFFF could be reliably used to characterize the size distribution of bacterial IBs. In combination with electron microscopy, the density of IBs was determined. Studying the IB size distributions during different fed-batch cultivations revealed new insights into the expression of IB forming recombinant proteins, particularly at low inducer concentrations. Part-induction strategies resulted in higher overall protein yields, but IB size distributions were broader. This method can be used to rapidly assess the composition of a sample more quickly than with elaborate imaging methods currently available. SedFFF proved to be an excellent tool to study IB forming processes.
Acknowledgements
This work was supported by a scholarship from the Akademisch Soziale Arbeitsgemeinschaft Österreichs (ASAG) to fund my stay in Uppsala. This work was also supported by the Austrian Science Fund FWF (project: L191-B10) and the Austrian Center of Biopharmaceutical Technology (ACBT). Special thanks to the Surface Biotechnology Group, headed by Prof. Karin Caldwell, where I was so well received. Thanks to the University of Uppsala for admittance.
Abbreviations
- SedFFF
Sedimentation field-flow fractionation
- IB
inclusion body
- IPTG
isopropyl-β-d-thiogalactopyranoside
- BDM
biomass dry matter
- SDS-PAGE
sodium dodecyl sulphate polyacryl gel electrophoresis
- Trp
tryptophan
References
- Ami D, Natalello A, Taylor G, Tonon G, Doglia MS. Structural analysis of protein inclusion bodies by Fourier transform infrared microspectroscopy. Biochim. Biophys. Acta. 2006;1764:793–799. doi: 10.1016/j.bbapap.2005.12.005. [DOI] [PubMed] [Google Scholar]
- Black DL, McQuay MQ, Bonin MP. Laser-based techniques for particle-size measurement: a review of sizing methods and their industrial applications. Prog. Energ. Combust. 1996;22:267–306. [Google Scholar]
- Bowden GA, Paredes AM, Georgiou G. Structure and morphology of protein inclusion bodies in Escherichia coli. Biotechnology (New York) 1991;9:725–730. doi: 10.1038/nbt0891-725. [DOI] [PubMed] [Google Scholar]
- Carrió MM, Villaverde A. Localization of chaperones DnaK and GroEL in bacterial inclusion bodies. J. Bacteriol. 2005;187:3599–3601. doi: 10.1128/JB.187.10.3599-3601.2005. [DOI] [PMC free article] [PubMed] [Google Scholar]
- de Groot NS, Ventura S. Protein activity in bacterial inclusion bodies correlates with predicted aggregation rates. J. Biotechnol. 2006;125:110–113. doi: 10.1016/j.jbiotec.2006.02.026. [DOI] [PubMed] [Google Scholar]
- Fischer H, Polikarpov I, Craievich AF. Average protein density is a molecular-weight-dependent function. Protein Sci. 2004;13:2825–2828. doi: 10.1110/ps.04688204. [DOI] [PMC free article] [PubMed] [Google Scholar]
- Garcia-Fruitos E, Aris A, Villaverde A. Localization of functional polypeptides in bacterial inclusion bodies. Appl. Environ. Microbiol. 2007;73:289–294. doi: 10.1128/AEM.01952-06. [DOI] [PMC free article] [PubMed] [Google Scholar]
- Garcia-Fruitos E, Gonzalez-Montalban N, Morell M, Vera A, Ferraz RM, Aris A, Ventura S, Villaverde A. Aggregation as bacterial inclusion bodies does not imply inactivation of enzymes and fluorescent proteins. Microb. Cell Fact. 2005;4:27. doi: 10.1186/1475-2859-4-27. [DOI] [PMC free article] [PubMed] [Google Scholar]
- Georgiou G, Telford JN, Shuler ML, Wilson DB. Localization of inclusion bodies in Escherichia coli overproducing beta-lactamase or alkaline phosphatase. Appl. Environ. Microbiol. 1986;52:1157–1161. doi: 10.1128/aem.52.5.1157-1161.1986. [DOI] [PMC free article] [PubMed] [Google Scholar]
- Giddings JC. Field-flow fractionation of macromolecules. J. Chromatogr. 1989;470:327–335. doi: 10.1016/s0021-9673(01)83561-5. [DOI] [PubMed] [Google Scholar]
- Giddings JC, Moon MH. Measurement of particle density, porosity, and size distributions by sedimentation steric field-flow fractionation—application to chromatographic supports. Anal. Chem. 1991;63:2869–2877. [Google Scholar]
- Giddings JC, Yang FJF, Myers MN. Sedimentation field-flow fractionation. Anal. Chem. 1974;46:1917–1924. [Google Scholar]
- Hayat MA, Miller SE. Negative Staining. McGraw-Hill; New York: 1990. [Google Scholar]
- Khan RH, Rao KB, Eshwari AN, Totey SM, Panda AK. Solubilization of recombinant ovine growth hormone with retention of native-like secondary structure and its refolding from the inclusion bodies of Escherichia coli. Biotechnol. Prog. 1998;14:722–728. doi: 10.1021/bp980071q. [DOI] [PubMed] [Google Scholar]
- Li JM, Caldwell KD, Machtle W. Particle characterization in centrifugal fields—comparison between ultracentrifugation and sedimentation field-flow fractionation. J. Chromatogr. 1990;517:361–376. doi: 10.1016/s0021-9673(01)95734-6. [DOI] [PubMed] [Google Scholar]
- Luo J, Leeman M, Ballagi A, Elfwing A, Su Z, Janson JC, Wahlund KG. Size characterization of green fluorescent protein inclusion bodies in E. coli using asymmetrical flow field-flow fractionation-multi-angle light scattering. J. Chromatogr. A. 2006;1120:158–164. doi: 10.1016/j.chroma.2005.11.048. [DOI] [PubMed] [Google Scholar]
- Schimpf M, Caldwell KD, Giddings C. Field Flow Fractionation Handbook. John Wiley & Sons; 2000. [Google Scholar]
- Oberg K, Chrunyk BA, Wetzel R, Fink AL. Native-like secondary structure in interleukin-1 beta inclusion bodies by attenuated total reflectance FTIR. Biochemistry. 1994;33:2628–2634. doi: 10.1021/bi00175a035. [DOI] [PubMed] [Google Scholar]
- Panda AK. Bioprocessing of therapeutic proteins from the inclusion bodies of Escherichia coli. Adv. Biochem. Eng. Biotechnol. 2003;85:43–93. doi: 10.1007/3-540-36466-8_3. [DOI] [PubMed] [Google Scholar]
- Patra AK, Mukhopadhyay R, Mukhija R, Krishnan A, Garg LC, Panda AK. Optimization of inclusion body solubilization and renaturation of recombinant human growth hormone from Escherichia coli. Protein Exp. Purif. 2000;18:182–192. doi: 10.1006/prep.1999.1179. [DOI] [PubMed] [Google Scholar]
- Rinas U, Bailey JE. Protein compositional analysis of inclusion bodies produced in recombinant Escherichia coli. Appl. Microbiol. Biotechnol. 1992;37:609–614. doi: 10.1007/BF00240735. [DOI] [PubMed] [Google Scholar]
- Striedner G, Cserjan-Puschmann M, Pötschacher F, Bayer K. Tuning the transcription rate of recombinant protein in strong Escherichia coli expression systems through repressor titration. Biotechnol. Prog. 2003;19:1427–1432. doi: 10.1021/bp034050u. [DOI] [PubMed] [Google Scholar]
- Studier FW, Maizel JV., Jr. T7-directed protein synthesis. Virology. 1969;39:575–586. doi: 10.1016/0042-6822(69)90105-6. [DOI] [PubMed] [Google Scholar]
- Taylor G, Hoare M, Gray DR, Marston FAO. Size and density of protein inclusion-bodies. Biotechnology. 1986;4:553–557. [Google Scholar]
- Valax P, Georgiou G. Molecular characterization of beta-lactamase inclusion bodies produced in Escherichia coli 1. Composition. Biotechnol. Prog. 1993;9:539–547. doi: 10.1021/bp00023a014. [DOI] [PubMed] [Google Scholar]


