

Abstract
Variability in gene expression among genetically identical cells has emerged as a central preoccupation in the study of gene regulation; however, a divide exists between the predictions of molecular models of prokaryotic transcriptional regulation and genome-wide experimental studies suggesting that this variability is indifferent to the underlying regulatory architecture. We constructed a set of promoters in Escherichia coli in which promoter strength, transcription factor binding strength, and transcription factor copy numbers are systematically varied, and used messenger RNA (mRNA) fluorescence in situ hybridization to observe how these changes affected variability in gene expression. Our parameter-free models predicted the observed variability; hence, the molecular details of transcription dictate variability in mRNA expression, and transcriptional noise is specifically tunable and thus represents an evolutionarily accessible phenotypic parameter.
The single-molecule events underlying gene expression, such as transcription factor binding and unbinding or RNA polymerase (RNAP) open complex formation, are inherently stochastic—a stochasticity inherited by gene expression itself. Over the past decade, theorists have sought to elucidate how changes in molecular kinetic parameters such as transcription factor binding and unbinding rates affect variability in expression (1, 2), whereas experimentalists have measured variability in gene expression at both the mRNA and protein level in prokaryotes and eukaryotes (3–6). Possible phenotypic consequences (4, 7–9) include the intriguing hypothesis that transcriptional noise may increase the fitness of microbial populations by providing phenotypic variability in a population of genetically identical cells (10, 11).
Models of transcription hinge on the molecular details of the promoter architecture (where “promoter architecture” refers collectively to the locations and strengths of transcription factor and RNAP binding sites governing a particular gene) and make quantitative predictions for the dependence of the variability on these details. For example, two extremely common promoter architectures (12) are shown schematically in Fig. 1A. Here, each rate parameter (r, , , and γ) has a physical interpretation (Fig. 1B) as an element that can be tuned independently by genetic manipulation. The effect of promoter architecture on mean levels of gene expression is well established in prokaryotes, where thermodynamic models successfully predict gene expression as a function of promoter architecture (13–15). However, the associated predictions for how transcriptional noise depends on these parameters remain untested in any systematic way. In direct contrast to such models, some high-throughput experiments have culminated in the assertion that the cell-to-cell variability in gene expression is “universal,” dictated solely by the mean level of expression and insensitive to the details of the promoter driving the expression (3, 5, 6).
Fig. 1. Schematics of the kinetics of transcription for two simple regulatory architectures.
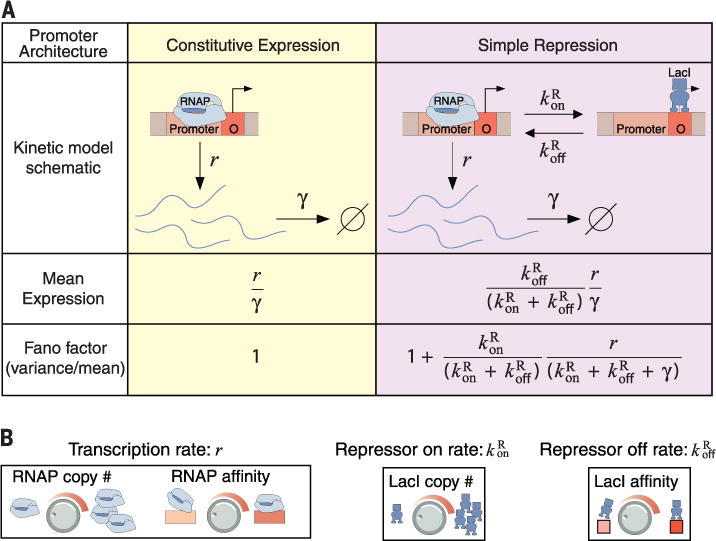
(A) Theoretical treatment of two common promoter architectures and the predicted expression (both mean and variability) as a function of the relevant rate parameters. (B) Examples of the experimental knobs available for tuning the various model rate parameters: Basal transcription rate r is tuned by RNAP copy number and RNAP binding site affinity (left); repressor binding rate is tuned by repressor copy number (center); and repressor unbinding rate is tuned by its binding site affinity (right).
To confront this divide, we constructed a library of synthetic promoters driving a LacZ reporter in E. coli and measured the resulting mRNA copy number distributions using single-molecule mRNA fluorescence in situ hybridization (FISH) (16). Our approach ensures that differences in promoter sequence between constructs have clear interpretations in terms of the molecular parameters underlying transcription (e.g., transcription factor unbinding rate, basal transcription rate). This allows us to directly compare predictions of models incorporating those parameters with experimentally observed mRNA distributions, and hence to directly link the molecular events underlying transcription with observed variability in gene expression.
For the case of constitutive expression, shown schematically in Fig. 1A, mRNA transcripts are produced and degraded stochastically at rates r and γ, respectively, with constant probability per unit time. It can be shown (17) that the resulting steady-state mRNA copy number distribution is given by a Poisson distribution with mean r/γ. In the following experimental results, we use the Fano factor, defined as the variance divided by the mean, to characterize variability in gene expression. This metric reports the fold change in the squared coefficient of variation (CV2 = variance/mean2) with respect to a Poisson process, for which ; hence, . Therefore, the predicted Fano factor for constitutive expression equals 1 identically. However, this analysis is incomplete: The schematics of Fig. 1A represent the dynamics of the stochastic processes (transcription factor binding and unbinding, mRNA degradation, transcription initiation) that contribute to so-called “intrinsic” variability in gene expression, but do not account for the fact that rate parameters such as the repressor binding rate and transcription rate r are themselves subject to fluctuations due to cell-to-cell variability in repressor and RNAP copy numbers, respectively. Such effects, collectively termed “extrinsic variability,” tend to increase the measured variability (18).
One important contribution to extrinsic noise comes from variability in gene copy number due to chromosome replication (Fig. 2A, bottom panel). It can be shown (16) that the effect of gene copy number variation on the variability in expression is independent and additive to the variability predicted from transcriptional noise, such that
| (1) |
where 〈m〉1 is the mean mRNA copy number from a single gene copy, and f is the fraction of the time a cell has two copies of the gene of interest. The first term is simply the promoter architecture–dependent Fano factor of a single copy of a gene, whereas the second term is the contribution due to gene copy number variation.
Fig. 2. Variability in gene expression for constitutive expression.
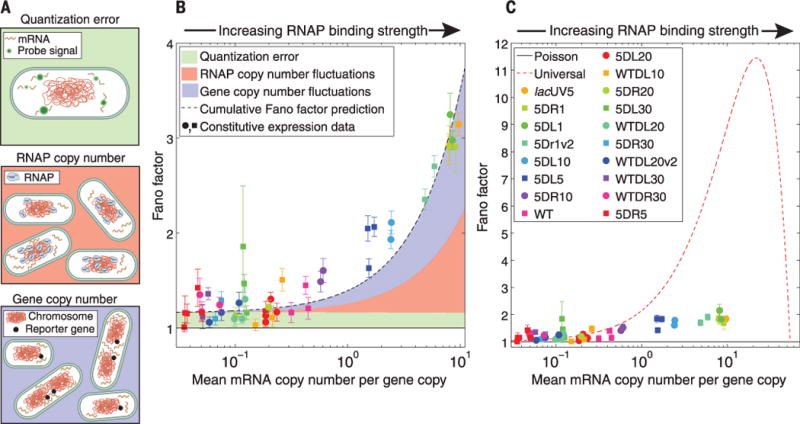
(A) Examples of additional noise sources (not accounted for in models of chemical kinetics) present in expression measurements. (B) Fano factor (gene copy number variation not subtracted) versus mean expression, plotted for each of 18 constitutive promoters along with estimates of the contributions shown schematically in (A). These factors can account for essentially the entirety of the deviation from Fano = 1. (C) Measured Fano factor for various promoters under constitutive expression, with gene copy number variation subtracted. For reference, the predictions of pure Poissonian production (black solid line) and the “universal noise” curve observed in (5) (red dashed) theories are shown. In (B) and (C), each strain is represented by a unique symbol, and each instance represents repeated measurements with error bars from bootstrap sampling expression measurements of individual cells.
To quantitatively test the predictions of the model for constitutive expression, we measured the mRNA copy number distribution using mRNA FISH for 18 unique constitutive promoters (19). In Fig. 2B, we plot the Fano factor versus mean expression for each of this set of promoters (see fig. S9 for full mRNA copy number distributions for each promoter). The solid black line is the prediction resulting from consideration of intrinsic noise alone. The shaded regions represent the effects of what we believe are the three most important additional sources of noise (16). The green shaded region, quantization error, is the variability introduced by our measurement and analysis process. The red shaded region covers the expected contribution from cell-to-cell differences in RNAP copy number; the blue region is the expected contribution from gene copy number variation. Note that the red shaded region is an indirect estimate based on literature sources, whereas the blue and green regions are supported by direct measurements (16). The data and theoretical predictions are in good accord, implying that the dynamics of constitutive transcription are Poissonian with some additional extrinsic noise. In Fig. 2C, we plot the Fano factor minus the predicted gene copy number contribution and observe a quantitative disagreement between the measured noise in expression and the prediction of the “universal” noise model as reported in (5). But to conclusively demonstrate the architecture dependence of the variability, we need to look at alternative regulatory architectures.
To that end, we consider an architecture in which transcription can be blocked by a repressor transcription factor. As shown in Fig. 1A, the promoter transitions from the transcriptionally active (repressor unbound) to inactive state (repressor bound) at rate , and from the inactive to active state at rate . The predicted mean expression and Fano factor depend on each of these rates (Fig. 1A, right half); we can tune by changing the concentration of repressor in the cell, and can tune by changing the repressor binding site sequence. Note that the predicted relationship between the mean and the Fano factor has a characteristic form depending on which of these rates is being tuned (Fig. 3, A and B, dashed lines).
Fig. 3. Variability in gene expression for systematic tuning of repression.
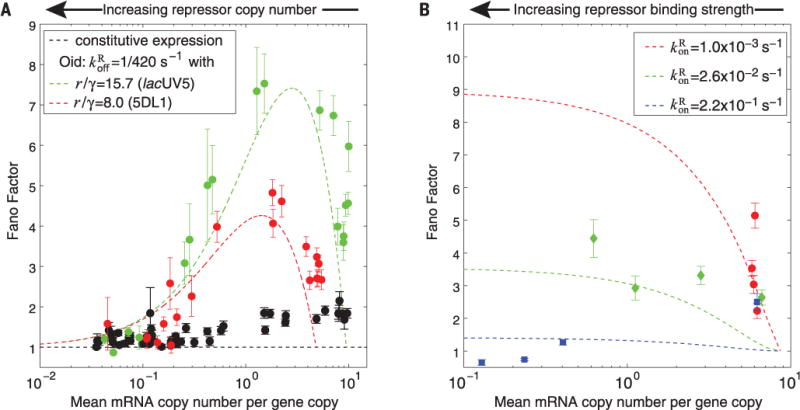
(A) Fano factor versus mean mRNA copy number for two promoters (choices of r/γ) while tuning by inducing LacI to varying levels. For reference, the black data are the constitutive data from Fig. 2. (B) Fano factor versus mean mRNA copy number for lacUV5 while tuning by changing repressor binding site identity at fixed repressor copy number; each color represents a different induction condition from red (lowest LacI induction) to blue (highest LacI induction). For both (A) and (B), the parameter-free predictions from kinetic theory are shown as dashed lines in the corresponding color, holding promoter (r/γ) and (A) repressor binding strength or (B) repressor binding rate constant. In both cases, the Fano factor at a given mean depends on the choice of molecular parameters and agrees with the expectations from theory. The effect of gene copy number variation was subtracted from all data points; error bars result from bootstrap sampling expression measurements of individual cells.
To test the predicted effect of changing , we took two of the constitutive promoters described above and placed them under simple repression via a LacI Oid binding site immediately downstream of the promoter (16). The difference in transcription rate for the two constructs is reflected in different values of r/γ. At the same time, we introduced into our cells a genetic circuit enabling inducible control of LacI expression, effectively permitting systematic changes in repressor number. In Fig. 3A, we plot the measured Fano factor as a function of the mean expression over LacI concentrations ranging from ~0 to 50 LacI molecules per cell, for both promoters. In addition, we plot the zero-free-parameter theoretical prediction for the Fano factor as a function of mean using the measured value of r/γ from the constitutive data and the LacI unbinding rate from (20).
Similarly, we vary by altering the sequence of the LacI binding site. Holding the RNAP binding site constant (and thus r/γ constant), we created constructs corresponding to four different LacI binding sites (16). At constant repressor concentration (i.e., constant ), tuning mean expression by altering is predicted to yield a characteristic curve, whereas different repressor concentrations (and hence values) correspond to distinct instances of this curve. In Fig. 3B, we plot the Fano factor resulting from changing at each of three different repressor concentrations. We find agreement in the trends between theory and experiment, although this agreement is less good than in the case of tuning . One possible explanation [reported in (20)] is that changing transcription factor–DNA binding affinity affects the transcription factor–DNA association rate as well as the dissociation rate , contrary to our assumption that is constant along each curve in Fig. 3B. However, the most important outcome of this set of measurements is a demonstration of the qualitatively distinct variability profile when a different set of transcriptional parameters are controlled, illustrating once again the systematic dependence of variability on promoter architecture.
We have shown that transcriptional noise is well predicted by molecularly detailed models for the two most common promoter architectures in E. coli as the various genetic knobs are tuned. This agreement is not the result of fitting theory curves to data, because the predicted curves are generated using physical parameter values reported elsewhere in the literature and in that sense are zero-parameter predictions. Earlier reports of “bursty” transcription (5, 21) are based on the observation that the Fano factor is greater than 1 for constitutive mRNA production (as well as direct kinetic measurements). Various explanatory hypotheses have been proposed, including transcriptional silencing via DNA condensation by nucleoid proteins (22), negative supercoiling induced by transcription, or the formation of long-lived “dead-end” initiation complexes (23). Although our data do not rule out these hypotheses, we find that extrinsic noise is sufficient to explain the deviation from Fano = 1 in our constitutive expression data (Fig. 2B). Thus, we find no need to invoke alternative hypotheses to explain the observed “burstiness” of constitutive transcription.
Many interesting earlier experiments make it difficult to interpret differences between promoters and induction conditions in terms of distinct physical parameters because of the wide variety of promoter architectures in play as well as the diverse mechanisms of induction. We have instead taken a “synthetic biology” approach of building promoters from the ground up. By directly controlling aspects of the promoter architecture, our goal has been to directly relate changes in promoter architecture to changes in observed gene expression variability. We believe that this work has demonstrated that mutations in regulatory DNA can alter gene expression noise. This suggests that gene expression noise may be a tunable property subject to evolutionary selection pressure, as mutations in regulatory DNA could provide greater fitness by increasing (or decreasing) variability. Demonstrating the relevance of this hypothesis in natural environments remains an ongoing challenge.
Supplementary Material
Acknowledgments
We thank H. J. Lee, C. Wiggins, Y. Lin, X. Zhu, F. Weinert, M. Rydenfelt, R. Milo, H. Garcia, N. Belliveau, and J. Sheung for useful discussions. Supported by NIH grants DP1 OD000217 (Directors Pioneer Award), R01 GM085286, and 1 U54 CA143869 (Northwestern PSOC Center); La Fondation Pierre Gilles de Gennes (R.P.); and the Donna and Benjamin M. Rosen Center for Bioengineering at Caltech (D.L.J.). Raw microscopy image data are archived in the Phillips laboratory at Caltech and are available upon request.
Footnotes
REFERENCES AND NOTES
- 1.Paulsson J, Ehrenberg M. Phys Rev Lett. 2000;84:5447–5450. doi: 10.1103/PhysRevLett.84.5447. [DOI] [PubMed] [Google Scholar]
- 2.Sanchez A, Garcia HG, Jones D, Phillips R, Kondev J. PLOS Comput Biol. 2011;7:e1001100. doi: 10.1371/journal.pcbi.1001100. [DOI] [PMC free article] [PubMed] [Google Scholar]
- 3.Taniguchi Y, et al. Science. 2010;329:533–538. doi: 10.1126/science.1188308. [DOI] [PMC free article] [PubMed] [Google Scholar]
- 4.Blake WJ, et al. Mol Cell. 2006;24:853–865. doi: 10.1016/j.molcel.2006.11.003. [DOI] [PubMed] [Google Scholar]
- 5.So LH, et al. Nat Genet. 2011;43:554–560. doi: 10.1038/ng.821. [DOI] [PMC free article] [PubMed] [Google Scholar]
- 6.Salman H, et al. Phys Rev Lett. 2012;108:238105. doi: 10.1103/PhysRevLett.108.238105. [DOI] [PubMed] [Google Scholar]
- 7.Maamar H, Raj A, Dubnau D. Science. 2007;317:526–529. doi: 10.1126/science.1140818. [DOI] [PMC free article] [PubMed] [Google Scholar]
- 8.Eldar A, Elowitz MB. Nature. 2010;467:167–173. doi: 10.1038/nature09326. [DOI] [PMC free article] [PubMed] [Google Scholar]
- 9.Süel GM, Kulkarni RP, Dworkin J, Garcia-Ojalvo J, Elowitz MB. Science. 2007;315:1716–1719. doi: 10.1126/science.1137455. [DOI] [PubMed] [Google Scholar]
- 10.Thattai M, van Oudenaarden A. Genetics. 2004;167:523–530. doi: 10.1534/genetics.167.1.523. [DOI] [PMC free article] [PubMed] [Google Scholar]
- 11.Kussell E, Leibler S. Science. 2005;309:2075–2078. doi: 10.1126/science.1114383. [DOI] [PubMed] [Google Scholar]
- 12.Salgado H, et al. Nucleic Acids Res. 2013;41:D203–D213. doi: 10.1093/nar/gks1201. [DOI] [PMC free article] [PubMed] [Google Scholar]
- 13.Bintu L, et al. Curr Opin Genet Dev. 2005;15:125–135. doi: 10.1016/j.gde.2005.02.006. [DOI] [PMC free article] [PubMed] [Google Scholar]
- 14.Kuhlman T, Zhang Z, Saier MH, Jr, Hwa T. Proc Natl Acad Sci USA. 2007;104:6043–6048. doi: 10.1073/pnas.0606717104. [DOI] [PMC free article] [PubMed] [Google Scholar]
- 15.Vilar JM, Leibler S. J Mol Biol. 2003;331:981–989. doi: 10.1016/s0022-2836(03)00764-2. [DOI] [PubMed] [Google Scholar]
- 16.See supplementary materials on Science Online.
- 17.Sánchez A, Kondev J. Proc Natl Acad Sci USA. 2008;105:5081–5086. doi: 10.1073/pnas.0707904105. [DOI] [PMC free article] [PubMed] [Google Scholar]
- 18.Swain PS, Elowitz MB, Siggia ED. Proc Natl Acad Sci USA. 2002;99:12795–12800. doi: 10.1073/pnas.162041399. [DOI] [PMC free article] [PubMed] [Google Scholar]
- 19.Brewster RC, Jones DL, Phillips R. PLOS Comput Biol. 2012;8:e1002811. doi: 10.1371/journal.pcbi.1002811. [DOI] [PMC free article] [PubMed] [Google Scholar]
- 20.Hammar P, et al. Science. 2012;336:1595–1598. doi: 10.1126/science.1221648. [DOI] [PubMed] [Google Scholar]
- 21.Golding I, Paulsson J, Zawilski SM, Cox EC. Cell. 2005;123:1025–1036. doi: 10.1016/j.cell.2005.09.031. [DOI] [PubMed] [Google Scholar]
- 22.Sanchez A, Choubey S, Kondev J. Annu Rev Biophys. 2013;42:469–491. doi: 10.1146/annurev-biophys-083012-130401. [DOI] [PubMed] [Google Scholar]
- 23.Mitarai N, Dodd IB, Crooks MT, Sneppen K. PLOS Comput Biol. 2008;4:e1000109. doi: 10.1371/journal.pcbi.1000109. [DOI] [PMC free article] [PubMed] [Google Scholar]
Associated Data
This section collects any data citations, data availability statements, or supplementary materials included in this article.