

Abstract
At the pyruvate branch point, the fermentative and oxidative metabolic routes diverge. Pyruvate can be transformed either into lactate in mammalian cells or into ethanol in yeast, or transported into mitochondria to fuel ATP production by oxidative phosphorylation. The recently discovered mitochondrial pyruvate carrier (MPC), encoded by MPC1, MPC2, and MPC3 in yeast, is required for uptake of pyruvate into the organelle. Here, we show that while expression of Mpc1 is not dependent on the carbon source, expression of Mpc2 and Mpc3 is specific to fermentative or respiratory conditions, respectively. This gives rise to two alternative carrier complexes that we have termed MPCFERM and MPCOX. By constitutively expressing the two alternative complexes in yeast deleted for all three endogenous genes, we show that MPCOX has a higher transport activity than MPCFERM, which is dependent on the C-terminus of Mpc3. We propose that the alternative MPC subunit expression in yeast provides a way of adapting cellular metabolism to the nutrient availability.
Keywords: metabolism, mitochondria, mitochondrial pyruvate carrier, pyruvate branch point
See also: H Rampelt & M van der Laan (April 2015)
Introduction
Pyruvate is a critical cellular metabolite that is the end product of glycolysis and has two major metabolic fates. In mammalian cells, it can be reduced by lactate dehydrogenase, thereby restoring the cellular pool of NAD+ that is needed to keep glycolysis running. If this pathway is used, the net energy yield is only the two molecules of ATP per molecule of glucose obtained through glycolysis. Alternatively, pyruvate can be transported into mitochondria and oxidized by the pyruvate dehydrogenase complex (PDH) to enter the TCA cycle. Through oxidative phosphorylation, more than 30 ATP molecules per molecule of glucose can be produced inside mitochondria. Pyruvate is thus located at a key metabolic branch point, and how pyruvate is processed has a major influence on the overall metabolism of the cell (Gray et al, 2013).
Although counterintuitive at first glance, many cancer cells rely primarily on glycolysis for energy production. This phenomenon has been described as early as 1924 by Otto Warburg and is now referred to as the “Warburg effect” (reviewed by Koppenol et al, 2011). The paradox that rapidly proliferating cells preferentially use an inefficient way of energy production can be explained by the high availability of glucose in multicellular organisms. More precisely, it is not ATP production, but the synthesis of biomolecules that are required for biomass expansion, like amino acids, lipids, and nucleotides, which appears to be the limiting factor for rapidly dividing cells and is favored by a high rate of glycolysis (Vander Heiden et al, 2009). Remarkably, the situation in cancer cells is reminiscent of that in some rapidly proliferating microorganisms when grown in an excess of nutrients. The unicellular model organism Saccharomyces cerevisiae (baker's yeast), for example, shows the so-called Crabtree effect (De Deken, 1966), according to which glucose is preferentially fermented to produce ethanol, even in the presence of oxygen. As yeast can shift readily between fermentative and oxidative metabolism dependent on the carbon source available, it has been suggested to be an ideal simple model to study the metabolic reprogramming associated with the shift toward aerobic fermentation (Diaz-Ruiz et al, 2011).
Consistent with this, many common features regarding metabolic enzyme composition are shared between cancer cells and fermenting yeast (Diaz-Ruiz et al, 2009). At the pyruvate branch point, pyruvate decarboxylase (PDC) in fermenting yeast and lactate dehydrogenase in cancer cells are hyperactive, favoring the production of ethanol or lactate, respectively (Van Urk et al, 1990; Rong et al, 2013). In addition to overexpression of the enzyme, yeast PDC is activated by phosphorylation (de Assis et al, 2013), while yeast PDH, responsible for the conversion of pyruvate to acetyl-CoA inside mitochondria, is inactivated by phosphorylation. PDH activity is controlled by two kinases and two phosphatases, homologs of which are also present in mammalian mitochondria (Krause-Buchholz et al, 2006; Gey et al, 2008). In mammals, PDH was shown to be activated during oncogene-induced senescence (Kaplon et al, 2013), and these authors concluded that cancer cells require inactive PDH in order to proliferate.
While the enzymes at the pyruvate branch point have been extensively studied, less is known about the machinery that mediates pyruvate uptake into the mitochondrial matrix. Like most metabolites, pyruvate is believed to cross the mitochondrial outer membrane through the porins, the homologs of the voltage-dependent anion channel (VDAC) in yeast (Lee et al, 1998). While the existence of a mitochondrial pyruvate carrier (MPC) in the mitochondrial inner membrane has been known for many years (Papa et al, 1971; Halestrap & Denton, 1974), its molecular identity has only recently been discovered (Bricker et al, 2012; Herzig et al, 2012). In S. cerevisiae, the carrier is encoded by three homologous genes (MPC1, MPC2, and MPC3), while only two genes have been identified in mammals and flies. Recently, an MPC has also been described in plants (Li et al, 2014). The gene products are conserved mitochondrial inner membrane proteins that migrate on Blue Native PAGE (BN-PAGE) as a complex of ∽150 kDa (Bricker et al, 2012). MPC proteins are required for pyruvate import into isolated mitochondria (Bricker et al, 2012; Herzig et al, 2012). Moreover, mouse MPC1 and MPC2 could be functionally reconstituted in Lactococcus lactis, showing that the two protein components are also sufficient for pyruvate uptake (Herzig et al, 2012). While the exact stoichiometry of the MPC subunits has not been determined, a very recent structural analysis of bacterial SemiSWEET transporters (Xu et al, 2014), which share some similarity with MPC proteins, suggests that the MPC may be a dimer.
In yeast, mitochondrial pyruvate is the precursor for biosynthesis of branched-chain amino acids (BCAA) (Kohlhaw, 2003), and thus, growth in the absence of leucine and valine provides a means of monitoring MPC activity (Bricker et al, 2012; Herzig et al, 2012). Since MPC2 and MPC3 are about 80% identical, and either gene in combination with MPC1 is sufficient for growth in medium lacking BCAA, it was proposed that their function could be redundant (Bricker et al, 2012; Herzig et al, 2012). MPC3 gene expression, however, has previously been shown to be induced by the non-fermentable carbon source glycerol (Timón-Gómez et al, 2013), implying that MPC subunit composition is subject to regulation. If and how mitochondrial pyruvate uptake is generally regulated and whether this regulation might participate in the metabolic reprogramming occurring during the Warburg and Crabtree effects remain to be determined.
In this work, we have investigated mitochondrial pyruvate uptake in S. cerevisiae. We show that, depending on the carbon source, yeast cells express two different complexes containing either Mpc1 and Mpc2 (MPCFERM) or Mpc1 and Mpc3 (MPCOX). Furthermore, by using constitutive promoters in a triple mpc deletion strain, we have expressed MPCFERM and MPCOX under the same growth conditions to compare their respective pyruvate transport activities. We demonstrate that transport activity of MPCOX is significantly higher than that of MPCFERM and that the C-terminal domain of Mpc3 is largely responsible for the higher activity. We thus conclude that the subunit composition of the MPC is responsive to the nutrient status of the environment and plays a role in regulating the metabolic decision at the pyruvate branch point.
Results
Yeast cells express alternative MPC complexes depending on the carbon source
We chose the yeast S. cerevisiae as a model organism to investigate regulation of the MPC because yeast cells use either fermentative or oxidative metabolism depending on the carbon source that is provided in the growth medium. This allows an experimental setup in which the fate of pyruvate can be determined experimentally. In the presence of glucose, pyruvate is decarboxylated by PDC, which is the entry point into fermentation. On the other hand, when yeast is grown in a non-fermentable carbon source like glycerol, the majority of pyruvate is taken up into mitochondria by the MPC (Pronk et al, 1996). We therefore sought to determine the expression pattern of the MPC subunits depending on the carbon source present in the growth medium. We isolated mitochondria from yeast strains in which Mpc1, Mpc2, or Mpc3 had been fused C-terminally to a 3HA-tag but were expressed from their endogenous promoters (Herzig et al, 2012). Cells were grown in rich medium containing either glucose (YPD) or glycerol (YPG). When we analyzed MPC subunit expression by Western blot, we found that Mpc1 was expressed in both conditions, while Mpc2 and Mpc3 were expressed selectively in either fermentative or respiratory conditions, respectively (Fig1A). While Mpc3 was completely absent in YPD, a faint trace of Mpc2 could be detected in YPG.
Figure 1.
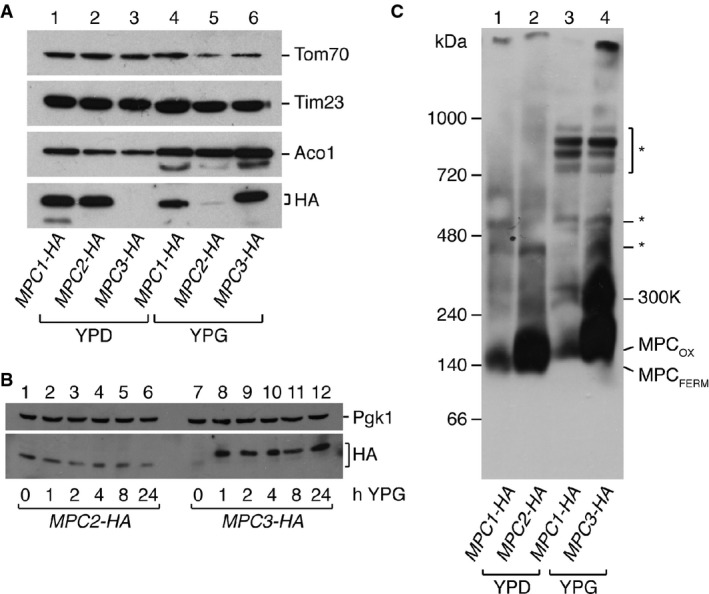
- Mpc1 and Mpc2 are present under fermentative conditions, while Mpc1 and Mpc3 are present under respiratory conditions. MPC subunits were detected by Western blot in mitochondria isolated from yeast cells grown in glucose (YPD) or glycerol (YPG). Mitochondrial matrix protein aconitase (Aco1), 23-kDa translocase of the inner membrane subunit (Tim23), and 70-kDa translocase of the outer membrane subunit (Tom70) were used as loading controls.
- Kinetics of the switch from Mpc2 to Mpc3. Yeast cells were grown in YPD until mid-log phase and then shifted to YPG medium. Whole cell extracts were taken at the indicated time points after the shift, and HA-tagged Mpc2 and Mpc3 detected by Western blotting. Mpc3 is induced very rapidly by switch from YPD to YPG, while Mpc2 levels decrease only gradually.
- Alternative pyruvate carrier complexes MPCFERM and MPCOX are detected by BN-PAGE. Isolated mitochondria expressing HA-tagged MPC proteins were run on blue native gels, and MPC complexes detected with an HA-specific antibody. MPCFERM consisting of Mpc1 and Mpc2 is present under fermentative conditions, and MPCOX consisting of Mpc1 and Mpc3 is present under respiratory conditions. In addition, a complex of ˜300 kDa is observed under respiratory conditions that contains Mpc1 and Mpc3. Non-specific reactivity of the anti-HA antibody toward respiratory chain complexes that are highly abundant in oxidative growth conditions is denoted by an asterisk (*).
Because mitochondrial pyruvate is also the precursor for biosynthesis of BCAA, MPC deletion mutants show slower growth in media lacking leucine and valine (Supplementary Fig S1A; Bricker et al, 2012; Herzig et al, 2012). We thus checked whether growth in glucose-containing synthetic medium lacking all amino acids (SD−AA) had any effect on MPC subunit expression pattern. Interestingly, under these conditions, we observed an increase in Mpc2 abundance (Supplementary Fig S1B). However, we found no difference compared with synthetic medium containing amino acids (SD+AA). Mpc3 was not detected in either growth condition (Supplementary Fig S1B), once more implying that a non-fermentable carbon source is needed for the induction of this subunit. In conclusion, yeast mitochondria express Mpc1 and Mpc2 during fermentative growth and Mpc1 and Mpc3 under respiratory conditions, while the availability of BCAA had no effect on subunit expression.
Next, we decided to investigate the kinetics of Mpc2 replacement by Mpc3 when yeast cells are shifted from glucose- to glycerol-containing medium. We grew MPC2-HA and MPC3-HA yeast in YPD until mid-log phase and then shifted them to YPG for up to 24 h. Remarkably, Mpc3-HA could be detected by Western blot as early as 1 h after the shift and increased only moderately from that time point on (Fig1B, lanes 7–12). Mpc2-HA, on the other hand, was found to decrease gradually over time (Fig1B, lanes 1–6).
As Mpc1 was previously shown to interact physically with Mpc2 (Bricker et al, 2012; Herzig et al, 2012), and since Mpc2 and Mpc3 are paralogs with 80% identity, we reasoned that Mpc1 might also form a complex with Mpc3 under conditions where Mpc2 is absent. We therefore investigated MPC1-HA, MPC2-HA, and MPC3-HA mitochondria by BN-PAGE, a method used to investigate protein complexes by native gel electrophoresis. When mitochondria were isolated from cells grown in YPD, we observed a complex with an apparent molecular mass of ∽150 kDa composed of Mpc1-HA and Mpc2-HA (Fig1C, lanes 1 and 2), as previously described (Bricker et al, 2012). On the other hand, in mitochondria from cells grown in YPG, we observed a complex that migrated slightly slower and contained Mpc1-HA and Mpc3-HA (Fig1C, lanes 3 and 4). The slower migration is probably due to the slightly larger Mpc3 compared to Mpc2 (16.2 versus 14.5 kDa). Even though in BN-PAGE Mpc1-HA was less well detected than Mpc2-HA or Mpc3-HA with the anti-HA antibody, expression levels were similar, as shown by the results in Fig1A. Some cross-reactivity of our antiserum with other proteins was also observed (denoted by asterisks in Fig1C). This is likely to be with respiratory chain complexes that are very abundant in yeast grown in YPG but almost absent in YPD.
Taken together, our results suggest that two alternative MPC complexes exist in yeast mitochondria depending on the carbon source: An MPCFERM complex consisting of Mpc1 and Mpc2 is present with YPD, while an MPCOX complex consisting of Mpc1 and Mpc3 is found with YPG. Curiously, under respiratory conditions, we consistently observed a higher molecular weight complex of about 300 kDa that also contained both Mpc1-HA and Mpc3-HA (Fig1C, 300K). This additional complex was only present in respiratory conditions, and no comparable structure could be detected when Mpc1 was complexed with Mpc2 in glucose-grown mitochondria.
Functional expression of MPCFERM and MPCOX complexes
We asked whether MPCFERM and MPCOX have different functions related to the different metabolic routes followed by pyruvate under the growth conditions in which the respective complexes were expressed. The structure and function of mitochondria from cells grown under fermentative conditions, however, is known to be different from that of cells grown under respiratory conditions, and little valid conclusion can be drawn from experiments where mitochondria have been isolated from cells grown under different conditions. To minimize any variability due to different mitochondrial protein or metabolite content, we therefore decided to express constitutively either Mpc2 or Mpc3 in combination with Mpc1. All further experiments could thus be performed with mitochondria isolated from cells grown under the same conditions. To maximize mitochondria yield, we chose medium containing glycerol (see Materials and Methods). Furthermore, in order to additionally exclude interference due to the expression of the endogenous genes, we transformed the triple gene deletion strain (mpc1Δ mpc2Δ mpc3Δ) with centromeric expression plasmids that contained epitope-tagged MPC genes under the control of a constitutive promoter. As MPC proteins normally exhibit a low level of endogenous expression, we chose to use the CYC1 promoter that has relatively weak activity (Mumberg et al, 1995). Comparison of protein levels when MPC1-HA was expressed from either the CYC1 or its endogenous MPC1 promoter showed that the constitutive promoter resulted in only a moderate level of protein overexpression (Supplementary Fig S1C). As expected, co-expression of either Mpc1 and Mpc2 or Mpc1 and Mpc3 was able to rescue the growth defect of the triple mutant in minimal medium lacking amino acids, while expression of either subunit alone did not rescue (Fig2A), suggesting that the expression of either MPC complex restored pyruvate transport activity.
Figure 2.
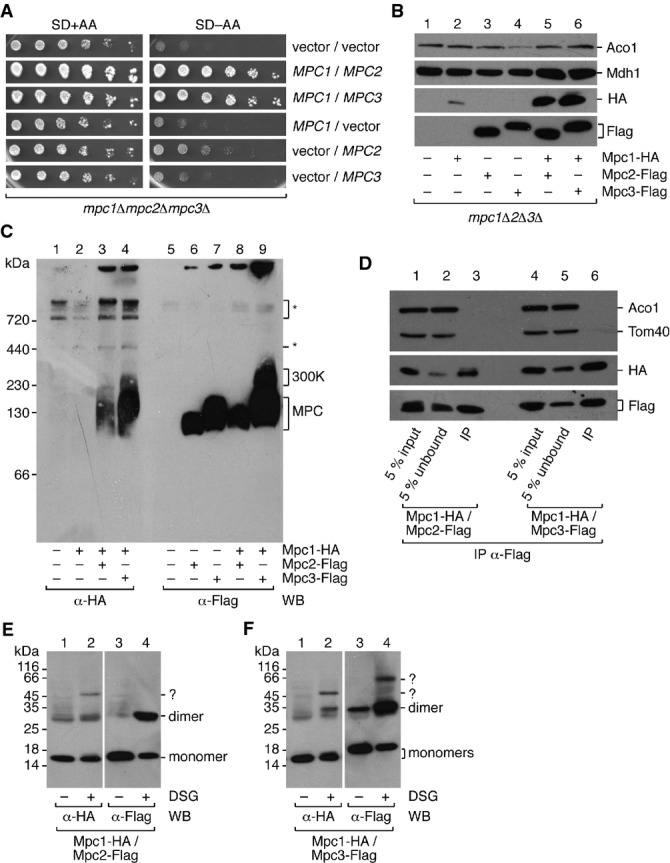
- A Constitutive expression of either MPCFERM or MPCOX can rescue the slow growth phenotype of the mpc1Δmpc2Δmpc3Δ triple deletion mutant. Growth tests were performed with cells transformed with MPC1, MPC2, or MPC3 expression plasmids or with empty vectors in indicated combinations. A serial dilution of yeast cells was spotted on agar plates with glucose-containing synthetic minimal medium with (SD+AA) or without (SD−AA) amino acids.
- B Plasmid-encoded MPC proteins can be detected in isolated mitochondria when Mpc1 is co-expressed with either Mpc2 or Mpc3. Cells were grown in selective medium containing glycerol as a carbon source. MPC subunits were constitutively expressed from plasmids in indicated combinations in the mpc1Δmpc2Δmpc3Δ background and detected by Western blot using anti-HA or anti-Flag antibodies. Mitochondrial enzymes aconitase (Aco1) and malate dehydrogenase (Mdh1) were used as loading controls.
- C BN-PAGE confirms the formation of MPCFERM and MPCOX complexes after constitutive plasmid-based protein expression. Non-specific reactivity of the antibody is denoted by an asterisk (*). It has to be noted that all complexes migrate slightly faster than in Fig1C, most likely because MPC proteins are tagged with a single epitope tag as opposed to the 3HA-tag in Fig1C.
- D Mpc1 is co-immunoprecipitated with Mpc2 or Mpc3. Mitochondria isolated from cells harboring appropriate expression plasmids and grown in glycerol-containing medium were lysed in 1% digitonin, and either Mpc2-Flag or Mpc3-Flag was immunoprecipitated. Mpc1-HA was detected by Western blot with an antibody directed against the epitope tag. The matrix protein aconitase (Aco1) and 40-kDa translocase of the outer membrane subunit (Tom40) were not co-immunoprecipitated.
- E, F Stoichiometry of MPC complexes. Chemical cross-linking indicates that Mpc1/Mpc2 and Mpc1/Mpc3 form heterodimers of the predicted molecular weight. DSG, disuccimidyl glutarate. Cross-linking products with unknown partners are labeled with a question mark (?).
We then examined whether proteins were indeed expressed in both combinations and assembled into the alternative complexes MPCFERM and MPCOX. Western blot and immunodetection with antibodies directed against the HA or Flag epitope tags confirmed the presence of plasmid-derived proteins in isolated mitochondria (Fig2B, lanes 5 and 6). Importantly, the alternative subunits Mpc2 and Mpc3 were present in approximately equal amounts. Even in the absence of Mpc1, the expression of Mpc2 and Mpc3 was unaffected (Fig2B, lanes 3 and 4). Mpc1, on the other hand, was barely detectable when no other carrier subunit was present (Fig2B, lane 2, and Supplementary Fig S1C), indicating that the protein is not stable under these conditions.
Formation of MPC complexes was examined by BN-PAGE. Both MPCFERM and MPCOX were formed as expected by Mpc1/Mpc2 or Mpc1/Mpc3, respectively (Fig2C, lanes 3, 4, 8 and 9). Furthermore, as seen previously, the ∽300-kDa complex was only formed in the presence of Mpc1 and Mpc3, indicating that this complex is dependent on protein composition rather than the growth conditions. Interestingly, Mpc2 or Mpc3 alone was also able to form complexes, which migrated slightly faster than the respective complex containing Mpc1 (Fig2C, lanes 6 and 7). However, these are not functionally active as seen by the failure to rescue the growth defect of the triple mpc mutant (Fig2A), and as assayed directly (see Fig 4 below).
Figure 4.
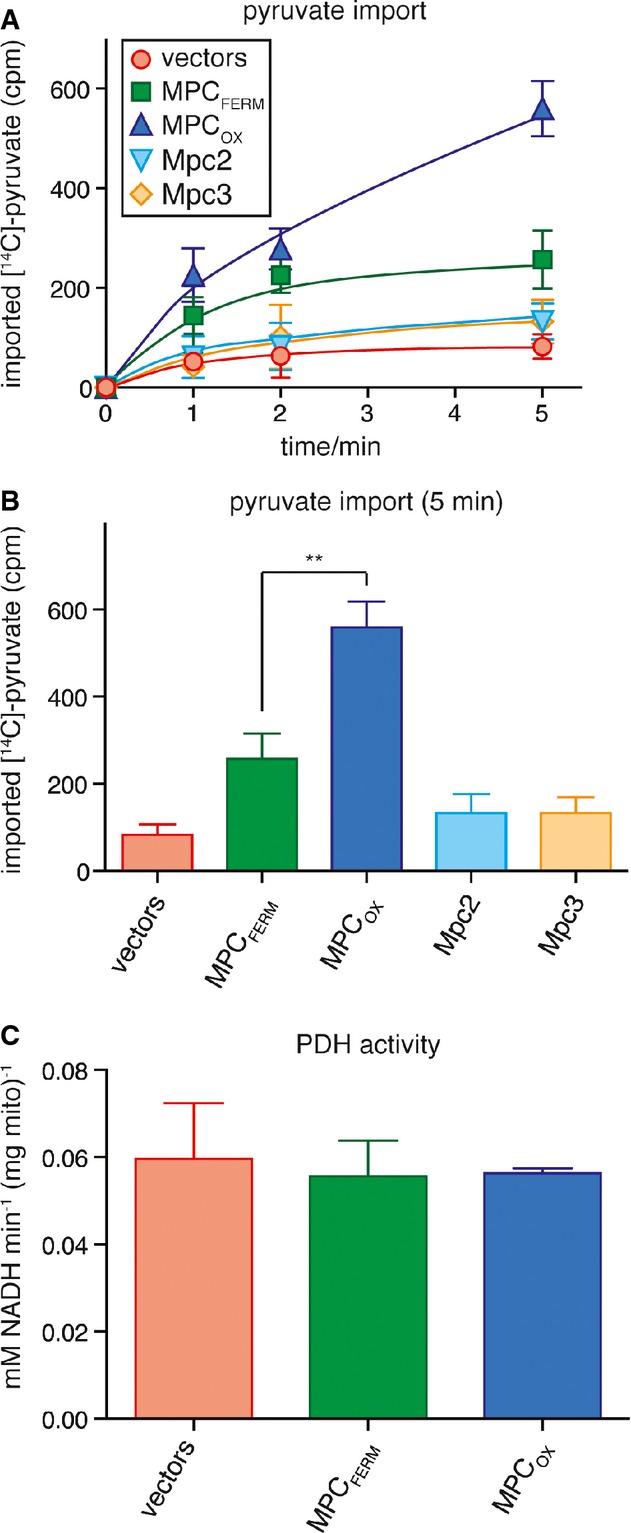
- MPCOX has higher transport activity than MPCFERM. The uptake of 14C-labeled pyruvate into intact mitochondria was measured in vitro. Mitochondria had been isolated from cells grown in glycerol-containing medium and expressing no subunit (vectors), MPCFERM, MPCOX, Mpc2, or Mpc3. Imported pyruvate was quantified by re-isolation of mitochondria and subsequent scintillation counting after 1, 2, or 5 min of incubation with [14C]-pyruvate.
- Imported [14C]-pyruvate as in (A) after 5-min incubation. The difference between MPCOX and MPCFERM (**P = 0.0037) was significant (unpaired t-test).
- Pyruvate dehydrogenase activity was measured in lysates of mitochondria expressing no subunit (vectors), MPCFERM, or MPCOX.
Finally, we have confirmed complex formation by co-immunoprecipitation. Mitochondria were purified from appropriately transformed cells and lysed with 1% digitonin, and either Mpc2 or Mpc3 was pulled down by virtue of a C-terminal Flag-tag. In both cases, HA-tagged Mpc1 was co-immunoprecipitated (Fig2D). Taken together, these data show that both plasmid-derived MPCFERM and plasmid-derived MPCOX were correctly assembled and able to transport pyruvate into mitochondria.
Chemical cross-linking reveals a heterodimeric composition of the MPC
We next decided to examine in more detail some of the molecular properties of the reconstituted MPC complexes. In particular, since a comparison with similar carriers suggested that the MPC might be dimeric (Jezegou et al, 2012; Xu et al, 2014), we were interested in determining the subunit stoichiometry for each complex. To do this, we treated isolated mitochondria with the membrane-permeable, amino-reactive cross-linker disuccimidyl glutarate (DSG) in order to covalently link the MPC subunits present in close proximity. The size of the cross-linked oligomers was estimated by SDS–PAGE and immunoblot. For Mpc2-Flag (Fig2E) and Mpc3-Flag (Fig2F), cross-linking resulted in the detection of a higher molecular weight band at about 30 or 32 kDa, respectively, corresponding to the size of a hypothetical dimer. Furthermore, Mpc1-HA was cross-linked to a product of exactly the same size as the Mpc2-Flag- or Mpc3-Flag-containing dimer, depending on what subunit it was co-expressed with (Fig2E and F). This, and the co-immunoprecipitation of Mpc1 with Mpc2 or Mpc3 (Fig2D), strongly indicates that the observed cross-link product is a heterodimer of either Mpc1 and Mpc2 or Mpc1 and Mpc3. Both MPCFERM and MPCOX thus appear to be heterodimers composed of Mpc1 complexed with either Mpc2 or Mpc3, respectively.
Interestingly, a dimer band was also detected for Mpc3-Flag in the absence of cross-linker (Fig2F, line 3), which indicates that a small fraction of the complex is resistant to SDS and heat treatment. In agreement with this notion, when a sample without cross-linker was not heated at 95°C prior to SDS–PAGE, the amount of dimer was increased (Supplementary Fig S2A). On the other hand, the amount of dimer was not increased under non-reducing electrophoresis conditions (Supplementary Fig S2A), indicating that the two subunits are not covalently linked by a disulfide bond.
Since we had observed by BN-PAGE that Mpc2 and Mpc3 were able to form complexes when expressed without Mpc1 (Fig2C), we also performed a DSG cross-linking experiment using mitochondria containing either Mpc2 or Mpc3 alone. Indeed, both proteins could be cross-linked into homodimeric forms with the predicted molecular weight (Supplementary Fig S2B). To test whether homodimers are also able to form in the presence of Mpc1, we transformed mpc2Δmpc3Δ cells with plasmids coding for either Mpc2 or Mpc3 with two different epitope tags. By immunoprecipitation from mitochondrial lysates, we confirmed in both cases the occurrence of homomeric interactions (Supplementary Fig S2C). This strongly indicates that Mpc2 or Mpc3 homodimers also exist in vivo, even though both the growth test (Fig2A) and analysis of transport activity (see Fig 4 below) suggest that homodimers are non-functional.
MPC proteins differ in their membrane topology
Based on prediction algorithms, MPC proteins have previously been suggested to contain either two or three alpha-helical transmembrane segments (Bricker et al, 2012; Herzig et al, 2012). In an attempt to resolve this question experimentally and to determine the localization of the N- and C-termini, we have used the thiol-reactive dye 4-acetamido-4′-((iodoacetyl) amino)stilbene-2,2′-disulfonic acid (IASD), which is able to cross the outer but not the inner mitochondrial membrane and thus can label only those cysteine residues of inner membrane proteins that are exposed to the intermembrane space (IMS) (Malhotra et al, 2013). For these experiments, we have created single cysteine variants of both Mpc1 and Mpc3 by first changing the endogenous cysteines to alanines and then introducing cysteines at various positions along the polypeptide chain (Supplementary Fig S3A). All MPC1 or MPC3 mutants were functional when expressed in the mpc1Δ or mpc2Δmpc3Δ background, respectively, as judged by their ability to rescue the growth defect in the absence of BCAA (Supplementary Fig S3B and D). To study the topology of the MPC proteins, mitochondria were isolated from appropriately transformed cells and treated in vitro with IASD. Accessibility of cysteines was detected by Western blot as a small increase in molecular weight (∽500 Da) caused by covalent binding of the dye. Treatment with the reducing agent dithiothreitol (DTT) and lysis of mitochondrial membranes with the detergent Triton X-100 prior to the labeling served as negative and positive controls, respectively, for the labeling reaction.
For Mpc1, in intact mitochondria, we found labeling of only one mutant, C87A/D51C, where the cysteine had been introduced in the short connecting loop between the first and second putative transmembrane segments, indicating that this loop is found in the IMS (Fig3A, lanes 9–12). All other variants were unlabeled (Fig3A and Supplementary Fig S3C), including the variants in which cysteines were introduced in the N- or C-terminal regions (C87A/S12C or C87A/A116C), thus showing that both termini are found in the mitochondrial matrix. We therefore conclude in contrast to earlier predictions that Mpc1 contains only two transmembrane segments and that the short loop between these helices is found in the IMS (see Fig3D).
Figure 3.
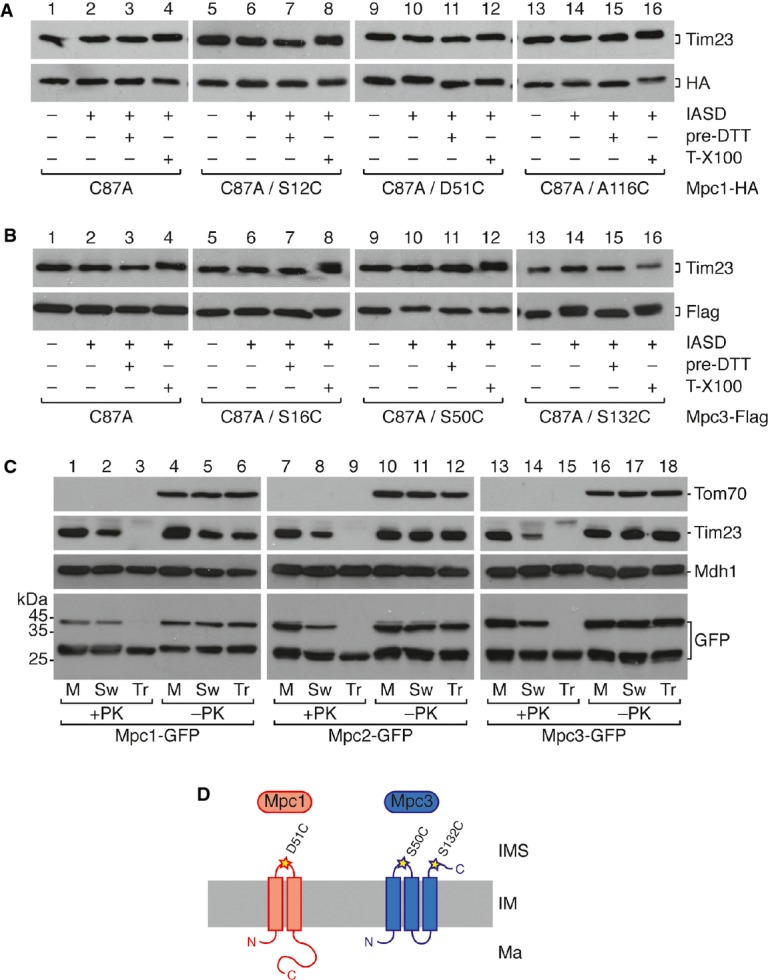
- A, B Determination of MPC membrane topology by IASD labeling of isolated mitochondria expressing the indicated single cysteine variants of Mpc1 (A) and Mpc3 (B). Mitochondria were treated with IASD as indicated. Negative [quenching by pretreatment with DTT (pre-DTT)] and positive [lysis with 0.5% Triton X-100 (T-X100)] controls for the labeling reaction are shown. As a further control, also translocase of the inner membrane subunit Tim23 is detected by Western blot, which contains three endogenous cysteines, all of which are located in membrane-embedded regions. Labeling of an IMS-exposed cysteine with IASD is indicated by a mobility shift on SDS–PAGE corresponding to the molecular weight of IASD (˜500 Da).
- C Protease protection assay in mitochondria expressing Mpc1-GFP, Mpc2-GFP, or Mpc3-GFP. Intact mitochondria (M), mitoplasts with a ruptured outer membrane after hypo-osmotic swelling (Sw), or mitochondrial lysates with 0.5% Triton X-100 (Tr) were treated with proteinase K (PK). Loading controls are Tom70 (outer membrane), Tim23 (inner membrane), and Mdh1 (matrix). GFP-fused Mpc2 and Mpc3 are degraded in mitoplasts, whereas Mpc1-GFP is not.
- D Model showing the proposed membrane topology of Mpc1 and Mpc3. Whereas Mpc1 has only two transmembrane helices, Mpc3 has three.
As predicted from the homology between all MPC proteins, the cysteine introduced at position 50 of Mpc3 (C87A/S50C) should also fall between the first two transmembrane regions, and as expected, this cysteine was also labeled with IASD (Fig3B, lanes 9–12). While the N-terminal region (variant C87A/S16C; Fig3B, lanes 5–8) was not labeled, we surprisingly detected labeling of the C-terminal cysteine variant C87A/S132C (Fig3B, lanes 13–16). The cysteines located within putative transmembrane segments were not labeled (Supplementary Fig S3E). This is compatible only with a three-transmembrane segment topology, where the N-terminus is found in the matrix and the C-terminus resides within the IMS (see Fig3D).
To confirm this, we expressed Mpc1, Mpc2, and Mpc3 fused C-terminally with green fluorescent protein (GFP). All GFP fusions were able to rescue the growth phenotype of the respective deletion mutant (Supplementary Fig S4A). As expected from the calculated molecular weight of the fusion proteins, Western blot with an anti-GFP antibody detected a band of ∽40 kDa, indicating that GFP fusions were properly expressed (Supplementary Fig S4B). An additional band of ∽27 kDa most likely corresponded to the GFP moiety alone that is resistant to proteolytic removal in vivo. We then performed a protease protection assay using isolated mitochondria to determine the accessibility of MPC proteins to externally added proteinase K (PK). In intact mitochondria, no PK digestion of the GFP fusion proteins was observed (Fig3C, lanes 1, 7 and 13), whereas all GFP-fused molecules were completely degraded following complete membrane disruption in the presence of Triton X-100 (Fig3C, lanes 3, 9 and 15). Interestingly, when the outer membrane was disrupted selectively by hypo-osmotic swelling, both Mpc2-GFP and Mpc3-GFP were cleaved in the presence of PK, consistent with exposure of the C-terminus of those two proteins to the IMS (Fig3C, lanes 8 and 14). Mpc1-GFP, on the other hand, was protected from PK digestion after swelling, presumably because it exposes only the short loop between the alpha-helical transmembrane segments to the IMS (Fig3C, lane 2).
In summary, we conclude from these data that Mpc1 has two transmembrane-spanning segments separated by a small loop which is localized to the IMS, while the N- and C-termini are associated with the mitochondrial matrix, and that in contrast, Mpc2 and Mpc3 have an additional transmembrane domain, which results in the projection of the C-termini of Mpc2 and Mpc3 into the IMS (Fig3D).
The transport activity of MPCOX is higher than that of MPCFERM
Having established the existence of two alternative MPC complexes, we were next interested in characterizing their pyruvate transport activities. Pyruvate uptake was assayed as previously described (Herzig et al, 2012) by measuring 14C-labeled pyruvate import into isolated mitochondria expressing either MPCFERM or MPCOX. Import kinetics were determined using an inhibitor-stop approach with the specific MPC inhibitor UK5099 (Halestrap, 1975). By performing the transport experiment in buffer at pH 6.8 while mitochondria were isolated in buffer at pH 7.4, we artificially created a proton gradient over the mitochondrial inner membrane that could be used as the driving force for pyruvate import. As expected, there was almost no import when the mpc1Δ mpc2Δ mpc3Δ triple deletion strain was transformed with the empty vectors (Fig4A and B). Likewise, mitochondria expressing either Mpc2 or Mpc3 alone show import only slightly above the background (Fig4A and B), confirming that Mpc2 or Mpc3 homodimers are non-functional in pyruvate transport. However, co-expression of either Mpc2 or Mpc3 with Mpc1 resulted in specific pyruvate import (Fig4A and B). Remarkably, the import rate after 5 min of incubation was about 2.2-fold higher when subunits Mpc1 and Mpc3 were expressed together, compared to co-expression of Mpc1 and Mpc2 (Fig4A and B), even though no difference was detected in protein expression levels (see Fig2B). Thus, the MPCOX displays a significantly higher rate of pyruvate import than does the MPCFERM (P = 0.0037).
As a control, we checked whether changes in mitochondrial pyruvate metabolism could be responsible for the observed differences in pyruvate uptake rates. This was considered necessary as we had previously observed a slightly lower PDH activity in mpc1Δ mitochondria (Herzig et al, 2012), most probably because PDH requires a lipoic acid cofactor, for which mitochondrial pyruvate can serve as biosynthetic precursor (Schonauer et al, 2009). We thus measured PDH activity in mitochondria expressing either MPCOX or MPCFERM. No significant differences were observed, and the activity in both cases was similar to the activity in mitochondria lacking any MPC subunit (Fig4C). Thus, we conclude that the increased pyruvate transport rate in the presence of MPCOX compared to MPCFERM is not due to increased pyruvate metabolism but to a higher intrinsic transport activity of the carrier.
Growth rates are unaffected by forced expression of MPCFERM and MPCOX
The differences in pyruvate transport activity of MPCFERM and MPCOX suggest that the subunit exchange serves to adapt mitochondrial pyruvate uptake to oxidative or fermentative metabolism. We thus asked whether forced expression of either complex had any effect in vivo. For this, we again used the plasmid-based expression system, where MPC genes are expressed from a constitutive promoter in cells devoid of all endogenous MPC genes. We measured growth curves in both glucose- and glycerol-containing minimal medium that supported maintenance of the plasmids. The strain containing empty vectors clearly showed delayed growth under both conditions, indicating that in minimal medium, mitochondrial pyruvate import is required for normal growth, even if BCAA are provided (Supplementary Fig S5). In contrast, the growth rates of MPCFERM- and MPCOX-expressing cells were virtually indistinguishable, under both fermentative and respiratory conditions (Supplementary Fig S5). We conclude that the activity of MPCFERM under respiratory conditions is sufficient to promote normal proliferation.
The higher transport activity of MPCOX is dependent on the Mpc3 C-terminus
The subunits Mpc2 and Mpc3 are believed to have arisen from a recent gene duplication and share about 80% overall sequence identity (Bricker et al, 2012; Herzig et al, 2012). However, while the major part of the protein from amino acid 1 to 106 shows a very high degree of homology, the extreme C-termini are completely different (Supplementary Fig S6A). We therefore asked whether the alternative C-termini (22 amino acids in Mpc2, 39 amino acids in Mpc3) might be responsible for the difference in pyruvate uptake activities shown by the MPCFERM and MPCOX complexes. To address this question, we created chimeric proteins in which the C-terminus of Mpc2 was replaced by the C-terminus of Mpc3 (Mpc2C3) and vice versa (Mpc3C2; Fig5A). Both chimeric proteins were co-expressed with Mpc1 in yeast cells lacking all three MPC genes (mpc1Δmpc2Δmpc3Δ). Initial Western blot analysis showed that whereas Mpc2C3-Flag was well expressed, only a trace of Mpc3C2 was detectable (Fig5B), presumably due to impaired complex assembly or increased turnover of the latter protein construct. We therefore decided to exclude the Mpc3C2 chimera from all further analyses. The construct Mpc2C3, however, was able to restore the growth phenotype of the triple deletion strain on minimal medium lacking amino acids (Supplementary Fig S5B), and interacted with co-expressed Mpc1-HA, as shown by co-immunoprecipitation (Supplementary Fig S5C). Thus, the Mpc2C3 chimera was able to form an active pyruvate carrier together with Mpc1.
Figure 5.
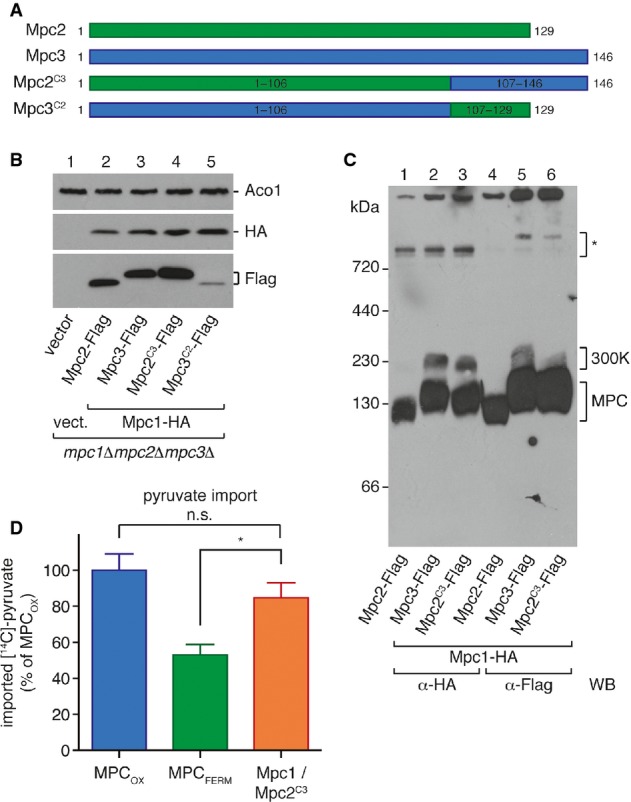
- Scheme of the chimeric protein constructs Mpc2C3 and Mpc3C2. The C-terminal region of Mpc2 was replaced by the corresponding region of Mpc3, and vice versa.
- The chimeric construct Mpc2C3 is expressed in isolated mitochondria, while Mpc3C2 is not. Mpc1-HA and the Flag-tagged chimeric proteins were detected by Western blotting in isolated mitochondria.
- Mpc2C3 forms a carrier complex with Mpc1, as analyzed by BN-PAGE. When co-expressed with Mpc1, Mpc2C3 shows the same complex pattern as Mpc3, including the 300K complex.
- Pyruvate transport activity of the Mpc1/Mpc2C3 complex reaches ˜85% of MPCOX activity. Uptake of [14C]-pyruvate into mitochondria isolated from yeast cells expressing the indicated MPC protein combinations was measured in vitro. Difference between MPCFERM and Mpc1/Mpc2C3 is significant (unpaired t-test; *P = 0.02). Means of n = 4 experiments are shown, with error bars representing SEM.
We then examined the effect of the C-terminal substitution on the migration on BN-PAGE. The complex composed of Mpc1 and Mpc2C3 ran at approximately the same size as MPCOX (Fig5C), again indicating that the chimeric protein is integrated into a functional pyruvate carrier complex. Interestingly, the ∽300-kDa complex was also formed in the presence of Mpc2C3 (Fig5C). The formation of this larger complex normally formed between Mpc1 and Mpc3 is thus dependent on the C-terminal region of Mpc3.
Finally, we measured in vitro import of 14C-labeled pyruvate into mitochondria co-expressing Mpc2C3 and Mpc1, and compared the activity with mitochondria expressing the MPCFERM or MPCOX complexes. Remarkably, the chimeric MPC complex showed about 85% of MPCOX activity and significantly greater activity than MPCFERM (P = 0.020; Fig5D). Thus, replacing the short C-terminal region of Mpc2 by the corresponding region of Mpc3 is sufficient to confer a significantly higher capacity for pyruvate transport, suggesting that the C-terminal region of the Mpc1 interaction partner plays a key role in establishing the pyruvate transport properties of MPCFERM and MPCOX.
Discussion
The metabolic decision at the pyruvate branch point determines whether a cell uses oxidative phosphorylation or glycolysis for production of ATP. While it is clear that key enzyme activities like pyruvate decarboxylase or pyruvate dehydrogenase, which catalyze the first step toward the fermentative or oxidative route, respectively, are regulated (Gey et al, 2008; de Assis et al, 2013), little is known about the carrier that transports pyruvate across the mitochondrial inner membrane. This study aims at elucidating the role of the mitochondrial pyruvate carrier in the regulation of cellular metabolism in the model organism Saccharomyces cerevisiae.
Previous experiments have shown that either Mpc2 or Mpc3 is needed together with Mpc1 to maintain growth in the absence of BCAA, implying that the function of Mpc2 and Mpc3 may be redundant (Bricker et al, 2012; Herzig et al, 2012). However, we found that these two subunits were differentially expressed in an all-or-nothing fashion, depending on the carbon source on which the cells are grown (Fig1A). This finding is in good agreement with a previous study showing that MPC3 expression is strongly and rapidly induced via the HOG pathway when cells are shifted to glycerol-containing medium (Timón-Gómez et al, 2013). In addition, the MPC3 promoter was shown to bind the Sko1 transcription factor, and gene expression was upregulated in response to osmotic stress (Proft et al, 2005), indicating that MPC3 is a highly regulated gene. The regulation of MPC2 expression, on the other hand, seems to be more complex. Our results suggest that the protein is more abundant when cells are grown in minimal medium (Supplementary Fig S1B), indicating that it may be induced by deprivation of some nutrient that is lacking under these conditions. Moreover, Timón-Gómez et al (2013) have shown that the level of MPC2 mRNA does not change after a switch to a non-fermentable carbon source, yet we find only a faint trace of the HA-tagged protein under these conditions. We therefore suggest that Mpc2 protein levels may also be regulated post-transcriptionally, presumably by translational inhibition or proteolytic removal in the absence of glucose.
We have demonstrated using BN-PAGE that the differential subunit expression gives rise to two alternative MPC complexes that we have termed MPCFERM and MPCOX (Fig1C). In order to compare their properties, we have reconstituted both complexes in vivo by expressing each of the subunits from a constitutive promoter in cells lacking all three MPC genes (mpc1Δmpc2Δmpc3Δ). This has allowed us to study MPCFERM and MPCOX under the same growth conditions. Chemical cross-linking revealed that both MPCFERM and MPCOX are most likely to be heterodimers (Fig2E and F). We have also detected homodimeric forms of Mpc2 and Mpc3, which are present in the absence of Mpc1, or when the subunit is present in excess over Mpc1 (Supplementary Fig S2B and C). However, homodimers are unable to transport pyruvate (Fig4A and B). We thus propose that in vivo, Mpc2 and Mpc3 homodimers may provide a reservoir of functional subunits that can be rapidly recruited by Mpc1 to form the functional carrier most appropriate to the growth conditions.
Even though the theoretical molecular weight of a dimeric MPC complex would be around 30 kDa, the native complex shows an apparent molecular weight of ∽150 kDa on BN gels. This could indicate that multiple dimers assemble to form the mature carrier, or that additional, yet undiscovered subunits are present in the complex, which were not cross-linked by DSG in our assay. It has to be taken into account, however, that the presence of membrane lipids or detergents bound to the dimeric MPC may affect its mobility in native electrophoresis, leading to an overestimation of its size. Likewise, it was recently demonstrated that the 30-kDa monomeric mitochondrial ATP/ADP carrier migrates with an apparent molecular weight of ∽120 kDa in BN-PAGE (Crichton et al, 2013). Thus, we consider it likely that it is the ∽30-kDa MPC dimer that migrates at ∽150 kDa on BN gels.
Interestingly, MPC proteins were reported to be similar to a group of transporters called the PQ-loop family (Jezegou et al, 2012). Because these transporters contain seven transmembrane segments organized in two consecutive three-helix domains on the same polypeptide chain, it has been speculated that the shorter MPC proteins could dimerize in order to form a full carrier (Gray et al, 2013), an idea that is now supported by the discovery of MPC heterodimers. Furthermore, the three-dimensional structure of bacterial SemiSWEET transporters, which are also remotely similar to MPC proteins, was recently solved, showing that two-three-helix subunits form a homodimer (Xu et al, 2014). It is thus conceivable that the heterodimeric MPC is an asymmetric version of a SemiSWEET-like dimeric carrier and that MPC and SemiSWEET proteins evolved from a common ancestor (Xu et al, 2014).
The exact membrane topology of MPC proteins has not been determined to date. Here, we show that Mpc1 has two transmembrane domains, with both the N- and C-terminus located in the matrix, while Mpc3 has three-transmembrane domains with the N-terminus in the matrix and the C-terminus in the IMS (see model in Fig3D). Based on the high degree of sequence similarity, we assume that Mpc2 has the same topology as Mpc3, which is also confirmed by the protease protection experiments performed with mitochondria expressing either Mpc2-GFP or Mpc3-GFP (Fig3C). A similar protease protection experiment conducted by Herzig et al (2012) suggests that the different membrane topology of MPC proteins is also conserved in mammalian cells. An additional interesting difference between Mpc1 and the other two subunits is that Mpc1 is not stable when expressed on its own (Fig2B). It will therefore be an interesting question for future research to relate the topological and structural differences between Mpc1 and Mpc2/Mpc3 to their different functions within the MPC.
By directly measuring pyruvate uptake in isolated mitochondria, we have shown that MPCOX has a higher transport activity than MPCFERM (Fig4). Despite this, forced expression of either MPCFERM in glycerol-containing medium, or of MPCOX in glucose-containing medium does not have a significant effect on growth rates (Supplementary Fig S5). This result is not surprising, however, given that a complete loss of all MPC proteins can be tolerated without an apparent growth defect in rich medium (Bricker et al, 2012; Herzig et al, 2012). We suggest that in the case of MPCFERM expression under respiratory conditions, alternative pathways leading to the production of acetyl-CoA, like fatty or amino acid oxidation, can compensate for the lower mitochondrial pyruvate uptake rates. Indeed, a similar scenario was recently described for cultured mammalian cells after downregulation or pharmacological inhibition of the MPC (Vacanti et al, 2014; Yang et al, 2014). In the case of MPCOX expression under fermentative conditions, it is possible that changes in mitochondrial enzymes downstream of MPC, for example, inhibition of PDH through reversible phosphorylation (Gey et al, 2008), may create a constriction in pyruvate flux such that despite the presence of the high-activity carrier, the majority of pyruvate is diverted toward ethanol production. The absence of a growth phenotype after forced expression of either MPC complex is therefore not inconsistent with the conclusion that in wild-type cells, the alternative MPC complexes indeed play a role in adapting the cellular metabolism to nutrient availability.
Based on these data, we propose the following model for regulation of metabolite flux at the pyruvate branch point (Fig6). PDC, the first enzyme in the fermentation pathway, and the MPC both compete for the pyruvate produced through glycolysis. In cells grown in glucose (Fig6A), PDC is upregulated in the cytosol, while the low-activity transporter MPCFERM is present in mitochondria, which results in the majority of pyruvate remaining in the cytosol where it is processed to ethanol. Under these conditions, MPCFERM transports just sufficient pyruvate to ensure the biosynthesis of leucine and valine for which mitochondrial pyruvate is the precursor, as evidenced by the slow growth phenotype of mpc mutants in medium lacking amino acids (Bricker et al, 2012; Herzig et al, 2012). Under respiratory conditions (Fig6B), on the other hand, cells express the high-activity MPCOX and divert the majority of pyruvate toward the mitochondrial matrix, where it is used to fuel the TCA cycle and ATP production in the respiratory chain.
Figure 6.
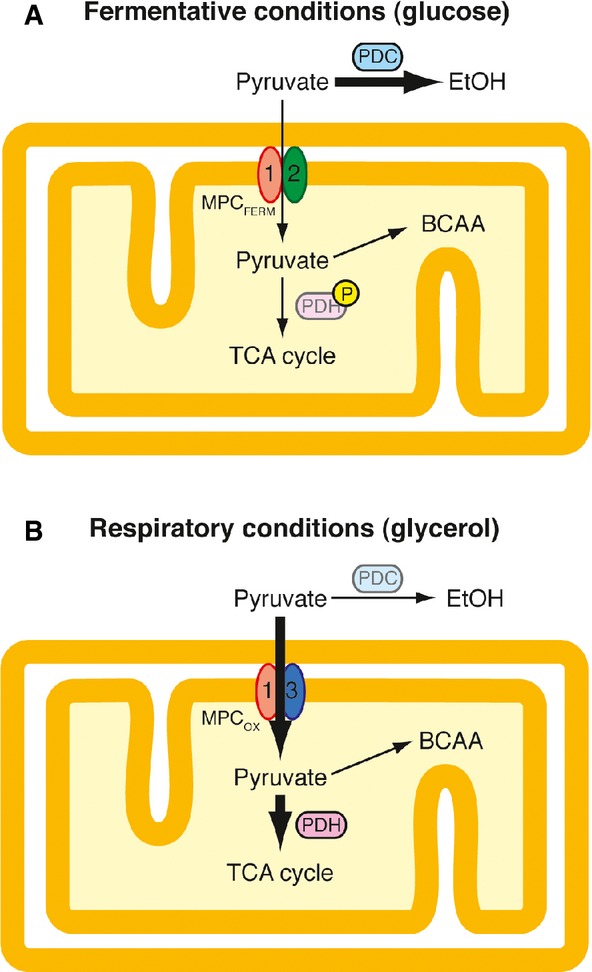
- Fermentative conditions. The low-activity MPCFERM (composed of Mpc1 and Mpc2) is competing for cytosolic pyruvate produced through glycolysis with pyruvate decarboxylase (PDC), the first enzyme of the alcoholic fermentation pathway. Consequently, the majority of pyruvate remains in the cytosol is decarboxylated by PDC and is finally transformed into ethanol. Low-level transport of pyruvate into mitochondria is required for the biosynthesis of leucine and valine. In addition, mitochondrial pyruvate oxidation may be blocked by a hypothetical inactivation of pyruvate dehydrogenase (PDH) by phosphorylation of the E1 subunit under these conditions.
- Respiratory conditions. The high-activity MPCOX (composed of Mpc1 and Mpc3) is expressed while PDC is downregulated. This allows the efficient uptake of pyruvate into mitochondria. Inside the organelle, pyruvate is converted to acetyl-CoA by PDH, which enters the TCA cycle and thus finally fuels ATP production in the respiratory chain. The subunit exchange in the MPC thus very likely participates in the Crabtree effect in Saccharomyces cerevisiae.
In order to investigate the molecular basis for the differences in transport activity between MPCOX and MPCFERM, we focused our attention on the C-termini of the alternative subunits Mpc2 and Mpc3 (Fig5), since this is the main region of sequence divergence between the two proteins. Strikingly, we found that after replacing the C-terminus of Mpc2 with the C-terminus of Mpc3 (Mpc2C3), the transport activity of the chimeric complex was increased almost to the level of MPCOX (Fig5D). It seems therefore that the C-terminus of Mpc3 plays a major role in efficient mitochondrial pyruvate uptake by the MPCOX complex. Interestingly, the chimeric MPC is also able to form the ∽300-kDa complex, which is normally only formed when Mpc1 is present together with Mpc3. It remains to be determined whether the formation of the ∽300-kDa complex is responsible for the high transport activity and whether additional components besides Mpc1 and Mpc3 are present in this structure.
In summary, our results argue in favor of a key role for the MPC in the control of cellular metabolism at the pyruvate branch point, and we propose that, in addition to other regulated enzymes such as PDH or PDC, the subunit exchange within the MPC contributes to the Crabtree effect in yeast (Fig6). This raises the interesting question of whether regulation of mitochondrial pyruvate transport may also be responsible at least in part for the Warburg effect in cancer cells, as was recently suggested (Schell et al, 2014). Clearly, the subunit exchange mechanism is not conserved in mammals, since there are only two subunits encoded in mammalian genomes. Nevertheless, we show here for the first time that a mechanism for regulating pyruvate transport has evolved that acts at the level of the MPC. It is thus tempting to speculate that controlling MPC activity has the potential to contribute to the regulation of cellular energy metabolism in higher eukaryotes. In this respect, it is interesting that mouse MPC2, the homolog of yeast Mpc2 and Mpc3, becomes reversibly acetylated on two lysine residues, which is dependent on caloric restriction and the SIRT3 deacetylase (Hebert et al, 2013). Furthermore, SIRT deacetylases are currently regarded as major regulators of metabolism in mammalian cells (Sack & Finkel, 2012). It therefore seems plausible that rather than the subunit exchange mechanism we have described in yeast, higher eukaryotes may have evolved post-translational mechanisms to control MPC activity and thus to determine the intracellular fate of pyruvate in relation to the physiological needs of the cell.
Materials and Methods
Yeast cultivation, mitochondria isolation, and growth tests
Saccharomyces cerevisiae strains used in this study are listed in Supplementary Table S1. Yeast cells were grown in YP medium (1% yeast extract, 2% peptone) containing 2% glucose (YPD) or 3% glycerol (YPG), or in synthetic dropout medium (0.67% yeast nitrogen base, 2% glucose) with (SD+AA) or without (SD−AA) amino acid mix, and mitochondria were isolated by differential centrifugation, as previously described (Ryan et al, 2001). For mitochondria isolation from cells harboring expression plasmids, SG medium (0.67% yeast nitrogen base, appropriate amino acid dropout mix, 0.5% glucose, 3% glycerol) was used. To assess growth complementation of MPC-expressing strains, yeast cells were grown over night in SD+AA medium, and serial dilutions were spotted on either SD+AA or SD−AA agar plates. Growth curves were recorded by measuring OD600 in 96-well plate format at 30°C in SD+AA medium using a Tecan Sunrise plate reader, or were recorded manually in shaking cultures at 30°C containing SG+AA medium (0.67% yeast nitrogen base, appropriate amino acid dropout mix, 3% glycerol) by withdrawing aliquots at indicated time points and measuring OD600 in a spectrophotometer.
Blue native PAGE
Blue native gels were prepared by standard published procedures (Wittig et al, 2006). For sample preparation, 50 μg of isolated mitochondria was lysed in 50 μl ice-cold lysis buffer (5% [w/v] digitonin [Calbiochem], 20 mM Tris pH 7.4, 50 mM NaCl, 0.5 mM EDTA, 1 mM PMSF, 10% [v/v] glycerol) and centrifuged for 15 min at 21,000 × g to remove non-solubilized material. To 45 μl of lysate, 5 μl of loading dye (5% [w/v] Coomassie brilliant blue G250, 50 mM imidazole pH 7.0, 500 mM ε-amino-n-caproic acid) was added. Samples were loaded on 6–16% polyacrylamide gradient gels and run at 4°C with current limited to 15 mA. Gels were transferred to PVDF membrane, and protein complexes were detected by immunodecoration with specific antisera.
Co-immunoprecipitation
Immunoprecipitation of the Flag epitope was performed using 20 μl of anti-Flag M2 affinity gel (Sigma) equilibrated three times in 500 μl wash buffer [0.2% (w/v) digitonin, 20 mM Tris pH 7.4, 150 mM NaCl, 0.5 mM EDTA, 1 mM PMSF, 5% (v/v) glycerol, protease inhibitors (Roche)]. 400 μg of isolated mitochondria was lysed in 800 μl of lysis buffer [1% (w/v) digitonin, 20 mM Tris pH 7.4, 150 mM NaCl, 0.5 mM EDTA, 1 mM PMSF, 5% (v/v) glycerol, protease inhibitors (Roche)] and centrifuged for 15 min at 21,000 × g to remove non-solubilized material. After removing a 40-μl sample (input), the remaining lysate was incubated with the beads at 4°C for 1 h on a rotating wheel. Beads were washed three times in wash buffer, and bound material was eluted with 0.5 M acetic acid (pH 3.4) and neutralized immediately with 1 M Tris base. Samples were precipitated with TCA and analyzed by SDS–PAGE and Western blotting.
IASD labeling
Labeling of MPC proteins with IASD (4-acetamido-4′-((iodoacetyl)amino)stilbene-2,2′-disulfonic acid, Molecular Probes) was performed essentially as described (Malhotra et al, 2013). Briefly, 20 μg of isolated mitochondria was either resuspended in 80 μl SEM buffer or SEM buffer containing 0.5% [v/v] Triton X-100. Mitochondrial proteins were then labeled by addition of IASD to a final concentration of 2.5 mM and incubation at 26°C for 20 min. Reactions were subsequently quenched by addition of 200 mM DTT. Samples were precipitated with TCA and examined by SDS–PAGE and Western blotting.
Protease protection assay
Fifty microgram of mitochondria was resuspended in either 100 μl SEM buffer (250 mM sucrose, 1 mM EDTA, 10 mM MOPS-KOH pH 7.2) or hypotonic swelling buffer (1 mM EDTA, 10 mM MOPS-KOH pH 7.2) or lysis buffer (SEM containing 0.5% Triton X-100). Reactions were split in two halves, to one of which was added 50 μg/ml proteinase K (PK). All reactions were subsequently incubated for 20 min on ice, and then, PK digestion was stopped by the addition of 2 mM phenylmethylsulfonyl fluoride (PMSF). Total mitochondrial protein was precipitated with TCA and analyzed by SDS–PAGE and Western blotting.
Chemical crosslinking
20 μg of isolated mitochondria was resuspended in 100 μl of SEM buffer, and the cross-linker disuccimidyl glutarate (DSG, Thermo Scientific) dissolved in 2 μl DMSO was added to a final concentration of 500 μM. After incubation for 30 min on ice, 25 mM Tris pH 7.4 was added to quench the reaction, and samples were incubated on ice for an additional 15 min. Mitochondria were re-isolated by centrifugation, washed, and analyzed by SDS–PAGE and Western blotting.
Pyruvate transport into isolated mitochondria
Pyruvate transport experiments were performed as described previously (Herzig et al, 2012), with minor modifications. For each time point, 250 μg of isolated mitochondria was resuspended in 50 μl pyruvate transport buffer pH 7.4 [PTB7.4; 250 mM sucrose, 80 mM KCl, 5 mM MgCl2, 10 mM MOPS pH 7.4, 0.1% (w/v) bovine serum albumin] and added to 150 μl pyruvate transport buffer pH 6.8 (PTB6.8; 250 mM sucrose, 80 mM KCl, 5 mM MgCl2, 10 mM MOPS pH 6.8, 0.1% [w/v] bovine serum albumin) containing 50 μM [14C]-pyruvate. Reactions were incubated on ice, and import was stopped at the indicated times by addition of 10 μM UK5099 (Sigma). Mitochondria were re-isolated by centrifugation for 1 min at 16,000 × g, washed with 500 μl PTB7.4 containing 50 mM cold pyruvate, and centrifuged again. Imported [14C]-pyruvate was quantified by scintillation counting. Values shown are means ± SEM of at least four independent experiments. For statistical analyses, the unpaired t-test was employed.
Plasmids, reagents, and enzyme activity measurements
Plasmids for expression of MPC subunits were generated by amplifying the open reading frames YGL080w (MPC1), YHR162w (MPC2), and YGR243w (MPC3) from WT (BY4741) genomic DNA by PCR and inserting the resulting sequences into the expression vector pRS313 or pRS316 (Sikorski & Hieter, 1989) containing the CYC1 promoter for low-level constitutive expression. Monoclonal antibodies were purchased from Sigma (anti-Flag), Roche (anti-GFP), or Covance (anti-HA). Polyclonal rabbit antisera were gifts from Dr. W. Voos (University of Bonn, Germany) and Dr. B. Westermann (University of Bayreuth, Germany). Pyruvate dehydrogenase complex activity was measured as described previously (Bender et al, 2011). Values shown are means ± SEM of three independent experiments.
Acknowledgments
The authors thank all members of the Martinou laboratory for their continuous input to this work, Dr. V. Compan for establishing chemical cross-linking protocols, S. Pierredon for expert technical assistance, and Dr. K. Maundrell for critical reading of the manuscript. Dr. R. Loewith kindly provided wild-type strain RL285-16C. Polyclonal antisera were gifts from Dr. W. Voos and Dr. B. Westermann. This work was supported by the Swiss National Science Foundation (31993A-141068/1), IGE3, the State of Geneva, the Ligue Genevoise Contre le Cancer, and the Deutsche Forschungsgemeinschaft (fellowship BE 5103/1-1 to T.B.).
Author contributions
TB and J-CM designed the study, GP performed yeast growth tests and PDH activity measurements, TB performed all other experiments, TB and J-CM analyzed data, and TB and J-CM wrote the article. All authors read and approved the article.
Conflict of interest
The authors declare that they have no conflict of interest.
Supporting Information
Supplementary Information
Review Process File
Source Data for Figure 1
Source Data for Figure 2
Source Data for Figure 3
Source Data for Figure 5
References
- de Assis LJ, Zingali RB, Masuda CA, Rodrigues SP, Montero-Lomeli M. Pyruvate decarboxylase activity is regulated by the Ser/Thr protein phosphatase Sit4p in the yeast Saccharomyces cerevisiae. FEMS Yeast Res. 2013;13:518–528. doi: 10.1111/1567-1364.12052. [DOI] [PubMed] [Google Scholar]
- Bender T, Lewrenz I, Franken S, Baitzel C, Voos W. Mitochondrial enzymes are protected from stress-induced aggregation by mitochondrial chaperones and the Pim1/LON protease. Mol Biol Cell. 2011;22:541–554. doi: 10.1091/mbc.E10-08-0718. [DOI] [PMC free article] [PubMed] [Google Scholar]
- Bricker DK, Taylor EB, Schell JC, Orsak T, Boutron A, Chen YC, Cox JE, Cardon CM, Van Vranken JG, Dephoure N, Redin C, Boudina S, Gygi SP, Brivet M, Thummel CS, Rutter J. A mitochondrial pyruvate carrier required for pyruvate uptake in yeast, Drosophila, and humans. Science. 2012;337:96–100. doi: 10.1126/science.1218099. [DOI] [PMC free article] [PubMed] [Google Scholar]
- Crichton PG, Harding M, Ruprecht JJ, Lee Y, Kunji ERS. Lipid, detergent, and Coomassie Blue G-250 affect the migration of small membrane proteins in blue native gels: mitochondrial carriers migrate as monomers not dimers. J Biol Chem. 2013;288:22163–22173. doi: 10.1074/jbc.M113.484329. [DOI] [PMC free article] [PubMed] [Google Scholar]
- De Deken RH. The Crabtree effect: a regulatory system in yeast. J Gen Microbiol. 1966;44:149–156. doi: 10.1099/00221287-44-2-149. [DOI] [PubMed] [Google Scholar]
- Diaz-Ruiz R, Uribe-Carvajal S, Devin A, Rigoulet M. Tumor cell energy metabolism and its common features with yeast metabolism. Biochim Biophys Acta. 2009;1796:252–265. doi: 10.1016/j.bbcan.2009.07.003. [DOI] [PubMed] [Google Scholar]
- Diaz-Ruiz R, Rigoulet M, Devin A. The Warburg and Crabtree effects: on the origin of cancer cell energy metabolism and of yeast glucose repression. Biochim Biophys Acta. 2011;1807:568–576. doi: 10.1016/j.bbabio.2010.08.010. [DOI] [PubMed] [Google Scholar]
- Gey U, Czupalla C, Hoflack B, Rödel G, Krause-Buchholz U. Yeast pyruvate dehydrogenase complex is regulated by a concerted activity of two kinases and two phosphatases. J Biol Chem. 2008;283:9759–9767. doi: 10.1074/jbc.M708779200. [DOI] [PubMed] [Google Scholar]
- Gray LR, Tompkins SC, Taylor EB. Regulation of pyruvate metabolism and human disease. Cell Mol Life Sci. 2013;71:2577–2604. doi: 10.1007/s00018-013-1539-2. [DOI] [PMC free article] [PubMed] [Google Scholar]
- Halestrap AP, Denton RM. Specific inhibition of pyruvate transport in rat liver mitochondria and human erythrocytes by alpha-cyano-4-hydroxycinnamate. Biochem J. 1974;138:313–316. doi: 10.1042/bj1380313. [DOI] [PMC free article] [PubMed] [Google Scholar]
- Halestrap AP. The mitochondrial pyruvate carrier. Kinetics and specificity for substrates and inhibitors. Biochem J. 1975;148:85–96. doi: 10.1042/bj1480085. [DOI] [PMC free article] [PubMed] [Google Scholar]
- Hebert AS, Dittenhafer-Reed KE, Yu W, Bailey DJ, Selen ES, Boersma MD, Carson JJ, Tonelli M, Balloon AJ, Higbee AJ, Westphall MS, Pagliarini DJ, Prolla TA, Assadi-Porter F, Roy S, Denu JM, Coon JJ. Calorie restriction and SIRT3 trigger global reprogramming of the mitochondrial protein acetylome. Mol Cell. 2013;49:186–199. doi: 10.1016/j.molcel.2012.10.024. [DOI] [PMC free article] [PubMed] [Google Scholar]
- Herzig S, Raemy E, Montessuit S, Veuthey JL, Zamboni N, Westermann B, Kunji ER, Martinou JC. Identification and functional expression of the mitochondrial pyruvate carrier. Science. 2012;337:93–96. doi: 10.1126/science.1218530. [DOI] [PubMed] [Google Scholar]
- Jezegou A, Llinares E, Anne C, Kieffer-Jaquinod S, O'Regan S, Aupetit J, Chabli A, Sagne C, Debacker C, Chadefaux-Vekemans B, Journet A, Andre B, Gasnier B. Heptahelical protein PQLC2 is a lysosomal cationic amino acid exporter underlying the action of cysteamine in cystinosis therapy. Proc Natl Acad Sci USA. 2012;109:E3434–E3443. doi: 10.1073/pnas.1211198109. [DOI] [PMC free article] [PubMed] [Google Scholar]
- Kaplon J, Zheng L, Meissl K, Chaneton B, Selivanov VA, Mackay G, van der Burg SH, Verdegaal EM, Cascante M, Shlomi T, Gottlieb E, Peeper DS. A key role for mitochondrial gatekeeper pyruvate dehydrogenase in oncogene-induced senescence. Nature. 2013;498:109–112. doi: 10.1038/nature12154. [DOI] [PubMed] [Google Scholar]
- Kohlhaw GB. Leucine biosynthesis in fungi: entering metabolism through the back door. Microbiol Mol Biol Rev. 2003;67:1–15. doi: 10.1128/MMBR.67.1.1-15.2003. [DOI] [PMC free article] [PubMed] [Google Scholar]
- Koppenol WH, Bounds PL, Dang CV. Otto Warburg's contributions to current concepts of cancer metabolism. Nat Rev Cancer. 2011;11:325–337. doi: 10.1038/nrc3038. [DOI] [PubMed] [Google Scholar]
- Krause-Buchholz U, Gey U, Wunschmann J, Becker S, Rödel G. YIL042c and YOR090c encode the kinase and phosphatase of the Saccharomyces cerevisiae pyruvate dehydrogenase complex. FEBS Lett. 2006;580:2553–2560. doi: 10.1016/j.febslet.2006.04.002. [DOI] [PubMed] [Google Scholar]
- Lee AC, Xu X, Blachly-Dyson E, Forte M, Colombini M. The role of yeast VDAC genes on the permeability of the mitochondrial outer membrane. J Membr Biol. 1998;161:173–181. doi: 10.1007/s002329900324. [DOI] [PubMed] [Google Scholar]
- Li CL, Wang M, Ma XY, Zhang W. NRGA1, a putative mitochondrial pyruvate carrier, mediates ABA regulation of guard cell ion channels and drought stress responses in Arabidopsis. Mol Plant. 2014;7:1508–1521. doi: 10.1093/mp/ssu061. [DOI] [PubMed] [Google Scholar]
- Malhotra K, Sathappa M, Landin JS, Johnson AE, Alder NN. Structural changes in the mitochondrial Tim23 channel are coupled to the proton-motive force. Nat Struct Mol Biol. 2013;20:965–972. doi: 10.1038/nsmb.2613. [DOI] [PubMed] [Google Scholar]
- Mumberg D, Müller R, Funk M. Yeast vectors for the controlled expression of heterologous proteins in different genetic backgrounds. Gene. 1995;156:119–122. doi: 10.1016/0378-1119(95)00037-7. [DOI] [PubMed] [Google Scholar]
- Papa S, Francavilla A, Paradies G, Meduri B. The transport of pyruvate in rat liver mitochondria. FEBS Lett. 1971;12:285–288. doi: 10.1016/0014-5793(71)80200-4. [DOI] [PubMed] [Google Scholar]
- Proft M, Gibbons FD, Copeland M, Roth FP, Struhl K. Genomewide identification of Sko1 target promoters reveals a regulatory network that operates in response to osmotic stress in Saccharomyces cerevisiae. Eukaryot Cell. 2005;4:1343–1352. doi: 10.1128/EC.4.8.1343-1352.2005. [DOI] [PMC free article] [PubMed] [Google Scholar]
- Pronk JT, Yde Steensma H, Van Dijken JP. Pyruvate metabolism in Saccharomyces cerevisiae. Yeast. 1996;12:1607–1633. doi: 10.1002/(sici)1097-0061(199612)12:16<1607::aid-yea70>3.0.co;2-4. [DOI] [PubMed] [Google Scholar]
- Rong Y, Wu W, Ni X, Kuang T, Jin D, Wang D, Lou W. Lactate dehydrogenase A is overexpressed in pancreatic cancer and promotes the growth of pancreatic cancer cells. Tumour Biol. 2013;34:1523–1530. doi: 10.1007/s13277-013-0679-1. [DOI] [PubMed] [Google Scholar]
- Ryan MT, Voos W, Pfanner N. Assaying protein import into mitochondria. Methods Cell Biol. 2001;65:189–215. doi: 10.1016/s0091-679x(01)65012-x. [DOI] [PubMed] [Google Scholar]
- Sack MN, Finkel T. Mitochondrial metabolism, sirtuins, and aging. Cold Spring Harb Perspect Biol. 2012;4:a013102. doi: 10.1101/cshperspect.a013102. [DOI] [PMC free article] [PubMed] [Google Scholar]
- Schell JC, Olson KA, Jiang L, Hawkins AJ, Van Vranken JG, Xie J, Egnatchik RA, Earl EG, DeBerardinis RJ, Rutter J. A role for the mitochondrial pyruvate carrier as a repressor of the warburg effect and colon cancer cell growth. Mol Cell. 2014;56:400–413. doi: 10.1016/j.molcel.2014.09.026. [DOI] [PMC free article] [PubMed] [Google Scholar]
- Schonauer MS, Kastaniotis AJ, Kursu VA, Hiltunen JK, Dieckmann CL. Lipoic acid synthesis and attachment in yeast mitochondria. J Biol Chem. 2009;284:23234–23242. doi: 10.1074/jbc.M109.015594. [DOI] [PMC free article] [PubMed] [Google Scholar]
- Sikorski RS, Hieter P. A system of shuttle vectors and yeast host strains designed for efficient manipulation of DNA in Saccharomyces cerevisiae. Genetics. 1989;122:19–27. doi: 10.1093/genetics/122.1.19. [DOI] [PMC free article] [PubMed] [Google Scholar]
- Timón-Gómez A, Proft M, Pascual-Ahuir A. Differential regulation of mitochondrial pyruvate carrier genes modulates respiratory capacity and stress tolerance in yeast. PLoS ONE. 2013;8:e79405. doi: 10.1371/journal.pone.0079405. [DOI] [PMC free article] [PubMed] [Google Scholar]
- Vacanti NM, Divakaruni AS, Green CR, Parker SJ, Henry RR, Ciaraldi TP, Murphy AN, Metallo CM. Regulation of substrate utilization by the mitochondrial pyruvate carrier. Mol Cell. 2014;56:425–435. doi: 10.1016/j.molcel.2014.09.024. [DOI] [PMC free article] [PubMed] [Google Scholar]
- Van Urk H, Voll WS, Scheffers WA, Van Dijken JP. Transient-state analysis of metabolic fluxes in crabtree-positive and crabtree-negative yeasts. Appl Environ Microbiol. 1990;56:281–287. doi: 10.1128/aem.56.1.281-287.1990. [DOI] [PMC free article] [PubMed] [Google Scholar]
- Vander Heiden MG, Cantley LC, Thompson CB. Understanding the Warburg effect: the metabolic requirements of cell proliferation. Science. 2009;324:1029–1033. doi: 10.1126/science.1160809. [DOI] [PMC free article] [PubMed] [Google Scholar]
- Wittig I, Braun HP, Schägger H. Blue native PAGE. Nat Protoc. 2006;1:418–428. doi: 10.1038/nprot.2006.62. [DOI] [PubMed] [Google Scholar]
- Xu Y, Tao Y, Cheung LS, Fan C, Chen LQ, Xu S, Perry K, Frommer WB, Feng L. Structures of bacterial homologues of SWEET transporters in two distinct conformations. Nature. 2014;515:448–452. doi: 10.1038/nature13670. [DOI] [PMC free article] [PubMed] [Google Scholar]
- Yang C, Ko B, Hensley CT, Jiang L, Wasti AT, Kim J, Sudderth J, Calvaruso MA, Lumata L, Mitsche M, Rutter J, Merritt ME, DeBerardinis RJ. Glutamine oxidation maintains the TCA cycle and cell survival during impaired mitochondrial pyruvate transport. Mol Cell. 2014;56:414–424. doi: 10.1016/j.molcel.2014.09.025. . [DOI] [PMC free article] [PubMed] [Google Scholar]
Associated Data
This section collects any data citations, data availability statements, or supplementary materials included in this article.
Supplementary Materials
Supplementary Information
Review Process File
Source Data for Figure 1
Source Data for Figure 2
Source Data for Figure 3
Source Data for Figure 5