

Abstract
Compartmentalized cAMP signaling regulates mitochondrial dynamics, morphology, and oxidative phosphorylation. However, regulators of the mitochondrial cAMP pathway, and its broad impact on organelle function, remain to be explored. Here, we report that Drosophila Prune is a cyclic nucleotide phosphodiesterase that localizes to the mitochondrial matrix. Knocking down prune in cultured cells reduces mitochondrial transcription factor A (TFAM) and mitochondrial DNA (mtDNA) levels. Our data suggest that Prune stabilizes TFAM and promotes mitochondrial DNA (mtDNA) replication through downregulation of mitochondrial cAMP signaling. In addition, our work demonstrates the prevalence of mitochondrial cAMP signaling in metazoan and its new role in mitochondrial biogenesis.
Keywords: cyclic adenosine 3′,5′-monophosphate; cyclic nucleotide phosphodiesterase; mitochondrial DNA; mitochondrial transcription factor A; neurodegeneration
Introduction
Mitochondria produce ATP through oxidative phosphorylation (OXPHOS) and are involved in various biosynthesis and cellular signaling processes 1. While the majority of mitochondrial proteins are encoded in nuclear DNA (nuDNA), mitochondria contain their own genome, the circular dsDNA in the matrix mitochondrial DNA (mtDNA). mtDNA encodes 13 essential subunits of electron transport chain (ETC) complexes, 2 rRNAs, and 22 tRNAs for mitochondrial translation 1. mtDNA maintenance is essential for mitochondrial biogenesis and cellular energy homeostasis 2. The mtDNA level is tightly maintained in any given cell type, but varies among different tissues to cope with their specific energy demands 3. Additionally, developmentally regulated mtDNA replication is involved in mtDNA inheritance and cell differentiation 4, 5. Defects in mtDNA replication/maintenance often deplete mtDNA and lead to severe human disorders 6, 7.
mtDNA replication is carried out by a set of organelle-specific replication factors including mtDNA polymerase (Tamas), DNA helicase (Twinkle), RNA polymerase (mtRNApol), and transcription factor A (TFAM) 3. However, little is known regarding cellular signaling pathways that regulate mtDNA replication in response to physiological status or developmental cues in a cell. As an important second messenger, cAMP is produced by either adenylyl cyclase (AC) on the plasma membrane or cytosolic soluble adenylyl cyclase (sAC). cAMP activates protein kinase A (PKA), which in turn regulates diverse cellular processes 8, 9. cAMP is degraded by phosphodiesterase (PDE) that downregulates cAMP/PKA signaling. Of note, PKA and cAMP metabolizing enzymes are often compartmentalized, ensuring the specificity of cAMP/PKA signaling 10.
Mitochondria contain two distinct cAMP-signaling compartments 11. The surface of the outer membrane provides a docking site for cAMP-signaling proteins, which in turn regulate mitochondrial fusion and fission 12. In mammals, cAMP can also be produced inside the matrix by a mitochondrial soluble adenylyl cyclase (sAC) and directly regulates energy metabolism through PKA-dependent phosphorylation of several enzymes in TCA cycle and ETC complexes 13. A recent study demonstrated that TFAM could be phosphorylated by PKA and subsequently degraded by matrix Lon protease in human cultured cells 14. It suggests a link between mtDNA maintenance and cAMP/PKA signaling. However, the molecular nature of mitochondrial cAMP signaling and its broad impact on mitochondrial function remain to be explored. Additionally, the lack of sAC in the genomes of Drosophila and C. elegans challenges the existence of intra-mitochondrial cAMP signaling in these organisms 15. Herein, we report that Drosophila prune (pn), an eye color gene, encodes a mitochondrial PDE. Prune (Pn) downregulates cAMP level and promotes mtDNA replication through stabilizing TFAM. Our work proves the existence of cAMP signaling in Drosophila mitochondria and demonstrates a new role in mitochondrial biogenesis.
Results and Discussion
Pn is required for mtDNA maintenance
pn was recovered from an ongoing RNAi screening for genes that regulate the mtDNA level in Drosophila S2 cells. Knockdown of pn significantly reduced the mtDNA/nuDNA ratio to 30% of control cells that were incubated with lacZ dsRNA. To rule out the potential off-target effect of dsRNA used in the initial screening, we produced another dsRNA corresponding to the 3′ UTR of pn mRNA. We found that the 3′ UTR-dsRNA also efficiently knocked down the pn mRNA level (Supplementary Fig S1A) and reduced the mtDNA/nuDNA ratio (Fig1A). Additionally, this phenotype was partially rescued by expressing pn cDNA that lacks 3′ UTR (Fig1A). These results demonstrate that Pn is required for maintaining the mtDNA/nuDNA ratio in cultured cells.
Figure 1.
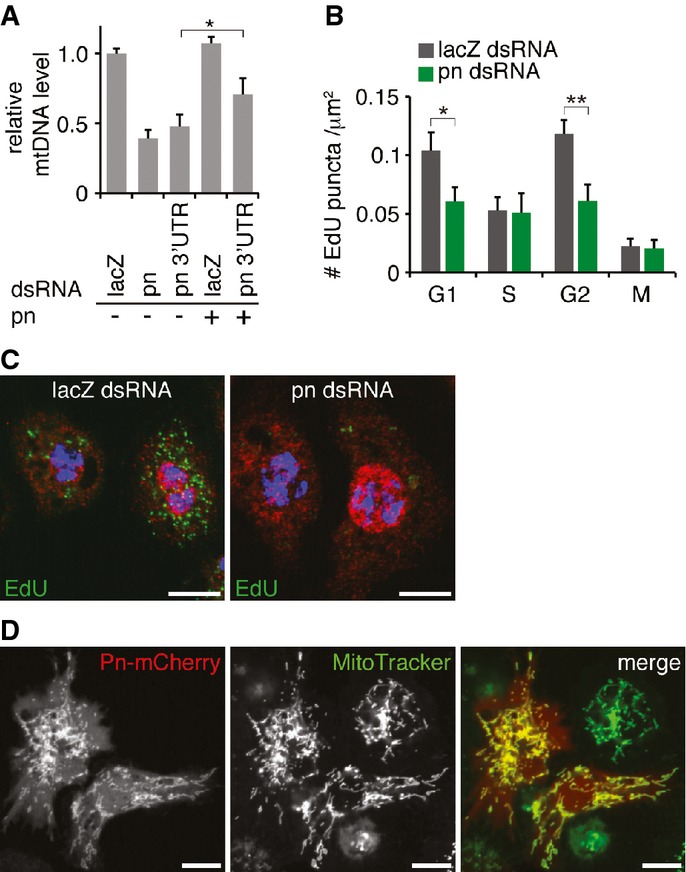
- qPCR analysis of mtDNA level in pn RNAi and control cells. Cells incubated with dsRNAs against pn ORF or pn 3′UTR have reduced mtDNA level compared to control (LacZ). Expression of pn cDNA partially restores mtDNA level in pn 3′UTR RNAi cell. Bars indicate mean ± SD (n = 3, *P < 0.05, unpaired, two-tailed Student's t-test).
- Quantification of mtDNA replication (# EdU puncta/μm2) at different cell cycle phases of control and pn RNAi cells. pn knockdown reduces mtDNA replication in G1 and G2 phases. Bars indicate mean ± SEM (n = 34, *P < 0.05, **P < 0.01, unpaired, two-tailed Student's t-test).
- Representative images of S2 cells incubated with EdU (green) and co-stained with DAPI (blue) and cyclin E (red). pn knockdown reduces mtDNA replication (perinuclear EdU puncta), particularly in cells at gap phase (cyclin E, red). Scale bars: 10 μm.
- A representative image of S2 cells expressing Pn–mCherry (red), co-stained with MitoTracker (green). Scale bars: 10 μm.
To test whether Pn regulates mtDNA replication, we used EdU incorporation assay to visualize mtDNA replication 4. A 2-h pulse of EdU incubation resulted in intensive signal in nuclei and many perinuclear puncta in control cells (Supplementary Fig S1C). The EdU puncta were co-localized with a mitochondrial marker, Tom20, and the number of puncta was reduced in mitochondrial RNA polymerase CG4644 RNAi cells compared to control (Supplementary Fig S1B and C), verifying that the puncta indeed labeled mtDNA replication. We noticed that the number of EdU puncta often varied significantly, even among the neighboring cells in the same experiment (Fig1C). To test whether this intrinsic variation of mtDNA replication is related to cell cycle as recently demonstrated in mammalian cells 16, we co-stained EdU-incubated cells with different cell cycle markers: cyclin E for G1, nuclear EdU incorporation for S phase, cyclin A for G2, and phospho-histone H3 (PH3) for mitosis 17, 18. We found that mitochondrial EdU incorporation was higher in cells at G1 and G2 phase than in S phase and mitosis (Supplementary Fig S1D). These two waves of mtDNA replication prior to and post-S phase (Fig1B) indicate a sequential coordination between nuclear and mtDNA replication in S2 cells. Of primary importance, knockdown of pn led to significant reduction in mtDNA replication in gap phases, demonstrating that Pn promotes mtDNA replication (Fig1B and C).
Pn is a mitochondrial PDE
pn mutant flies have reduced red eye pigments, pterins that are synthesized from GTP 19. Besides a potential role in nucleotide metabolism, little is known about Pn's molecular functions. We found that pn mutant flies showed minor morphogenesis defect and severe retinal degeneration (Fig 5C and D). It suggests that Pn is essential for maintaining neuronal integrity besides involvement in eye pigment biosynthesis. Additionally, a putative mitochondrial targeting sequence (MTS) is predicted at the N-terminus of Pn (Supplementary Fig S2A), indicating a potential link between Pn and mitochondria. To test whether Pn is indeed a mitochondrial protein, we expressed Pn tagged with mCherry at C-terminus (Pn–mCherry) in S2 cells and co-stained with a mitochondrial-specific dye, MitoTracker. Though a low-level red fluorescent protein localized in the cytoplasm, the majority of Pn–mCherry was co-localized with MitoTracker (Fig1D). Western blot also confirmed that Pn was enriched in the crude mitochondrial preparation (Supplementary Fig S2B). The deletion of the putative MTS in N-terminus led to a loss of the punctate signal (Supplementary Fig S2C), suggesting that the N-terminus of Pn is essential for its mitochondrial localization. We also made a transgenic line expressing Pn–GFP fusion protein under the control of hsp70 promoter (hs-pn). We found that Pn–GFP was co-localized with MitoTracker in various tissues (Supplementary Fig S2D and E), further validating that Pn is a mitochondrial protein. Noteworthy, a truncated pn ORF that lacks N-terminal 50 amino acid residues failed to rescue phenotypes of pn flies 20, while hs-pn rescued the eye color phenotype and prevented retinal degeneration (Fig 5D). These results suggest that the mitochondrial localization of Pn is essential for its biological functions.
Pn contains conserved DHH and DHHA2 domains (Supplementary Fig S2A), signatures of inorganic pyrophosphatase, or phosphodiesterase that break down Pi-Pi or Pi-O bond, respectively 21. During DNA replication, the incorporation of dideoxynucleotide triphosphates produces pyrophosphate (PPi), which inhibits DNA polymerization. A pyrophosphatase breaks down PPi to two molecules of Pi and relieves the inhibitory effect of PPi on DNA replication 22. Thus, Pn might be a mitochondrial inorganic pyrophosphatase and promote mtDNA replication by removing PPi. Alternatively, Pn could be a mitochondrial PDE and modulate mtDNA replication through mitochondrial cAMP signaling. To test these possibilities, we expressed Pn in E. coli and directly examined its enzymatic activities in vitro. We found that Pn demonstrated little pyrophosphatase activity in a direct assay (Supplementary Fig S3A). Instead, Pn effectively converted cAMP to AMP (Km = 19.42 ± 15.80 μM, Kcat = 2.06 × 10⁻³ ± 0.80 × 10⁻³ s−1), and the reaction could be inhibited by IBMX, a competitive inhibitor of PDEs (Fig2A and B). Furthermore, Pn also showed cGMP PDE activity (Km = 17.97 ± 10.78 μM, Kcat = 1.23 × 10⁻³ ± 0.14 × 10⁻³ s−1) (Supplementary Fig S3B and C). Taken together, these results show that Pn is a mitochondrial PDE that may regulate mitochondrial cAMP signaling.
Figure 2.
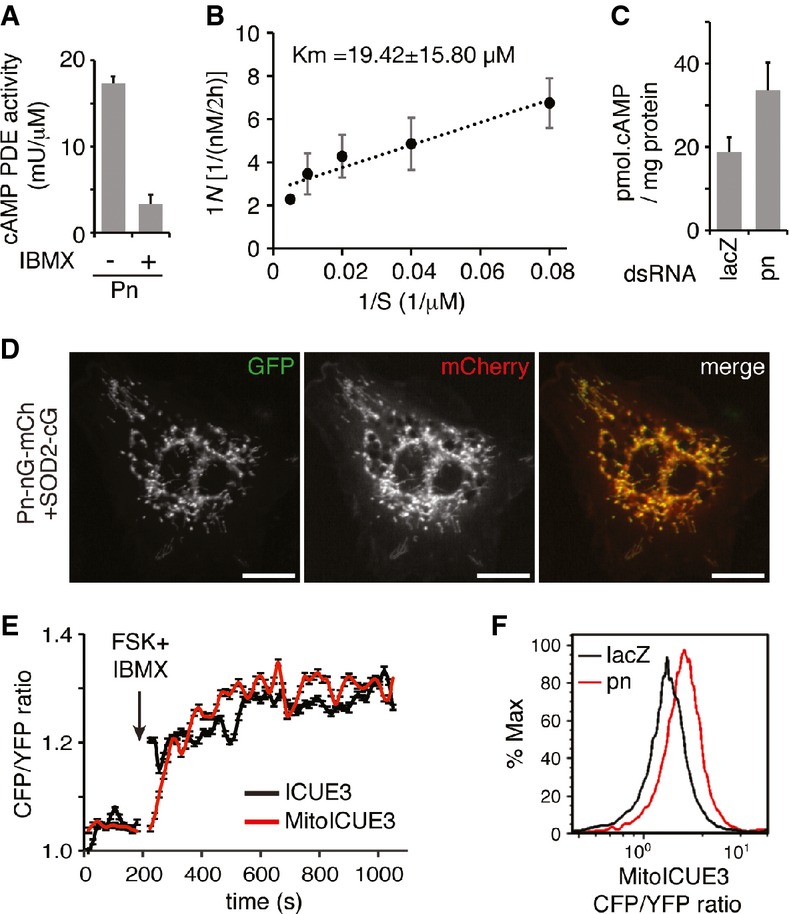
- Pn demonstrates cAMP PDE activity, hydrolyzing cAMP to AMP. A total of 200 μM 3′, 5′-cAMP was incubated with purified Pn protein with or without IBMX for 2 h. PDE activity is indicated as the amount of final 5′AMP normalized with time and Pn protein concentration (mU/μM, 1 U = 1 nM 5′AMP/min). Bars indicate mean ± SD (n = 3).
- Lineweaver–Burk plot showing Km and Vmax of Pn's PDE activity for cAMP. Each data point represents the reciprocal value of the reaction velocity (y-axis) corresponding to the reciprocal of substrate concentration (x-axis). V: cAMP hydrolysis rate as nM/2 h; S: cAMP concentration as μM. Bars indicate mean ± SD (n = 3). The x-intercept of the plot is an estimate of −1/Km, while the y-intercept is an estimate of the inverse of Vmax.
- cAMP levels in mitochondria isolated from control and pn RNAi cells. pn knockdown significantly increases mitochondrial cAMP levels compared with control (P < 0.05, unpaired, two-tailed Student's t-test). Bars indicate mean ± SD (n = 3).
- Representative images of S2 cell co-expressing Pn–nGFP–mCherry (red) and SOD2–cGFP. Two half-GFP molecules reconstitute into a functional whole GFP (green), demonstrating that Pn–nGFP–mCherry is co-localized with SOD2–cGFP in mitochondrial matrix. Scale bars: 20 μm.
- FACS analyses of cells expressing ICUE3 and MitoICUE3 showing increased CFP-to-YFP emission ratio after adding forskolin and IBMX (arrow). Each data point represents mean ± SEM of > 200 cells over every 15-s span.
- pn RNAi cells have increased CFP-to-YFP emission ratio of MitoICUE3 compared with control in FACS analyses, indicating an increased mitochondrial cAMP level.
Pn regulates matrix cAMP levels
Mitochondria contain two distinct cAMP-signaling compartments: the outer membrane and the matrix 11. To further understand Pn's function, we investigated its sub-mitochondrial localization. We developed an assay based on the concept of bimolecular fluorescence complementation (BiFC) wherein two halves of a GFP molecule will reconstitute into the native structure and become fluorescent when they locate in physical proximity 23. We co-expressed a Pn fused with the N-terminal half of GFP (Pn–nGFP–mCherry), with a known mitochondrial protein fused to the C-terminal half of GFP (Supplementary Fig S2F). These two fusion proteins were encoded in a single polycistron with a self-processing viral T2A sequence in between 24. Thus, two proteins would be expressed concurrently and at equal level. Additionally, mCherry was fused to Pn–nGFP to monitor its expression and localization. We found that Pn–nGFP–mCherry complemented with a matrix protein SOD2–cGFP to reconstitute functional GFP molecules (Fig2D). It did not complement with Tom20–cGFP or i–AAA–cGFP that localize to the outer membrane or the inter-membrane space, respectively (Supplementary Fig S2G). These results indicate that Pn localizes to mitochondrial matrix.
Pn's mitochondrial matrix localization and PDE activity suggest that it might regulate intramitochondrial cAMP signaling. To test this idea, we used ICUE3 25, 26, a FRET-based genetic reporter, to examine the mitochondrial cAMP level. cAMP binds to ICUE3, which decreases CFP–YFP FRET efficiency and increases CFP-to-YFP ratio 25. We constructed a mitochondrially targeted ICUE3 (MitoICUE3) by fusing ICUE3 with the full-length SOD2, a bona fide mitochondrial protein, to ensure the efficient mitochondria targeting. When expressed in S2 cells, MitoICUE3 co-localized with MitoTracker (Supplementary Fig S3E). Additionally, Western blots revealed MitoICUE3 in the mitochondrial fraction (Supplementary Fig S3D), but not in the cytosolic fraction, suggesting MitoICUE3 was predominantly localized to mitochondria. Therefore, the MitoICUE3 could reliably report cAMP in mitochondria specifically. We used an established procedure to augment cytosolic cAMP level by treating S2 cells with a combination of forskolin, an activator of membrane adenylyl cyclase, and IBMX, an inhibitor of PDEs 11. We found that CFP-to-YFP ratios were increased about 30% in both ICUE3- and MitoICUE3-expressing cells (Fig2E), indicating increased cAMP level in both cytoplasm and mitochondria. We also found that the ratio of CFP to YFP of Mito-ICUE3 was higher in the pn RNAi cells compared with the control cells (Fig2F), indicating a higher cAMP level in mitochondrial matrix of pn RNAi cells. To directly assess the impact of Pn on mitochondrial cAMP level, we measured cAMP level in mitochondria isolated from control and pn RNAi cells (Fig2C). We found that the cAMP concentration was 18.8 ± 3.5 pmol per mg protein, or ∽20 μM based on the notion that mitochondrial water content is about 1 μl/mg protein 27. cAMP in mitochondria of pn RNAi cells was 33.5 ± 6.7 pmol per mg protein. Taken together, these results not only demonstrate the presence of cAMP in the mitochondrial matrix of Drosophila S2 cells, but also confirm that Pn downregulates mitochondrial cAMP level.
Pn maintains TFAM level
To understand how Pn impacts mtDNA replication, we checked the levels of several key factors of mtDNA replication machinery, including Tamas, TFAM, and Twinkle 3. We found that pn knockdown decreased the TFAM protein level (Fig3A), but had no impact on Tamas or Twinkle. Additionally, the level of Tfam mRNA was comparable in pn knockdown and control cells (Supplementary Fig S4A), suggesting that TFAM protein was decreased via a posttranscriptional mechanism. TFAM and mtDNA levels are well coordinated under various conditions. Overexpression or downregulation of the TFAM level modulates the mtDNA level proportionally 28. Depletion and repletion of mtDNA can also regulate TFAM level reciprocally 29. To determine whether the decrease in TFAM causes mtDNA reduction, or vice versa in pn RNAi cells, we checked time courses of TFAM and mtDNA levels after the addition of pn dsRNA (Fig3C and D). We found that mtDNA level showed a steep decline 3 days after the addition of pn dsRNA, while TFAM level showed a steep decline 2 days after. These results indicate that TFAM reduction is prior to the mtDNA reduction. In addition, overexpression of TFAM restored mtDNA level in pn knockdown cells (Fig3B), further supporting that reduced mtDNA level was caused by the decrease of TFAM.
Figure 3.
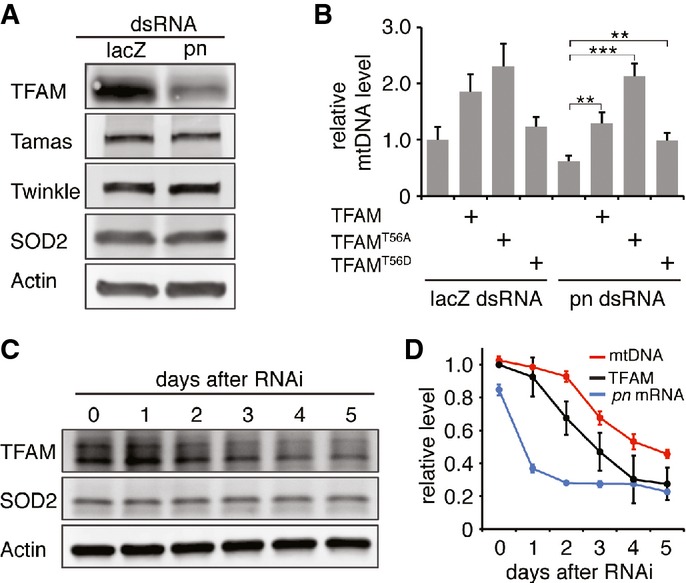
- Western blots reveal that TFAM is reduced in pn RNAi cells, and the levels of Tamas and Twinkle are not altered. SOD2 and actin were used as loading controls for mitochondrial contents and total cellular extract, respectively.
- qPCR analysis of mtDNA level reveals that overexpression of TFAM, TFAMT56A, and TFAMT56D restore mtDNA levels in pn RNAi cells. Bars indicate mean ± SD (n = 3, **P < 0.01, ***P < 0.001, unpaired, two-tailed Student's t-test).
- Western blot analysis of TFAM on consecutive days after the onset of pn RNAi. SOD2 and actin were used as loading controls.
- Levels of pn mRNA, mtDNA, and TFAM on consecutive days after pn RNAi. Data are presented as mean ± SD (n = 3). Note that TFAM level is significantly reduced on day 2 compared to day 1 (P < 0.01, unpaired, two-tailed Student's t-test); mtDNA level is significantly reduced on day 3 compared to day 2 (P < 0.001, unpaired, two-tailed Student's t-test).
In human cultured cells, TFAM is phosphorylated by PKA and subsequently degraded by the matrix Lon protease 14. Drosophila TFAM level is also regulated by Lon protease 30. Notably, a PKA phosphorylation site, Thr56, is highly conserved between Drosophila and mammals 31 (Supplementary Fig S4B). Indeed, TFAM appeared to be phosphorylated by PKA, evidenced by the Western blot of immunopurified TFAM probed with anti-phospho-PKA substrate (Fig4A). In addition, phosphorylation level of TFAM was increased in pn RNAi cells, but decreased in PKA RNAi cells. These results demonstrate that Drosophila TFAM is phosphorylated by PKA and suggest a conserved regulatory mechanism of TFAM by cAMP/PKA signaling.
Figure 4.
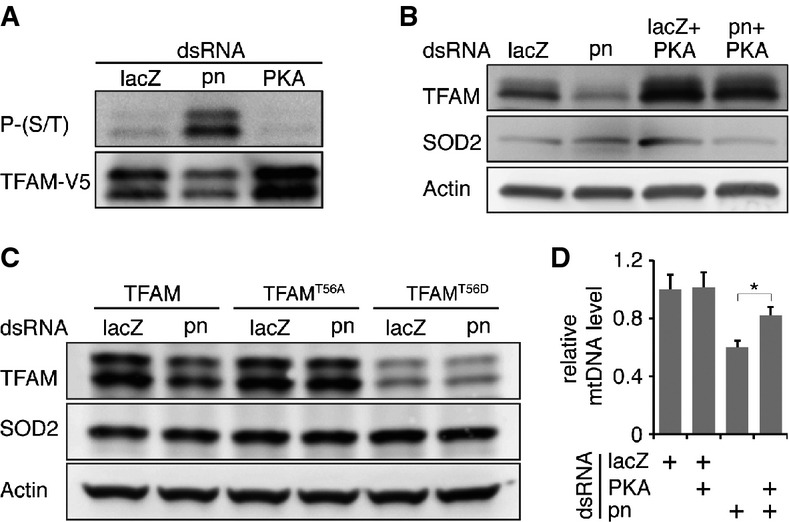
- Western blot reveals that TFAM is phosphorylated by PKA, which is downregulated in pn RNAi cells. TFAM-V5 fusion protein, immunopurified from LacZ, pn, or PKA RNAi cells, was probed with anti-phospho-PKA substrate and anti-V5 antibodies.
- Western blot reveals that PKA knockdown restores TFAM level in pn RNAi cells.
- Western blot analysis of TFAM, TFAMT56A, and TFAMT56D proteins in control (lacZ) and pn RNAi cells.
- qPCR of mtDNA demonstrates that PKA knockdown partially restores mtDNA level in pn RNAi cells. Bars indicate mean ± SD (n = 3, *P < 0.05, unpaired, two-tailed Student's t-test).
We mutated the Thr56 to Ala and Asp to mimic the non-phosphorylated and phosphorylated states, respectively. When expressed in S2 cells, both mutants, TFAMT56A and TFAMT56D, localized to mitochondria properly (Supplementary Fig S4E). To examine the stabilities of TFAM mutants, we generated stable cell lines expressing TFAM, TFAMT56A, or TFAMT56D. While the mRNA levels of three transgenes were comparable (Supplementary Fig S4C), the protein levels at steady state varied. TFAMT56A was higher than wild-type TFAM, whereas TFAMT56D was lower regardless of pn knockdown, suggesting that PKA phosphorylation regulates TFAM stability (Fig4C). Wild-type TFAM level was reduced in pn RNA cells compared to control. However, levels of TFAMT56A and TFAMT56D were insensitive to pn knockdown. These results demonstrate that non-phosphorylated TFAM is stable, whereas phosphomimetic TFAM is downregulated via a mechanism downstream of Pn. TFAMT56D was the least stable and also had the least impact on the steady-state mtDNA level or restoring of mtDNA level in pn RNAi cells (Fig3B). Moreover, the knockdown of PKA (Supplementary Fig S4D) also partially restored TFAM and mtDNA levels in pn RNAi cells (Fig4B and D). Collectively, these results demonstrate that Pn, as a mitochondrial PDE, inhibits cAMP/PKA signaling in the matrix, thereby stabilizing TFAM and promoting mtDNA replication (Supplementary Fig S5C).
Pn maintains neuronal integrity
Consistent with the observations in cultured cells, TFAM protein level was also reduced in the adult tissues, especially in the eye of pn flies compared with wild-type (Fig5A). Additionally, young mutant flies showed minor morphogenesis defects, and the combination of pn mutation and Tfam RNAi in post-mitotic tissues driven by GMR-gal4 led to severely deformed eyes. In contrast, Tfam RNAi alone did not cause any obvious defect (Fig5B). Furthermore, old pn flies displayed severe retinal degeneration that can be rescued by a pn cDNA transgene (Fig5C and D). We combined pn with mutations on cinnabar and brown (cn bw), two genes that function in eye pigment transport 32. cn bw flies have white eyes that are completely devoid of any eye pigment 32. We found that pn, cn bw flies showed severe retinal degeneration (Fig5C), demonstrating that this degenerative phenotype is independent of the defective pigment composition in pn flies. Taken together, these results further confirm Pn's function in maintaining TFAM and suggest an important role of mitochondrial cAMP signaling in neural morphogenesis and maintenance.
Figure 5.
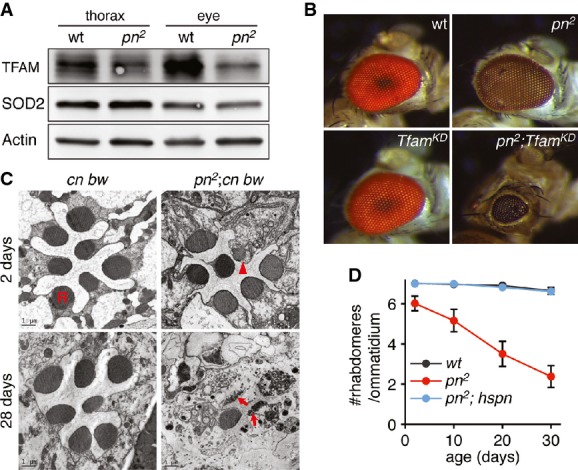
- Western blot demonstrates reduced TFAM level in the thorax and eye of pn mutant flies (pn2) compared with wild-type (wt). SOD2 and actin were used as loading controls.
- Knockdown of Tfam (TfamKD) in post-mitotic tissues driven by GMR-gal4 leads to severely deformed eyes in pn mutant background, but has no obvious defect in the wild-type background.
- Electron microscopic analyses of retina sections of young (2 days) and old (28 days) white-eye pn (pn2; cn, bw) and control (cn, bw) flies. Note the minor morphogenesis defect (arrowhead) in a young pn fly and severe degeneration (arrow) in an old pn fly. R: rhabdomere. Scale bars: 1 μm.
- Numbers of rhabdomeres per ommatidium plotted against age show retinal degeneration of pn flies (pn2), which can be rescued by a transgene expressing pn cDNA under control of the hsp70 promoter (pn2, hs-pn). Each data point represents mean ± SD of three groups. Each group contains > 100 ommatidia.
Intramitochondrial cAMP signaling has emerged as an important regulator of energy metabolism in mammals 33. cAMP activates PKA that phosphorylates several components of respiration chain complexes and regulates their activities. The mitochondrial localization of PKA seems to be cell or tissue specific. While PKA has been demonstrated in mitochondrial matrix in various tissues and cells 33, a recent work indicated a lack of PKA activity inside the mitochondria of HeLa cells 11. To examine PKA localization in S2 cells, we used BiFC assay to test whether PKA–nGFP–mCherry could reconstitute with SOD2–cGFP. While PKA distributed evenly in cytoplasm based on the localization of mCherry signal, 12% of mCherry-positive cells had GFP signal that was co-localized with MitoTracker (Supplementary Fig S5A). As a control, there was no reconstitution between i–AAA–nGFP–mCherry and SOD2–cGFP at all. A successful reconstitution depends on the random collision between two half-GFPs inside the matrix. These results suggest that either a small amount of PKA localizes to mitochondria in S2 cells, or PKA might only be imported into mitochondria in a subset of cells under a specific condition.
Mammalian mitochondrial inner membrane is thought to be impermeable to cAMP 11, while a mitochondrial sAC produces cAMP locally. However, the lack of sAC in Drosophila genome questions the origin of matrix cAMP 15. We found that the addition of cAMP increased CFP-to-YFP ratios of MitoICUE3 in cells permeabilized with digitonin (Supplementary Fig S5B). Thus, mitochondrial cAMP could be transported from cytoplasm. On the other hand, Drosophila genome encodes 14 adenylyl cyclases genes that are annotated to produce a total of 38 isoforms (http://flybase.org/). It is possible that an unidentified sAC or some of these isoforms might localize to the matrix and produce cAMP therein. Despite these unanswered questions, our work identifies Pn as a novel mitochondrial PDE, the very first player of mitochondrial cAMP signaling in Drosophila. It demonstrates the prevalence of mitochondrial cAMP signaling in the metazoans, and it also suggests a novel regulation of cAMP signaling on mitochondrial biogenesis. Pn belongs to a conserved family of phosphoesterase 21. However, mammalian Pn homologs lack mitochondrial targeting signal, and human Pn does not localize to the mitochondria 34. Instead, an isoform of mammalian PDE2A, PDE2A2, localizes to the matrix and regulates mitochondrial cAMP level and the activity of respiration chain in cultured cells 35. Thus, Drosophila Pn could be the functional counterpart of PDE2A2, despite their distinct evolution origin. It also suggests that Pn might regulate other aspects of mitochondrial physiology besides stabilizing TFAM and promoting mtDNA replication. We anticipate that future analysis on Pn would reveal a broad impact of intramitochondrial cAMP signaling on mitochondrial and cellular physiology.
Materials and Methods
Full descriptions of Drosophila strains and maintenance, molecular cloning, cell culture, Western blotting, cell imaging, and retina morphology analyses are included in the Supplementary Materials and Methods.
RNAi in S2 cells
dsRNAs used in this study were from Drosophila RNAi Library 1.0 & 2.0 (Thermo Scientific Open Biosystems) or designed by the authors. dsRNAs were prepared according to the standard protocol (http://www.flyrnai.org/DRSC-PRC.html). For 24-well plate RNAi assay, 1 × 10⁶ cells were used for each well and incubated in Schneider's Drosophila medium containing 3 μg dsRNA or transfected with 800 ng dsRNA using Effectene Transfection Reagent (Qiagen) at 25°C for 3–6 days. The efficiency of RNAi was confirmed by quantitative reverse transcription–PCR analysis (qRT–PCR) of mRNA level. The total RNA was isolated using RNeasy Mini Kit (Qiagen). Two microgram of total RNA was used for cDNA synthesis using the SuperScript VILO cDNA Synthesis kit (Life Technologies). qRT–PCRs were performed in triplicate using Roche LightCycler 480 system and SYBR Green I Master. All primers for dsRNA preparation and qRT–PCR analyses are listed in Supplementary Table S1.
Real-time PCR (qPCR) analysis of mtDNA level
To quantify mtDNA level, total DNA was prepared using DNeasy Blood Kit (Qiagen). qPCR was carried out using fluorescent probes and primers against mt:Col and His4 sequence (Supplementary Table S1). TaqMan qPCR assay was performed in a multiplex reaction on a Roche LightCycler 480 system.
EdU incorporation assay
EdU incorporation was performed as described previously 4, using the Click-iT EdU Alexa Fluor 488 Imaging kit (Life Technologies). Briefly, cells were incubated with 10 μM EdU in the Schneider's medium containing 10% FBS for 2 h at 25°C and then fixed with 4% PFA. Samples were washed in PBS with 0.1% Triton X-100 (PBST), blocked with 5% BSA in PBST, and stained with different antibodies.
Pn protein expression, purification, and enzymatic assays
The pn CDS was cloned into the pETDuet-1vector and expressed in the Rosetta™ 2(DE3) Singles™ Competent Cells (Merck Millipore) induced with 1 mM IPTG (Merck Millipore) at 16°C overnight. The Ni-NTA Fast Start kit (Qiagen) was used to purify the N-terminal His-tagged Pn protein. After dialysis (10 mM Tris–HCl, pH 8.0), the protein aliquot was saved for future use. Pyrophosphate activity and cyclic nucleotide phosphodiesterase activity were determined using a Pyrophosphate Assay Kit (Abcam) and a Cyclic Nucleotide Phosphodiesterase Assay kit (Enzo Life Sciences). A total of 20 mM NaF was used as the pyrophosphate inhibitor, and 40 μM IBMX was used as the PDE inhibitor.
Flow cytometry analysis of cAMP level
S2 cells transfected with MitoICUE3 were treated with pn or lacZ dsRNA for 3 days. Cells were harvested, washed once with complete medium, and re-suspended in serum-free medium. Forskolin (50 μM; Sigma-Aldrich) and IBMX (1 mM; Sigma-Aldrich) were added to induce cAMP production; DMSO vehicle was used as control. Cells were permeabilized with 10 μg/ml digitonin before cAMP (100 μM) was added. Flow cytometry analyses were performed on a BD FACSCalibur flow cytometer with excitation/emission wavelengths of 405/450 or 405/515 nm and analyzed with FACSDiva.
Measuring mitochondrial cAMP
Isolated mitochondria were resuspended in the isolation buffer described in the Supplementary Information and adjusted to the same concentration of proteins. Protein concentration was determined by Bradford assay. Measurements were performed using the Direct cAMP ELISA kit (Enzo Life Sciences).
Statistical analysis
F-test was performed to evaluate the equality of variances. Two-tailed Student's t-test was used for statistical analysis. Difference was considered statistically significant when P < 0.05. Results are represented as mean ± SD or SEM.
Acknowledgments
We thank R. Balaban and T. Finkel for their comments on the work; C. Clark for manuscript editing assistance; NHLBI FACS core for the technical assistance; H. Richardson, E. Matsuura, and Developmental Studies Hybridoma Bank for various antibodies; J. Zhang for ICUE3 plasmids; Bloomington stock center for Drosophila stocks; and Best Gene Inc. for embryonic injection service. This work is supported by the NHLBI Intramural Research Program.
Author contributions
FZ and HX designed the study; FZ, YQ, KZ, GZ, and KL performed experiments; FZ and HX analyzed data and wrote the manuscript.
Conflict of interest
The authors declare that they have no conflict of interest.
Supporting Information
Supplementary Figures
Supplementary Information
Source Data for Supplementary Figures S1–S5
Source Data for Supplementary Figures S2B, S3D, S5B
Review Process File
Source Data for Figure 1A and B
Source Data for Figure 2A–C and E
Source Data for Figure 2E
Source Data for Figure 3A and C
Source Data for Figure 3B and D
Source Data for Figure 4A–C
Source Data for Figure 4D
Source Data for Figure 5A
Source Data for Figure 5D
References
- Wallace DC. A mitochondrial paradigm of metabolic and degenerative diseases, aging, and cancer: a dawn for evolutionary medicine. Annu Rev Genet. 2005;39:359–407. doi: 10.1146/annurev.genet.39.110304.095751. [DOI] [PMC free article] [PubMed] [Google Scholar]
- Taylor RW, Turnbull DM. Mitochondrial DNA mutations in human disease. Nat Rev Genet. 2005;6:389–402. doi: 10.1038/nrg1606. [DOI] [PMC free article] [PubMed] [Google Scholar]
- Moraes CT. What regulates mitochondrial DNA copy number in animal cells? Trends Genet. 2001;17:199–205. doi: 10.1016/s0168-9525(01)02238-7. [DOI] [PubMed] [Google Scholar]
- Hill JH, Chen Z, Xu H. Selective propagation of functional mitochondrial DNA during oogenesis restricts the transmission of a deleterious mitochondrial variant. Nat Genet. 2014;46:389–392. doi: 10.1038/ng.2920. [DOI] [PMC free article] [PubMed] [Google Scholar]
- Larsson NG, Oldfors A, Garman JD, Barsh GS, Clayton DA. Down-regulation of mitochondrial transcription factor A during spermatogenesis in humans. Hum Mol Genet. 1997;6:185–191. doi: 10.1093/hmg/6.2.185. [DOI] [PubMed] [Google Scholar]
- Copeland WC. Defects in mitochondrial DNA replication and human disease. Crit Rev Biochem Mol Biol. 2012;47:64–74. doi: 10.3109/10409238.2011.632763. [DOI] [PMC free article] [PubMed] [Google Scholar]
- El-Hattab AW, Scaglia F. Mitochondrial DNA depletion syndromes: review and updates of genetic basis, manifestations, and therapeutic options. Neurotherapeutics. 2013;10:186–198. doi: 10.1007/s13311-013-0177-6. [DOI] [PMC free article] [PubMed] [Google Scholar]
- Meinkoth JL, Alberts AS, Went W, Fantozzi D, Taylor SS, Hagiwara M, Montminy M, Feramisco JR. Signal transduction through the cAMP-dependent protein kinase. Mol Cell Biochem. 1993;127-128:179–186. doi: 10.1007/BF01076769. [DOI] [PubMed] [Google Scholar]
- Walsh DA, Van Patten SM. Multiple pathway signal transduction by the cAMP-dependent protein kinase. FASEB J. 1994;8:1227–1236. doi: 10.1096/fasebj.8.15.8001734. [DOI] [PubMed] [Google Scholar]
- Wong W, Scott JD. AKAP signaling complexes: focal points in space and time. Nat Rev Mol Cell Biol. 2004;5:959–970. doi: 10.1038/nrm1527. [DOI] [PubMed] [Google Scholar]
- Lefkimmiatis K, Leronni D, Hofer AM. The inner and outer compartments of mitochondria are sites of distinct cAMP/PKA signaling dynamics. J Cell Biol. 2013;202:453–462. doi: 10.1083/jcb.201303159. [DOI] [PMC free article] [PubMed] [Google Scholar]
- Carlucci A, Lignitto L, Feliciello A. Control of mitochondria dynamics and oxidative metabolism by cAMP, AKAPs and the proteasome. Trends Cell Biol. 2008;18:604–613. doi: 10.1016/j.tcb.2008.09.006. [DOI] [PubMed] [Google Scholar]
- Acin-Perez R, Salazar E, Kamenetsky M, Buck J, Levin LR, Manfredi G. Cyclic AMP produced inside mitochondria regulates oxidative phosphorylation. Cell Metab. 2009;9:265–276. doi: 10.1016/j.cmet.2009.01.012. [DOI] [PMC free article] [PubMed] [Google Scholar]
- Lu B, Lee J, Nie X, Li M, Morozov YI, Venkatesh S, Bogenhagen DF, Temiakov D, Suzuki CK. Phosphorylation of human TFAM in mitochondria impairs DNA binding and promotes degradation by the AAA+ Lon protease. Mol Cell. 2013;49:121–132. doi: 10.1016/j.molcel.2012.10.023. [DOI] [PMC free article] [PubMed] [Google Scholar]
- Roelofs J, Van Haastert PJM. Deducing the origin of soluble adenylyl cyclase, a gene lost in multiple lineages. Mol Biol Evol. 2002;19:2239–2246. doi: 10.1093/oxfordjournals.molbev.a004047. [DOI] [PubMed] [Google Scholar]
- Chatre L, Ricchetti M. Prevalent coordination of mitochondrial DNA transcription and initiation of replication with the cell cycle. Nucleic Acids Res. 2013;41:3068–3078. doi: 10.1093/nar/gkt015. [DOI] [PMC free article] [PubMed] [Google Scholar]
- Brumby AM, Zraly CB, Horsfield JA, Secombe J, Saint R, Dingwall AK, Richardson H. Drosophila cyclin E interacts with components of the Brahma complex. EMBO J. 2002;21:3377–3389. doi: 10.1093/emboj/cdf334. [DOI] [PMC free article] [PubMed] [Google Scholar]
- Fox DT, Gall JG, Spradling AC. Error-prone polyploid mitosis during normal Drosophila development. Genes Dev. 2010;24:2294–2302. doi: 10.1101/gad.1952710. [DOI] [PMC free article] [PubMed] [Google Scholar]
- Kim H, Kim K, Yim J. Biosynthesis of drosopterins, the red eye pigments of Drosophila melanogaster. IUBMB Life. 2013;65:334–340. doi: 10.1002/iub.1145. [DOI] [PubMed] [Google Scholar]
- Timmons L, Shearn A. Germline transformation using a prune cDNA rescues prune/killer of prune lethality and the prune eye color phenotype in Drosophila. Genetics. 1996;144:1589–1600. doi: 10.1093/genetics/144.4.1589. [DOI] [PMC free article] [PubMed] [Google Scholar]
- Aravind L, Koonin EV. A novel family of predicted phosphoesterases includes Drosophila prune protein and bacterial RecJ exonuclease. Trends Biochem Sci. 1998;23:17–19. doi: 10.1016/s0968-0004(97)01162-6. [DOI] [PubMed] [Google Scholar]
- Aravind L, Koonin EV. Phosphoesterase domains associated with DNA polymerases of diverse origins. Nucleic Acids Res. 1998;26:3746–3752. doi: 10.1093/nar/26.16.3746. [DOI] [PMC free article] [PubMed] [Google Scholar]
- Kerppola TK. Visualization of molecular interactions by fluorescence complementation. Nat Rev Mol Cell Biol. 2006;7:449–456. doi: 10.1038/nrm1929. [DOI] [PMC free article] [PubMed] [Google Scholar]
- González M, Martín-Ruíz I, Jiménez S, Pirone L, Barrio R, Sutherland JD. Generation of stable Drosophila cell lines using multicistronic vectors. Sci Rep. 2011;1:75. doi: 10.1038/srep00075. [DOI] [PMC free article] [PubMed] [Google Scholar]
- DiPilato LM, Cheng X, Zhang J. Fluorescent indicators of cAMP and Epac activation reveal differential dynamics of cAMP signaling within discrete subcellular compartments. Proc Natl Acad Sci USA. 2004;101:16513–16518. doi: 10.1073/pnas.0405973101. [DOI] [PMC free article] [PubMed] [Google Scholar]
- del Puerto A, Díaz-Hernández JI, Tapia M, Gomez-Villafuertes R, Benitez MJ, Zhang J, Miras-Portugal MT, Wandosell F, Díaz-Hernández M, Garrido JJ. Adenylate cyclase 5 coordinates the action of ADP, P2Y1, P2Y13 and ATP-gated P2X7 receptors on axonal elongation. J Cell Sci. 2012;125:176–188. doi: 10.1242/jcs.091736. [DOI] [PubMed] [Google Scholar]
- Lund P, Wiggins D. The matrix water space of mitochondria in situ in isolated hepatocytes. Biosci Rep. 1987;7:59–66. doi: 10.1007/BF01122728. [DOI] [PubMed] [Google Scholar]
- Ekstrand MI, Falkenberg M, Rantanen A, Park C, Gaspari M, Hultenby K, Rustin P, Gustafsson CM, Larsson N. Mitochondrial transcription factor A regulates mtDNA copy number in mammals. Hum Mol Genet. 2004;13:935–944. doi: 10.1093/hmg/ddh109. [DOI] [PubMed] [Google Scholar]
- Seidel-Rogol BL, Shadel GS. Modulation of mitochondrial transcription in response to mtDNA depletion and repletion in HeLa cells. Nucleic Acids Res. 2002;30:1929–1934. doi: 10.1093/nar/30.9.1929. [DOI] [PMC free article] [PubMed] [Google Scholar]
- Matsushima Y, Goto Y, Kaguni LS. Mitochondrial Lon protease regulates mitochondrial DNA copy number and transcription by selective degradation of mitochondrial transcription factor A (TFAM) Proc Natl Acad Sci USA. 2010;107:18410–18415. doi: 10.1073/pnas.1008924107. [DOI] [PMC free article] [PubMed] [Google Scholar]
- Goto A, Matsushima Y, Kadowaki T, Kitagawa Y. Drosophila mitochondrial transcription factor A (d-TFAM) is dispensable for the transcription of mitochondrial DNA in Kc167 cells. Biochem J. 2001;354:243–248. doi: 10.1042/0264-6021:3540243. [DOI] [PMC free article] [PubMed] [Google Scholar]
- Ewart GD, Howells AJ. ABC transporters involved in transport of eye pigment precursors in Drosophila melanogaster. Methods Enzymol. 1998;292:213–224. doi: 10.1016/s0076-6879(98)92017-1. [DOI] [PubMed] [Google Scholar]
- Valsecchi F, Ramos-Espiritu LS, Buck J, Levin LR, Manfredi G. cAMP and mitochondria. Physiology. 2013;28:199–209. doi: 10.1152/physiol.00004.2013. [DOI] [PMC free article] [PubMed] [Google Scholar]
- Reymond A, Volorio S, Merla G, Al-Maghtheh M, Zuffardi O, Bulfone A, Ballabio A, Zollo M. Evidence for interaction between human PRUNE and nm23-H1 NDPKinase. Oncogene. 1999;18:7244–7252. doi: 10.1038/sj.onc.1203140. [DOI] [PubMed] [Google Scholar]
- Acin-Perez R, Russwurm M, Günnewig K, Zoidl G, Bick J, Levin LR, Rassow J, Manfredi G, Steegborn C. A phosphodiesterase 2A isoform localized to mitochondria regulates respiration. J Biol Chem. 2011;286:30423–30432. doi: 10.1074/jbc.M111.266379. [DOI] [PMC free article] [PubMed] [Google Scholar]
Associated Data
This section collects any data citations, data availability statements, or supplementary materials included in this article.
Supplementary Materials
Supplementary Figures
Supplementary Information
Source Data for Supplementary Figures S1–S5
Source Data for Supplementary Figures S2B, S3D, S5B
Review Process File
Source Data for Figure 1A and B
Source Data for Figure 2A–C and E
Source Data for Figure 2E
Source Data for Figure 3A and C
Source Data for Figure 3B and D
Source Data for Figure 4A–C
Source Data for Figure 4D
Source Data for Figure 5A
Source Data for Figure 5D