

Abstract
PTEN is a tumor suppressor associated with an inherited cancer syndrome and an important regulator of ongoing neural connectivity and plasticity. The present study examined molecular and phenotypic characteristics of individuals with germline heterozygous PTEN mutations and ASD (PTEN-ASD), with the aim of identifying pathophysiologic markers that specifically associate with PTEN-ASD and that may serve as targets for future treatment trials. PTEN-ASD patients (n=17) were compared to idiopathic (non-PTEN) ASD patients with (macro-ASD, n=16) and without macrocephaly (normo-ASD, n=38) and healthy controls (n=14). Group differences were evaluated for PTEN pathway protein expression levels, global and regional structural brain volumes and cortical thickness measures, neurocognition, and adaptive behavior. RNA expression patterns and brain characteristics of a murine model of Pten mislocalization were used to further evaluate abnormalities observed in human PTEN-ASD patients. PTEN-ASD had a high proportion of missense mutations and showed reduced PTEN protein levels. Compared to the other groups, prominent white matter and cognitive abnormalities were specifically associated with PTEN-ASD patients, with strong reductions in processing speed and working memory. White matter abnormalities mediated the relationship between PTEN protein reductions and reduced cognitive ability. The Ptenm3m4 murine model had differential expression of genes related to myelination and increased corpus callosum. Processing speed and working memory deficits and white matter abnormalities may serve as useful features that signal clinicians that PTEN is etiologic and prompting referral to genetics professionals for gene testing, genetic counseling and cancer risk management; and could reveal treatment targets in trials of treatments for PTEN-ASD.
Introduction
Autism spectrum disorder (ASD) represents a diverse set of neurodevelopmental conditions with social communication deficits and inflexible/repetitive behaviors. Behavioral genetic studies have confirmed a strong genetic component to ASD.1 However, only 10–20% of cases have a known genetic etiology.2–7 The vast majority of studies of ASD pathophysiology have been conducted on idiopathic ASD. Unfortunately, attempts at identifying molecular and cellular pathophysiology have been hampered by massive phenotypic and genetic heterogeneity. One approach to identifying pathophysiology and mechanism-based treatments for ASD is to focus on cases with a recognized genetic etiology. A growing body of literature has identified a relationship between the tumor suppressor gene PTEN and ASD with macrocephaly. Yet, ASD and macrocephaly associated with germline heterozygous PTEN mutations (PTEN-ASD) has not been well studied in humans.
PTEN is a dual specificity phosphatase and an important regulator of neural connectivity and plasticity.8 Animal models of conditional Pten loss in specific brain cells imply a critical role in the control of behavior, manifesting as abnormal social and repetitive behavior.9–11 They also show larger cell size and dendritic branching, with increased but poorly developed white matter.10 These abnormalities influence synaptic plasticity and disrupt short and long distance brain connectivity, reminiscent of abnormal connectivity in idiopathic ASD.12–14 The Ptenm3m4 mouse is a germline model of disrupted Pten intracellular localization. The mutant protein is absent from the nucleus, disrupting the brain’s normally equal nuclear:cytoplasmic balance of Pten.15, 16 Mutations to the human PTEN gene that have the same effect on protein localization have been reported in patients with PTEN hamartoma tumor syndrome (PHTS).17 We utilize this model for PTEN-ASD due to elevated but abnormally-directed social motivation,16 mimicking the active-but-odd human ASD phenotype,18 as well as molecular phenotypes (e.g. increased Akt-phosphorylation) that align with PHTS patient cell lines.16, 19
Loss of PTEN in humans was first studied in individuals with PHTS.20 In addition to increased cancer risk, a substantial proportion of these patients have neurocognitive deficits.21 Recently, enrichment of germline PTEN mutations has been identified in cohorts of patients with ASD and macrocephaly,22–24 including whole exome and targeted sequencing studies.6, 25 Aggregated rates suggest that PTEN-ASD represents ~10% of macrocephalic ASD,23 which is ~20% of all ASD.26 Reported PTEN-ASD cases tend to have severe symptoms and decreased cognition.23 Small studies of patients with PTEN mutations have observed white matter abnormalities,27, 28 results which align with the role for AKT in the production of myelin.29 However, the above findings may reflect ascertainment bias and identified brain abnormalities are not ubiquitous across patients.
To date, no studies have compared phenotypic and molecular characteristics between PTEN-ASD and other idiopathic ASD cases with (macro-ASD) and without macrocephaly (normo-ASD). Comprehensive characterization of PTEN-ASD is critically needed to identify clinico-pathologic features that signal the need for genetic evaluation and to identify cognitive, neural, and molecular markers relevant to treatment trials. FDA-approved medications (e.g., rapamycin analogues) have shown promise in modifying Pten pathways in the mouse brain,30–32 including altering fear and object recognition memory30, 31 and improving social deficits.33 Thus, the present study aimed to identify molecular and phenotypic abnormalities in patients with PTEN-ASD. The secondary aim was to build a cross-level model of relationships between molecular findings, brain abnormalities, and neurobehavioral deficits in PTEN-ASD. To achieve these aims, we prospectively collected the largest cohort to date of PTEN-ASD patients. We also used our existing Ptenm3m4 cytoplasm-predominant murine model15, 16 to further confirm neuropathophysiological findings in human PTEN-ASD.
Materials and Methods
Sample
Individuals with PTEN-ASD (n=17), macro-ASD (n=16), normo-ASD (n=38), and healthy controls (n=14) were recruited into this study. PTEN-ASD patients were individually-matched on age and sex to available patients from other groups. PTEN-ASD and macro-ASD groups were not matched on head circumference as PTEN cases tended to have very large head circumference. IQ was not matched as it may be an important differentiating characteristic. Analyses of neurobehavioral measures, brain volumes, and cortical thickness were conducted with and without IQ and total brain volume as a covariates, where appropriate. The procedures of the present study were reviewed and approved by the Cleveland Clinic institutional review board. Consent and assent were obtained from parents/guardians and participants.
ASD diagnoses
Consensus ASD diagnoses were made using results of the Autism Diagnostic Interview-Revised (ADI-R),34 clinical observations, and, in young children, by the Autism Diagnostic Observation Schedule.35 Participants in ASD groups met DSM-IV-TR and DSM-5 criteria. Control participants had t-scores <60 on the Social Responsiveness Scale (SRS)36 and were deemed to not have an ASD by expert clinical evaluation.
PTEN mutation scanning
LightCycler or DGGE mutation scanning and semi-automated Sanger sequencing (ABI3730xl) of exons 1 through 9 and flanking intronic regions of genomic DNA was performed for each participant.37, 38 Data were checked for germline intragenic mutations in exons 1–9 and in the splice sites. Analysis of the extended promoter region39 was performed by Sanger sequencing to reveal promoter variants. Promoter variants were subjected to reporter assay as well as functional interrogation. Deletion analysis was conducted using multiplex ligation-dependent probe amplification to reveal large deletions/rearrangements. All novel variants were checked for presence and frequency in 350 sex- and ancestry-matched population controls. The single nucleotide polymorphism database was also consulted. A subset of 44 idiopathic ASD participants was offered clinical screening for large, potentially deleterious, copy number variations beyond those encompassing PTEN. Of these, nearly half (20 of 44) received testing and none had a confirmed deleterious variant, consistent with the low yield of pathogenic CNVs in idiopathic ASD without congenital anomalies. To examine mutational characteristics (missense versus other mutations), the PTEN-ASD patients described above and an additional 14 PTEN-ASD patients (31 total) without comprehensive phenotyping were compared to 264 PHTS patients without ASD from our registry.
Protein assays and scoring
Western blot analysis of peripheral leukocyte or lymphoblastoid cell total protein lysate using antibodies against PTEN, P-AKT, P-p42/44MAPK were performed with the antibodies and techniques routinely used in the Eng lab, by investigators blinded to genotype and group.19 Quantitation of Western blot signals was performed by normalization to the median expression of the samples on each blot.19 The resulting blood PTEN protein levels were classified as PTEN-Q1, PTEN-Q2, PTEN-Q3, and PTEN-Q4, with Q1 and Q4 corresponding to the lowest and highest quartiles of expression (Online S1).19 Active PTEN results in decreased phosphorylation of AKT and MAPK, up-regulation of p27, and down-regulation of cyclin D1 protein levels, resulting in decreased proliferation and increased apoptosis (canonical PTEN signaling). All of these proteins have been shown to be consistent in peripheral protein lysates from 100 population controls.19 Thus, protein studies should reveal the functional effects of PTEN alterations.
Magnetic resonance imaging
MRI acquisition was performed using a Siemens TIM Trio 3 tesla scanner with a standard 12-channel receive-only head coil. An eight-minute whole-brain T1-weighted inversion recovery turboflash (MPRAGE) was acquired with the following parameters: 160 axial slices; 1mm3 isotropic voxels; field-of-view=256 mm × 256 mm2; inversion time/echo time/repetition time/flip angle = 900/1.71/1900; receiver bandwidth 490 Hz/Px. Participants with significant head motion were evaluated using a shorter protocols. Volumetric measurements were obtained using the software suite Freesurfer40 (http://surfer.nmr.mgh.harvard.edu/). The FSL program SIENA was used to correct for head size41 and the resulting anatomical volumes were visually inspected for accuracy. A priori measures included: total brain volume; total cortical grey and white matter; volumes of the bilateral hippocampi, bilateral amygdalae, corpus callosum, cerebellum, brain stem, white matter hypo-intensities, and lateral ventricles; and total and frontal cortical thickness. Group comparisons for total brain volume were computed with and without correcting for head size. Age, sex, full scale IQ, and total brain volume were included as covariates in all regional analyses.
Neurobehavioral assessments
Full scale, verbal, and non-verbal intelligence quotients were obtained using the Mullen Scales of Early Learning42, 43 or the Wechsler Abbreviated Scale of Intelligence.44 Processing speed was measured using mean reaction time from the Conners’ Continuous Performance Test.45 Immediate and working memory were assessed via the Wide Range Assessment of Memory and Learning.46 Autism symptoms and adaptive behavior were measured using the Social Responsiveness Scale36 and the Scales of Independent Behavior.47
Mouse model evaluation
The Ptenm3m4 model changes the intracellular localization of Pten by altering two exon seven localization sequences, causing the protein to be absent from the nucleus and disrupting the brain’s normally equal distribution of cytoplasmic and nuclear Pten.16 The Ptenm3m4 model alters activity of the protein from the earliest developmental timepoints in every cell type, making the Ptenm3m4 mouse a strong model for human PHTS. In contrast, alternative models are based on removing the Pten gene from a specific cell type after a certain developmental stage (e.g. post-mitotic neurons).33, 48, 49 This allows for careful dissection of the role for Pten within that cell type, but does not replicate the biology of the human disease – where neurons, glia, and cells of the vasculature all experience the same mutation. Thus, the Ptenm3m4 model was chosen because, unlike brain-region specific knockout models, it closely mimics both the brain and non-brain aspects of PHTS with ASD. Furthermore, the Ptenm3m4 model shows increased time with novel mice but also a qualitatively unusual pattern of interaction, thereby providing a window into humans with ASD who have elevated social motivation but lack appropriate interaction skills.18
Total RNA was isolated from cortices of Ptenm3m4 and Wt littermate mice using Trizol (Life Technologies, Grand Island, NY), and clean-up/DNase treatment performed using the Ambion Purelink kit (Life Technologies) according to the manufacturer’s protocol (n = 3 mice/genotype). Following Bioanalyzer analysis for RNA quality, sequencing libraries were prepared by the sequencing facility using the Illumina TruSeq Stranded Total RNA with Ribo Zero kit (Illumina, San Diego, CA). Libraries were multiplexed at 3/lane, and 100bp paired-end sequencing was performed using Illumina HiSeq. Reads were aligned to the mouse mm10 reference genome using Tophat/Bowtie and differential expression (DE) calculated using Cufflinks/Cuffdiff2.50, 51 Differences in gene expression were considered significant at false discovery rate < 0.05, using Benjamini-Hochberg multiple testing correction.50 This resulted in 1377 genes that were differentially expressed (p<0.005). Pathway analysis of DE genes and network generation was performed using Ingenuity Pathway Analysis (Ingenuity® Systems, www.ingenuity.com), and gene ontology information was obtained from AmiGO 2 (version 2.2.0, accessed June 26, 2014). Data are available via Gene Expression Omnibus, accession number: GSE59318.
Free-floating fixed tissue sections (30 µm) were washed in PBS with 0.3M glycine to reduce background fluorescence before incubating in 10% Triton X-100 for 30 minutes at room temperature. Sections were then blocked overnight in 10% normal goat serum diluted in PBS containing 0.3% Triton X-100. Overnight incubation at 4°C with primary antibodies (NeuN – 1:500, Millipore, Billerica, MA; MBP – 1:500, Covance, Princeton, NJ) was followed by washes in PBS and incubation with secondary antibodies diluted in PBS for one hour at room temperature (AlexaFluor 488 – 1:1000, Invitrogen, Grand Island, NY). Finally, sections were washed in PBS, mounted on glass slides, and examined using upright fluorescence microscopy. Corpus callosum measurements were made in triplicate 550µm from the center of the posterior forceps. Cortical thickness measurements were taken using the same anatomical landmark. Data presented are averages of measurements made by two investigators blinded to genotype (1–2 sections per animal, 3–4 animals per genotype).
Statistical analyses
Univariate analyses of variance and Chi-square analyses compared patient groups across demographic (age, sex, head circumference z-score) and clinical (ADI-R domain scores and SRS total T-score) measurements. Chi-square analysis evaluated differences in the proportion of missense versus other mutation types in PTEN-ASD and PHTS without ASD patients. PTEN and related pathway protein expression levels were compared across patient groups using generalized estimating equation (GEE) models,52 with patient group as a fixed factor, age and sex as covariates. Matched patient groups served as the clustering variable and an unstructured error covariance matrix had superior fit relative to other error structures. Similar GEE models were used to evaluate brain volume and neurobehavioral differences among patient groups, but total brain volume and IQ were added as covariates. A priori contrasts were calculated between PTEN-ASD and other patient groups.
Cross-level relationships between protein scores, brain volumes/thicknesses, and full scale IQ in PTEN-ASD patients was evaluated using mediational models. Statistical mediation does not imply causation but rather is used to identify cross-level relationships. In each model, structural brain measurements were the mediator between protein scores (upstream variable) and full scale IQ (downstream variable). Statistical analyses were computed using regression modeling in SPSS version 21.53 Mediational models were computed using AMOS v2154 following the analytic criteria described by Baron and Kenny.55
Power to detect group differences was estimated using an analysis of variance model with the expectation that actual power would be enhanced using GEE models.56 Power to detect overall group differences (N=85) was very good (1-β≥.87, α=.05) for large effect sizes (d≥.80). Power to detect a priori contrasts was excellent (1-β≥.95, α=.05, two-tailed). Very large effects were expected for imaging data (Cohen’s d≥1.2) and power was good (1-β≥.84) for detecting this effect magnitude or larger in the imaging sub-sample (n=38).
Results
There were no significant differences in age or sex across patient groups, although there was a trend toward enrichment of older females in the control group (Table 1). Age and sex were included as covariates in all analyses. Not surprisingly, head circumference was largest in PTEN-ASD, slightly smaller in macro-ASD, and closer to the population mean in the normo-ASD and control groups. ASD groups did not differ on any of the ADI-R domain scores or SRS Total T-score.
Table 1.
Sample demographic and clinical characteristics.
| PTEN-ASD | Macro-ASD | Normo-ASD | Healthy Controls | ||
|---|---|---|---|---|---|
| M (SD) | M (SD) | M (SD) | M (SD) | F/Χ2 (p) | |
| N | 17 | 16 | 38 | 14 | |
| Age | 11.5 (7.7) | 12.9 (8.8) | 11.4 (8.2) | 14.0 (9.6) | 0.41 (.746) |
| Male (n, %) | 13 (77%) | 15 (94%) | 31 (82%) | 8 (57%) | 6.31 (.098) |
| Head circumference z-score | 4.2 (1.3)a | 2.9 (1.1)b | 0.7 (0.9)c | 0.9 (1.1)c | 49.15 (<.001) |
| ADI-R | |||||
| Social Interaction | 19.6 (6.3) | 20.3 (7.5) | 18.3 (7.8) | - | 0.50 (.610) |
| Non-Verbal Communication | 8.5 (4.3) | 8.4 (4.5) | 8.0 (4.9) | - | 0.10 (.908) |
| Restricted, Repetitive Behavior | 7.5 (2.9) | 7.5 (2.3) | 6.8 (2.7) | - | 0.60 (.550) |
| SRS Total T-score | 78.9 (13.6)a | 76.1 (13.4)a | 80.7 (10.2)a | 47.0 (10.9)b | 26.92 (<.001) |
Note: Different superscripts denote significant differences (p<.05) on post-hoc tests.
Missense mutations were enriched in PTEN-ASD group relative to PHTS patients without ASD from our large patient registry (51.6% missense in 31 PTEN-ASD patients, 29.6% missense in 264 PHTS patients without ASD; Χ2(1)=6.22, p=.013; online S2). Of the 17 PTEN-ASD patients with comprehensive evaluation (Online S3), 41% had known de novo and 24% inherited mutations (35% unknown inheritance). PTEN-ASD patients had significantly lower PTEN protein expression (Online S4 and S5), but no other significant differences were observed.
PTEN-ASD patients had larger total brain volume than other groups (Table 2), a difference that was proportional to increases in head size. When total brain volume was used as a covariate, total cortical white matter was increased in PTEN-ASD, as was callosal volume and white matter hypo-intensities. White matter hypo-intensity volumes were elevated in all but the oldest PTEN-ASD patient (d=2.91) and there was a large significant relationship between age and white matter hypo-intensity volumes in PTEN-ASD (r=−.70, p=.037), suggesting delayed maturation or abnormal development of white matter (Online S6 and S7). The cerebellum and lateral ventricles were also larger in PTEN-ASD, though these differences were not as dramatic as those of white matter structures. Interestingly, PTEN-ASD had the opposite pattern for cortical thickness, with lower total and frontal cortical thickness before and after adjustment for total brain volume.
Table 2.
Global and regional brain volumes (cm3) and cortical thickness (mm) across study groups.
| PTEN-ASD | Macro-ASD | Normo-ASD | Healthy Controls | 4-Group Comparison |
PTEN-ASD vs. Macro-ASD |
||||||
|---|---|---|---|---|---|---|---|---|---|---|---|
| M | (SD) | M | (SD) | M | (SD) | M | (SD) | Χ2 (p) | Cohen’s d | ||
| Total Brain | 1634.1 | (272.6) | 1409.8 | (158.6) | 1236.7 | (121.3) | 1401.9 | (199.2) | 21.48 | (<.001) | 1.14 |
| Total Cortical Gray Matter | 652.2 | (110.8) | 625.4 | (82.2) | 527.5 | (52.0) | 593.0 | (62.2) | 24.56 | (<.001) | .28 |
| Total Cortical White Matter | 699.5 | (158.6) | 534.3 | (70.8) | 464.8 | (51.0) | 509.5 | (117.2) | 15.80 | (.001) | 1.63 |
| Hippocampus | 9.1 | (1.8) | 9.1 | (0.3) | 8.5 | (1.0) | 9.0 | (1.2) | 5.73 | (.125) | −.02 |
| Amygdala | 3.9 | (1.1) | 3.7 | (0.4) | 3.5 | (0.6) | 3.5 | (0.7) | 1.68 | (.642) | −.21 |
| Corpus Callosum | 4.7 | (1.5) | 3.4 | (0.6) | 3.1 | (1.0) | 3.0 | (0.8) | 12.18 | (.007) | 2.20 |
| Cerebellum | 152.4 | (25.1) | 131.5 | (39.1) | 135.3 | (38.5) | 171.5 | (16.6) | 9.90 | (.019) | 1.14 |
| Brain Stem | 25.5 | (5.0) | 23.8 | (8.3) | 21.3 | (3.6) | 27.3 | (3.4) | 13.38 | (.004) | .27 |
| White Matter Hypo-Intensities | 7.3 | (9.4) | 1.6 | (0.9) | 2.1 | (0.5) | 3.3 | (1.1) | 14.11 | (.003) | 2.91 |
| Lateral Ventricles | 32.6 | (18.5) | 13.0 | (8.8) | 10.1 | (7.4) | 21.7 | (9.7) | 14.13 | (.003) | 1.22 |
| Total Cortical Thickness | 2.7 | (0.1) | 2.8 | (0.1) | 2.7 | (0.1) | 2.7 | (0.1) | 11.10 | (.011) | −2.16 |
| Frontal Cortical Thickness | 2.6 | (0.1) | 2.8 | (0.2) | 2.7 | (0.2) | 2.7 | (0.2) | 6.09 | (.107) | −1.45 |
Note: Regional and structure-specific volumes were adjusted for total brain volume. Bolded effect sizes reflect significant a priori contrasts (p<.05) between PTEN-ASD and Macro-ASD groups. The distribution of white matter hypo-intensities was severely positively skewed and kurtotic. Thus, analyses were based on a log10 transformation which normalized the distribution.
Full scale, verbal, and non-verbal IQ was significantly reduced in PTEN-ASD relative to other ASD groups and healthy controls (smallest Wald Χ2(3)=16.86, p<.001; Table 3). Processing speed, working memory, and immediate verbal and visual memory were also reduced, as was adaptive function. The largest effect sizes were for processing speed (d=1.15) and working memory (d=1.07), with both showing trends toward significant reductions after adjustment for full scale IQ (processing speed Χ2(1)=3.71, p=.054 and working memory Χ2(1)=2.63, p=.105).
Table3.
Cognitive ability and adaptive function across study groups.
| PTEN-ASD | Macro-ASD | Normo-ASD | Healthy Controls | 4-Group Comparison |
PTEN-ASD vs. Macro-ASD |
||
|---|---|---|---|---|---|---|---|
| M (SD) | M (SD) | M (SD) | M (SD) | Wald Χ2 (p) | Cohen’s d | ||
| Full Scale IQ | 75.9 (21.4) | 95.8 (25.7) | 90.9 (21.9) | 108.4 (14.2) | 29.15 | (<.001) | .93 |
| Verbal IQ | 75.3 (24.3) | 93.0 (23.7) | 91.0 (23.1) | 105.9 (14.6) | 16.86 | (.001) | .84 |
| Non-Verbal IQ | 78.1 (17.7) | 95.9 (24.4) | 92.3 (21.3) | 108.7 (15.2) | 30.23 | (<.001) | .90 |
| Processing Speed | 76.9 (23.9) | 99.7 (18.9) | 92.5 (22.2) | 104.1 (10.3) | 17.27 | (.001) | 1.15 |
| Working Memory | 70.6 (15.3) | 90.2 (19.9) | 87.8 (20.0) | 107.8 (10.5) | 52.34 | (<.001) | 1.07 |
| Auditory Immediate Memory | 74.0 (13.9) | 93.7 (24.7) | 86.3 (19.0) | 105.8 (17.3) | 28.69 | (<.001) | .96 |
| Visual Immediate Memory | 77.9 (13.2) | 91.0 (22.5) | 79.5 (17.8) | 95.8 (15.4) | 12.94 | (.005) | .69 |
| SIB-R Broad Independence | 50.4 (23.7) | 66.8 (23.9) | 59.9 (23.5) | 109.1 (29.0) | 61.85 | (<.001) | .85 |
| Motor | 60.1 (29.2) | 79.3 (20.5) | 73.7 (26.8) | 111.7 (27.0) | 32.56 | (<.001) | .87 |
| Social Interaction/Communication | 51.9 (30.9) | 70.8 (31.7) | 67.3 (26.6) | 115.4 (13.2) | 97.57 | (<.001) | .75 |
| Personal Living | 53.4 (20.6) | 60.7 (21.8) | 65.8 (19.6) | 102.6 (19.8) | 49.09 | (<.001) | .49 |
| Community Living | 54.5 (24.2) | 71.7 (21.4) | 62.3 (23.7) | 97.6 (23.1) | 29.53 | (<.001) | .94 |
Note: Bold indicates a significant a priori contrast (p<.05) between PTEN-ASD and Macro-ASD. Wald Χ2 from GEE models evaluates differences between all patient groups using 3 degrees of freedom.
Total cortical white matter, corpus callosum volume, and white matter hypo-intensities fully mediated the relationship between PTEN protein expression level and full scale IQ (Figure 1). P-AKT expression was negatively associated with full scale IQ, but this relationship was independent of PTEN expression (P-AKT only β=−.28 vs. P-AKT with PTEN β=−.31).
Figure 1.
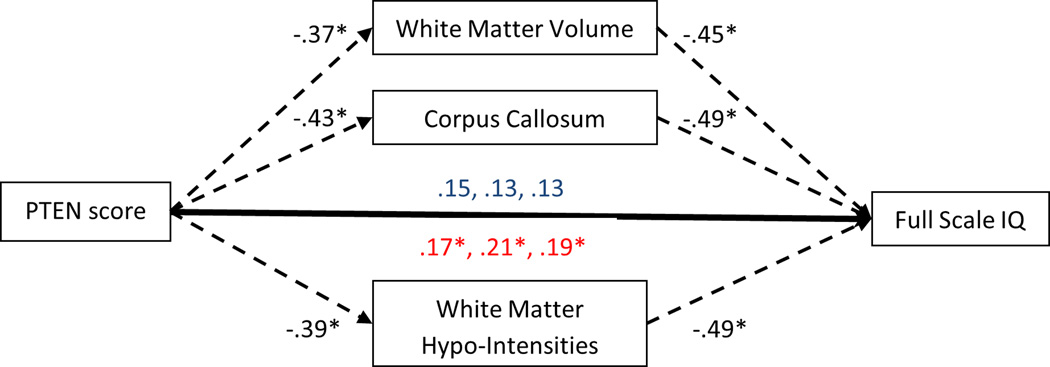
Mediational models displaying the direct relationships between PTEN protein score and full scale IQ and indirect relationships via white matter characteristics. Direct relationships are shown in blue. Indirect relationships are shown in red. *p<.05. PTEN score was not significantly related to total cortical thickness precluding mediation.
In addition to altered sociability and poor balance reminiscent of some individuals with ASD, our previous studies using the Ptenm3m4 model uncovered increased proliferation of NG2 glia, leading to increased numbers of oligodendrocytes.15, 16 Combined with the present human results, we hypothesized that Ptenm3m4 mice would display increases in myelination. Pathway analysis of RNA sequencing data revealed significant differential expression of genes related to myelination (network p-value = 6.11E-15; Figure 2A). The great majority of these genes were upregulated, including major myelin structural proteins MBP and PLP. Comparing the full set of 1377 differentially expressed genes to those contained within the gene ontology term “central nervous system myelination” (accession number GO:0022010), we found highly significant enrichment of myelination-related genes (Fisher’s exact test, odds ratio = 3.66, p-value = 2.76×10⁻⁸). Corpus callosum thickness was increased (n = 5–8 sections/genotype, F(2,16)=19.03, p<.0001; Figure 2B), without change in cortical thickness (F(2,14)=.189, p=.823; Figure 2C). These findings indicate that increased white matter volume contributes to increased brain mass in the Ptenm3m4 model, consistent with findings in PTEN-ASD.
Figure 2.

Mouse model myelination-related gene expression network and white matter evaluation. (A) Ingenuity Pathway Analysis network of myelination-related gene expression is upregulated in Ptenm3m4/m3m4 cortex at six weeks of age. The color of the molecule indicates the expression change from wild-type, with red and green indicating up- and down-regulation, respectively. Color intensity reflects the extent of change. The function of each differentially expressed gene is represented by the shape of the molecule, and listed in the legend below. (B) Representative images of MBP (scale bar = 250 µm) and NeuN (scale bar = 500 µm) immunofluorescence staining in Ptenm3m4/m3m4 and Wt cortex at six weeks of age. (C) Quantification of corpus callosum and cortical thickness measured from staining shown in (B).
Discussion
The present study represents the largest prospective cohort of PTEN-ASD patients with comprehensive molecular and phenotypic characterization. Comparison to macro- and normo-ASD patients and healthy controls indicated reductions in PTEN protein levels, increased brain volume, dramatic white matter abnormalities, and variable but generally impaired cognition and adaptive function. Slow processing speed and large deficits in working memory were observed, consistent with prominent white matter abnormalities, implying that behavioral treatment should focus on slow, repeated presentation of information to maximize learning, even in high functioning PTEN-ASD patients. These particular clinical features may signal the treating clinician that PTEN could be an underlying cause, for referral to genetics professionals for genetic testing in the setting of genetic evaluation and counseling and PTEN-informed cancer risk assessment and management. Importantly, cognitive measures, total brain volume, and white matter abnormalities may be promising treatment targets in pharmacologic studies.
PTEN-ASD patients showed reduced PTEN protein expression but not P-AKT or P42/44MAPK expression. This suggests non-canonical pathway involvement in PTEN-ASD, but may also reflect differences in peripheral blood versus brain expression patterns or early developmental timing of canonical signaling abnormalities. Canonical and non-canonical PTEN pathways, including FOXO, should be investigated longitudinally in future samples. Intriguingly, AKT expression was an independent driver of reduced cognitive ability in the PTEN-ASD group. This may imply additional genetic predisposition factors that modify the PTEN phenotype through the AKT pathway, independent of PTEN expression.
White matter structures statistically mediated the relationship between reduced PTEN expression and impaired cognitive function. In contrast, cortical and sub-cortical grey matter volumes were not abnormal and cortical thickness tended to be smaller with and without adjustment for total brain volume. Analogously, the relationship between PTEN expression and white matter abnormalities was also supported in the Ptenm3m4 model, with upregulation of myelin-associated proteins and increased corpus callosum, but not cortical, thickness. The observation that cortical thickness is not increased in human PTEN-ASD or the Ptenm3m4 model is contrary to observations in murine knockout models and may imply that the ASD phenotype within PTEN mutation cases is largely driven by white matter disruptions. White matter abnormalities have also been seen in PHTS patients without ASD.27 However, it is not yet known whether the magnitude and/or developmental timing of white matter deficits may differentiate individuals with and without ASD. Direct comparisons of PHTS patients with and without ASD are needed for understanding whether abnormal white matter development leads to ASD, intellectual disability, or other neuropsychiatric phenotypes. Brain imaging in multidisciplinary evaluation of ASD is common. Our observations suggest that disproportionately increased white matter with multiple hypointensities may signal the medical team to consider PTEN as the etiology. In addition to the neurobehavioral implications of PTEN involvement, this recognition of specific etiology is important because of the possibility of increased PTEN-associated cancer risks,19 requiring lifelong cancer surveillance.
While the largest described cohort, the present study was limited by modest PTEN-ASD sample size and difficulty in closely matching each PTEN patient to one or more patients from each comparison group. To address this, we used GEE models which readily accommodate different sizes of matched groups and adjust group differences based on all available data within each match. The lack of comprehensively characterized PHTS patients without ASD is also a limitation. However, our own work21 with these patients indicates that their neurocognitive dysfunctions, while present and impairing, tend to be less severe than those seen in PTEN-ASD. Head-to-head comparisons are needed to confirm this pattern. Unfortunately, the neuroimaging approach used in this study was designed for ease of acquisition and not detailed white matter evaluation. Further characterization of white matter using diffusion tensor imaging will allow more accurate measurement and classification, as well as linking to specific molecular processes. Finally, the inclusion of idiopathic macro-ASD cases was a major strength of this study and permitted identification of specific brain and neurocognitive abnormalities. Future work should include both macro-ASD and PHTS without ASD cases to further differentiate PTEN-specific and ASD-specific abnormalities. This work should be longitudinal in order to estimate the development of cognitive function, measure non-canonical functions of PTEN, and consider mutation type as a moderator of outcome. In sum, PTEN-ASD patients show a specific pattern of overgrown and poorly-developed white matter with processing speed and working memory deficits extending beyond general intellectual reductions. White matter abnormalities were supported by our mouse model of cytoplasmic-predominant Pten. Given that white matter abnormalities have not responded to rapamycin treatment in murine models of Pten,33 it will be important to also consider processing speed, working memory, and total or regional brain volumes as efficacy outcomes in future treatment trials of human PTEN-ASD.
Supplementary Material
Acknowledgements
This work was made possible by the Case Western Reserve University/Cleveland Clinic CTSA Grant Number UL1 RR024989 provided by the National Center for Research Resources and the National Center for Advancing Translational Sciences, National Institutes of Health and a grant from the National Cancer Institute R01CA118980. The authors also wish to acknowledge the important contribution of the participants and their families.
Dr. Frazier has received federal funding or research support from, acted as a consultant to, received travel support from, and/or received a speaker’s honorarium from the Simons Foundation, Ingalls Foundation, Forest Laboratories, Ecoeos, IntegraGen, Shire Development, Bristol-Myers Squibb, National Institutes of Health, and the Brain and Behavior Research Foundation. Dr. Eng has received research support from IntegraGen, was a Doris Duke Distinguished Clinical Scientist, holds the Sondra J. and Stephen R. Hardis Chair of Cancer Genomic Medicine at the Cleveland Clinic and is an ACS Clinical Research Professor.
Footnotes
Supplementary information is available at Molecular Psychiatry’s website
Conflict of Interest
No other disclosures were reported.
References
- 1.Ronald A, Hoekstra RA. Autism spectrum disorders and autistic traits: A decade of new twin studies. Am J Med Genet B Neuropsychiatr Genet. 2011;156B(3):255–274. doi: 10.1002/ajmg.b.31159. [DOI] [PubMed] [Google Scholar]
- 2.Abrahams BS, Geschwind DH. Advances in autism genetics: on the threshold of a new neurobiology. Nat Rev Genet. 2008;9(5):341–355. doi: 10.1038/nrg2346. [DOI] [PMC free article] [PubMed] [Google Scholar]
- 3.Sebat J, Lakshmi B, Malhotra D, Troge J, Lese-Martin C, Walsh T, et al. Strong association of de novo copy number mutations with autism. Science. 2007;316:445–449. doi: 10.1126/science.1138659. [DOI] [PMC free article] [PubMed] [Google Scholar]
- 4.Levy D, Ronemus M, Yamrom B, Lee YH, Leotta A, Kendall J, et al. Rare de novo and transmitted copy-number variation in autistic spectrum disorders. Neuron. 2011;70(5):886–897. doi: 10.1016/j.neuron.2011.05.015. [DOI] [PubMed] [Google Scholar]
- 5.Sanders SJ, Ercan-Sencicek AG, Hus V, Luo R, Murtha MT, Moreno-De-Luca D, et al. Multiple Recurrent De Novo CNVs, Including Duplications of the 7q11.23 Williams Syndrome Region, Are Strongly Associated with Autism. Neuron. 2011;70(5):863–885. doi: 10.1016/j.neuron.2011.05.002. [DOI] [PMC free article] [PubMed] [Google Scholar]
- 6.O'Roak BJ, Deriziotis P, Lee C, Vives L, Schwartz JJ, Girirajan S, et al. Exome sequencing in sporadic autism spectrum disorders identifies severe de novo mutations. Nat Genet. 2011;43(6):585–589. doi: 10.1038/ng.835. [DOI] [PMC free article] [PubMed] [Google Scholar]
- 7.O'Roak BJ, Vives L, Fu W, Egertson JD, Stanaway IB, Phelps IG, et al. Multiplex targeted sequencing identifies recurrently mutated genes in autism spectrum disorders. Science. 2012;338(6114):1619–1622. doi: 10.1126/science.1227764. [DOI] [PMC free article] [PubMed] [Google Scholar]
- 8.van Diepen MT, Eickholt BJ. Function of PTEN during the formation and maintenance of neuronal circuits in the brain. Dev Neurosci. 2008;30(1–3):59–64. doi: 10.1159/000109852. [DOI] [PubMed] [Google Scholar]
- 9.Page DT, Kuti OJ, Prestia C, Sur M. Haploinsufficiency for Pten and Serotonin transporter cooperatively influences brain size and social behavior. Proc Natl Acad Sci U S A. 2009;106(6):1989–1994. doi: 10.1073/pnas.0804428106. [DOI] [PMC free article] [PubMed] [Google Scholar]
- 10.Kwon CH, Luikart BW, Powell CM, Zhou J, Matheny SA, Zhang W, et al. Pten regulates neuronal arborization and social interaction in mice. Neuron. 2006;50:377–388. doi: 10.1016/j.neuron.2006.03.023. [DOI] [PMC free article] [PubMed] [Google Scholar]
- 11.Amiri A, Cho W, Zhou J, Birnbaum SG, Sinton CM, McKay RM, et al. Pten deletion in adult hippocampal neural stem/progenitor cells causes cellular abnormalities and alters neurogenesis. J Neurosci. 2012;32(17):5880–5890. doi: 10.1523/JNEUROSCI.5462-11.2012. [DOI] [PMC free article] [PubMed] [Google Scholar]
- 12.Frazier TW, Hardan AY. A meta-analysis of the corpus callosum in autism. Biol Psychiatry. 2009;66(10):935–941. doi: 10.1016/j.biopsych.2009.07.022. [DOI] [PMC free article] [PubMed] [Google Scholar]
- 13.Just MA, Cherkassky VL, Keller TA, Kana RK, Minshew NJ. Functional and anatomical cortical underconnectivity in autism: evidence from an FMRI study of an executive function task and corpus callosum morphometry. Cereb Cortex. 2007;17(4):951–961. doi: 10.1093/cercor/bhl006. [DOI] [PMC free article] [PubMed] [Google Scholar]
- 14.Fishman I, Keown CL, Lincoln AJ, Pineda JA, Muller RA. Atypical Cross Talk Between Mentalizing and Mirror Neuron Networks in Autism Spectrum Disorder. JAMA Psychiatry. doi: 10.1001/jamapsychiatry.2014.83. [DOI] [PMC free article] [PubMed] [Google Scholar]
- 15.Mester JL, Tilot AK, Rybicki LA, Frazier TW, Eng C. Analysis of prevalence and degree of macrocephaly in patients with germline PTEN mutations and of brain weight in Pten knock-in murine model. Eur J Hum Genet. 2011;19(7):763–768. doi: 10.1038/ejhg.2011.20. [DOI] [PMC free article] [PubMed] [Google Scholar]
- 16.Tilot AK, Gaugler MK, Yu Q, Romigh T, Yu W, Miller RH, et al. Germline disruption of Pten localization causes enhanced sex-dependent social motivation and increased glial production. Hum Mol Genet. 2014;23(12):3212–3227. doi: 10.1093/hmg/ddu031. [DOI] [PMC free article] [PubMed] [Google Scholar]
- 17.Trotman LC, Wang X, Alimonti A, Chen Z, Teruya-Feldstein J, Yang H, et al. Ubiquitination Regulates PTEN Nuclear Import and Tumor Suppression. Cell. 2007 doi: 10.1016/j.cell.2006.11.040. [DOI] [PMC free article] [PubMed] [Google Scholar]
- 18.Waterhouse L, Morris R, Allen D, Dunn M, Fein D, Feinstein C, et al. Diagnosis and classification in autism. J Autism Dev Disord. 1996;26(1):59–86. doi: 10.1007/BF02276235. [DOI] [PubMed] [Google Scholar]
- 19.Tan MH, Mester J, Peterson C, Yang Y, Chen JL, Rybicki LA, et al. A clinical scoring system for selection of patients for PTEN mutation testing is proposed on the basis of a prospective study of 3042 probands. American Journal of Human Genetics. 2012;88(1):42–56. doi: 10.1016/j.ajhg.2010.11.013. [DOI] [PMC free article] [PubMed] [Google Scholar]
- 20.Eng C. PTEN: one gene, many syndromes. Hum Mutat. 2003;22(3):183–198. doi: 10.1002/humu.10257. [DOI] [PubMed] [Google Scholar]
- 21.Busch RM, Chapin JS, Mester J, Ferguson L, Haut JS, Frazier TW, et al. Cognitive characteristics of PTEN hamartoma tumor syndromes. Genet Med. 2013;15(7):548–553. doi: 10.1038/gim.2013.1. [DOI] [PMC free article] [PubMed] [Google Scholar]
- 22.Butler MG, Dasouki MJ, Zhou X-P, Talebizadeh Z, Brown M, Takahashi TN, et al. Subset of individuals with autism spectrum disorders and extreme macrocephaly associated with germline PTEN tumour suppressor gene mutations. J Med Genet. 2005;42:318–321. doi: 10.1136/jmg.2004.024646. [DOI] [PMC free article] [PubMed] [Google Scholar]
- 23.Varga EA, Pastore M, Prior T, Herman GE, McBride KL. The prevalence of PTEN mutations in a clinical pediatric cohort with autism spectrum disorders, developmental delay, and macrocephaly. Genet Med. 2009;11(2):111–117. doi: 10.1097/GIM.0b013e31818fd762. [DOI] [PubMed] [Google Scholar]
- 24.Orrico A, Galli L, Buoni S, Orsi A, Vonella G, Sorrentino V. Novel PTEN mutations in neurodevelopmental disorders and macrocephaly. Clin Genet. 2009;75(2):195–198. doi: 10.1111/j.1399-0004.2008.01074.x. [DOI] [PubMed] [Google Scholar]
- 25.Buxbaum JDCG, Chaste P, Nygren G, Goldsmith J, Reichert J, Anckarsäter H, et al. Mutation screening of the PTEN gene in patients with autism spectrum disorders and macrocephaly. American Journal of Medical Genetics Part B (Neuropsychiatric Genetics) 2007;144B:484–491. doi: 10.1002/ajmg.b.30493. [DOI] [PMC free article] [PubMed] [Google Scholar]
- 26.Lainhart JE, Bigler ED, Bocian M, Coon H, Dinh E, Dawson G, et al. Head circumference and height in autism: a study by the Collaborative Program of Excellence in Autism. Am J Med Genet A. 2006;140(21):2257–2274. doi: 10.1002/ajmg.a.31465. [DOI] [PMC free article] [PubMed] [Google Scholar]
- 27.Vanderver A, Tonduti D, Kahn I, Schmidt J, Medne L, Vento J, et al. Characteristic brain magnetic resonance imaging pattern in patients with macrocephaly and PTEN mutations. Am J Med Genet A. 2014;164(3):627–633. doi: 10.1002/ajmg.a.36309. [DOI] [PMC free article] [PubMed] [Google Scholar]
- 28.Lok C, Viseux V, Avril MF, Richard MA, Gondry-Jouet C, Deramond H, et al. Brain magnetic resonance imaging in patients with Cowden syndrome. Medicine (Baltimore) 2005;84(2):129–136. doi: 10.1097/01.md.0000158792.24888.d2. [DOI] [PubMed] [Google Scholar]
- 29.Flores AI, Narayanan SP, Morse EN, Shick HE, Yin X, Kidd G, et al. Constitutively active Akt induces enhanced myelination in the CNS. J Neurosci. 2008;28(28):7174–7183. doi: 10.1523/JNEUROSCI.0150-08.2008. [DOI] [PMC free article] [PubMed] [Google Scholar]
- 30.Jobim PF, Pedroso TR, Christoff RR, Werenicz A, Maurmann N, Reolon GK, et al. Inhibition of mTOR by rapamycin in the amygdala or hippocampus impairs formation and reconsolidation of inhibitory avoidance memory. Neurobiol Learn Mem. 2012;97(1):105–112. doi: 10.1016/j.nlm.2011.10.002. [DOI] [PubMed] [Google Scholar]
- 31.Jobim PF, Pedroso TR, Werenicz A, Christoff RR, Maurmann N, Reolon GK, et al. Impairment of object recognition memory by rapamycin inhibition of mTOR in the amygdala or hippocampus around the time of learning or reactivation. Behav Brain Res. 2012;228(1):151–158. doi: 10.1016/j.bbr.2011.12.004. [DOI] [PubMed] [Google Scholar]
- 32.Mac Callum PE, Hebert M, Adamec RE, Blundell J. Systemic inhibition of mTOR kinase via rapamycin disrupts consolidation and reconsolidation of auditory fear memory. Neurobiol Learn Mem. 2014;112:176–185. doi: 10.1016/j.nlm.2013.08.014. [DOI] [PubMed] [Google Scholar]
- 33.Zhou J, Blundell J, Ogawa S, Kwon CH, Zhang W, Sinton C, et al. Pharmacological inhibition of mTORC1 suppresses anatomical, cellular, and behavioral abnormalities in neural-specific Pten knock-out mice. J Neurosci. 2009;29(6):1773–1783. doi: 10.1523/JNEUROSCI.5685-08.2009. [DOI] [PMC free article] [PubMed] [Google Scholar]
- 34.Rutter M, Le Couteur A, Lord C, et al. Autism Diagnostic Interview-Revised Manual. Los Angeles: Western Psychological Services; 2003. [Google Scholar]
- 35.Gotham K, Risi S, Pickles A, Lord C. The Autism Diagnostic Observation Schedule: revised algorithms for improved diagnostic validity. J Autism Dev Disord. 2007;37(4):613–627. doi: 10.1007/s10803-006-0280-1. [DOI] [PubMed] [Google Scholar]
- 36.Constantino JN, Gruber CP, et al. Social Responsiveness Scale: Manual. Los Angeles, CA: Western Psychological Services; 2005. [Google Scholar]
- 37.Liaw D, Marsh DJ, Li J, Dahia PLM, Wang SI, Zheng Z, et al. Germline mutations of the PTEN gene in Cowden disease, an inherited breast and thyroid cancer syndrome. Nat Genet. 1997;16:64–67. doi: 10.1038/ng0597-64. [DOI] [PubMed] [Google Scholar]
- 38.Mutter GL, Lin MC, Fitzgerald JT, Kum JB, Baak JP, Lees JA, et al. Altered PTEN expression as a diagnostic marker for the earliest endometrial precancers. J Natl Cancer Inst. 2000;92(11):924–930. doi: 10.1093/jnci/92.11.924. [DOI] [PubMed] [Google Scholar]
- 39.Zhou XP, Waite KA, Pilarski R, Hampel H, Fernandez MJ, Bos C, et al. Germline PTEN promotor mutations and deletions in Cowden/Bannayan-Riley-Ruvalcaba syndrome result in aberrant PTEN protein and dysregulation of the phosphoinositol-3-kinase/Akt pathway. Am J Hum Genet. 2003;73:404–411. doi: 10.1086/377109. [DOI] [PMC free article] [PubMed] [Google Scholar]
- 40.Fischl B. FreeSurfer. Neuroimage. 2012;62(2):774–781. doi: 10.1016/j.neuroimage.2012.01.021. [DOI] [PMC free article] [PubMed] [Google Scholar]
- 41.Smith SM, Jenkinson M, Woolrich MW, Beckmann CF, Behrens TE, Johansen-Berg H, et al. Advances in functional and structural MR image analysis and implementation as FSL. Neuroimage. 2004;23(Suppl 1):S208–S219. doi: 10.1016/j.neuroimage.2004.07.051. [DOI] [PubMed] [Google Scholar]
- 42.Bishop SL, Guthrie W, Coffing M, Lord C. Convergent validity of the Mullen Scales of Early Learning and the differential ability scales in children with autism spectrum disorders. Am J Intellect Dev Disabil. 2011;116(5):331–343. doi: 10.1352/1944-7558-116.5.331. [DOI] [PMC free article] [PubMed] [Google Scholar]
- 43.Mullen EM, et al. Mullen Scales of Early Learning. Circle Pines, MN: American Guidance Service Inc; 1995. [Google Scholar]
- 44.Wechsler D, et al. Manual for the Wechsler Abbreviated Scale of Intelligence. San Antonio, TX: The Psychological Corporation; 1999. [Google Scholar]
- 45.Conners CK, et al. Conners' CPT II: Continuous Performance Test II: Technical Guide and Software Manual. North Tonawanda, NY: Multi-Health Systems, Inc.; 2000. [Google Scholar]
- 46.Sheslow D, Adams W, et al. Wide Range Assessment of Memory and Learning Second Edition administration and technical manual. Lutz, FL: Psychological Assessment Resources; 2003. [Google Scholar]
- 47.Bruininks RH, Woodcock RW, Weatherman RF, Hill BK, et al. Scales of Independent Behavior - Revised comprehensive manual. Chicago, IL: Riverside; 1996. [Google Scholar]
- 48.Fraser MM, Zhu X, Kwon C-HH, Uhlmann EJ, Gutmann DH, Baker SJ. Pten loss causes hypertrophy and increased proliferation of astrocytes in vivo. Cancer research. 2004;64(21):7773–7779. doi: 10.1158/0008-5472.CAN-04-2487. [DOI] [PubMed] [Google Scholar]
- 49.Tatiana MK, Sunnen CN, Beth C, Gum Hwa L, Anne EA, Gabriella DA. Development and Characterization of NEX-Pten,a Novel Forebrain Excitatory Neuron-Specific Knockout Mouse. Developmental Neuroscience. 2012;34(2–3):198–209. doi: 10.1159/000337229. [DOI] [PMC free article] [PubMed] [Google Scholar]
- 50.Trapnell C, Hendrickson DG, Sauvageau M, Goff L, Rinn JL, Pachter L. Differential analysis of gene regulation at transcript resolution with RNA-seq. Nature biotechnology. 2013;31(1):46–53. doi: 10.1038/nbt.2450. [DOI] [PMC free article] [PubMed] [Google Scholar]
- 51.Trapnell C, Roberts A, Goff L, Pertea G, Kim D, Kelley DR, et al. Differential gene and transcript expression analysis of RNA-seq experiments with TopHat and Cufflinks. Nat Protoc. 2012;7(3):562–578. doi: 10.1038/nprot.2012.016. [DOI] [PMC free article] [PubMed] [Google Scholar]
- 52.Hanley JA, Negassa A, Edwardes MD, Forrester JE. Statistical analysis of correlated data using generalized estimating equations: An orientation. Am J Epidemiol. 2003;157(4):364–375. doi: 10.1093/aje/kwf215. [DOI] [PubMed] [Google Scholar]
- 53.IBM Corp. IBM Statistics for Windows. 21.0 edn. Armonk, NY: IBM Corp; 2012. [Google Scholar]
- 54.IBM Corp. IBM SPSS Amos. 21.0 edn. Armonk, NY: IBM Corp; 2012. [Google Scholar]
- 55.Baron RM, Kenny DA. The moderator-mediator variable distinction in social psychological research: Conceptual, strategic, and statistical considerations. J Pers Soc Psychol. 1986;51(6):1173–1182. doi: 10.1037//0022-3514.51.6.1173. [DOI] [PubMed] [Google Scholar]
- 56.Borenstein M, Hedges LV, Rothstein H, Cohen J, Schoenfeld D. IBM SPSS SamplePower v3.0.1. Somers, NY: 2011. SPSS. [Google Scholar]
Associated Data
This section collects any data citations, data availability statements, or supplementary materials included in this article.