

Abstract
Aim
The purpose of this study was to evaluate the effectiveness of early versus delayed initiation of metformin in type 2 diabetes.
Methods
We identified 2,925 new users of metformin with type 2 diabetes between 2005 and 2012 in the electronic health records of an integrated health system in Northern California. Patients were matched 1:1 on the propensity for receiving early treatment (defined as ≤6 months from first evidence of diabetes). We evaluated the effectiveness of early versus delayed metformin treatment on intermediate clinical outcomes indicated by changes in hemoglobin A1c (HbA1c) and body mass index (BMI), as well as the incidence of therapy intensification (addition or substitution of a second antihyperglycemic agent).
Results
A total of 2,144 propensity-score matched patients were included in the early or delayed treatment group (n=1,072, in each). Early treatment was associated with significantly larger decreases in HbA1c (-0.36%; 95% confidence intervals [CI]: -0.44 to -0.27%; P<0.001) and BMI (-0.46kg/m2; 95% CI: -0.64 to -0.29kg/m2; P<0.001) relative to delayed treatment. Patients receiving early treatment also had a greater likelihood of attaining an HbA1c <7% (<53mmol/mol) (odds ratio: 2.00; 95% CI: 1.63 to 2.45; P<0.001) and a reduced risk of therapy intensification (hazard ratio: 0.72; 95% CI: 0.61 to 0.85; P<0.001).
Conclusions
Treatment with metformin earlier in the course of type 2 diabetes is associated with better glycemic control, more pronounced weight reduction, and a lower risk for therapy intensification than delayed treatment. Antihyperglycemic therapy should be initiated early after diagnosis to achieve optimal outcomes.
Keywords: metformin, type 2 diabetes, pharmacotherapy
1. INTRODUCTION
The American Diabetes Association (ADA) and the European Association for the Study of Diabetes (EASD) recommend early pharmacotherapy for managing hyperglycemia in type 2 diabetes.[1] The benefit of early glycemic control with pharmacotherapy is supported by evidence from randomized clinical trials, including the landmark United Kingdom Diabetes Prevention Study (UKDPS). In this trial, patients with incident diabetes were randomized to intensive pharmacotherapy or conventional dietary management. During 10-years of follow-up, patients receiving pharmacotherapy had significantly larger decreases in hemoglobin A1c (HbA1c), and a reduced risk of diabetes-related complications.[2, 3] Predictive modeling further supports early treatment, particularly in the prevention of diabetes-related microvascular disease.[4] Treatment to an HbA1c target of <7% (<53mmol/mol) within six months of diabetes diagnosis is expected to reduce the risk of end-stage renal disease by 44% and blindness by 73% compared with no treatment.[4]
Metformin is a preferred first-line oral antihyperglycemic agent,[5] which functions by decreasing hepatic glucose production without increasing the risk of hypoglycemia.[1, 6] Unlike other oral antihyperglycemic agents, metformin is not associated with weight gain and, in fact, it has been shown to induce modest weight loss.[1, 5, 7] Both weight and insulin sensitivity are important determinants of β-cell function.[8-10] Although β-cell deterioration is thought to begin before the onset of diabetes and worsens through the course of disease,[11-14] the process is not necessarily irreversible.[1] Thus, the initiation of metformin early in the course of type 2 diabetes, through improved glycemic control and weight loss, may reduce the burden on β-cell insulin production, preserving insulin secretory capacity and delaying the progression of type 2 diabetes. In the Diabetes Prevention Program, metformin was shown to reduce the incidence of type 2 diabetes by 31% relative to placebo.[15]
The effectiveness of metformin in populations with more recent disease onset (early treatment) and those with longer duration of disease (delayed treatment) is largely unexplored. The purpose of this study was to quantify the effectiveness of early versus delayed initiation of metformin monotherapy on glycemic control (measured by change in HbA1c) and weight modification (change in body mass index [BMI]). In addition, we sought to evaluate the incidence of therapy intensification and metformin dose titrations. We tested the hypothesis that earlier initiation of metformin would be associated with larger decreases in HbA1c and BMI, as well as a lower incidence of therapy augmentation.
2. METHODS
2.1 Study design and setting
This retrospective cohort study was conducted using electronic health record (EHR) data from the Palo Alto Medical Foundation (PAMF), a community-based, multispecialty, ambulatory-care medical network in Northern California. Institutional Review Board approval was obtained for this study. Data were de-identified of protected health information prior to analyses according to Health Insurance Portability and Accountability Act (HIPAA) standards.
2.2 Study population
Incident users of metformin were identified between 2005 and 2012 (Figure 1). Patients were considered to be receiving treatment for type 2 diabetes if they had: 1) prior evidence of type 2 diabetes, defined as at least two encounter, problem list, or medical claims ICD-9 diagnoses (250.x2, 205.x4) (80%) or two abnormal laboratory values (HbA1c ≥6.5% [≥48mmol/mol], fasting glucose ≥126 mg/dL, or random glucose ≥200 mg/dL) (1%); or 2) no prior evidence of type 2 diabetes but at least one abnormal HbA1c or fasting glucose value on the date of or no more than 12 months prior to initiating metformin (19%).
Figure 1. Patient Identification Schematic.
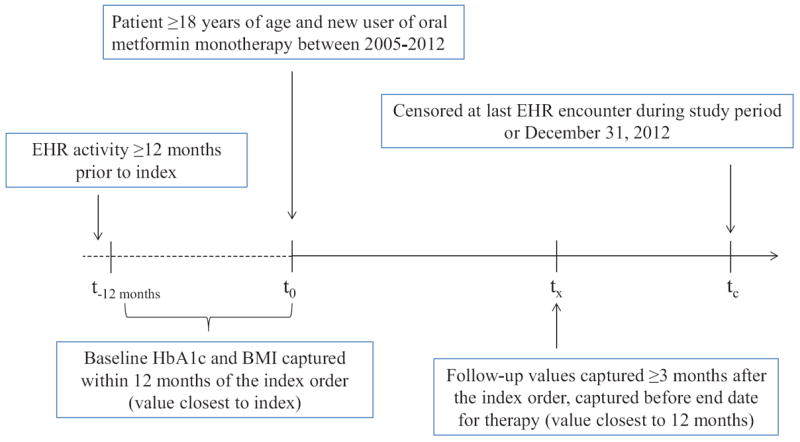
BMI, body-mass index; EHR, electronic health record; HbA1c, hemoglobin A1c.
Patients were included if they were ≥18 years of age at the time of the first medication order during the study period (index date); had ≥12 months of EHR activity prior to the index date; an HbA1c and BMI value recorded within 12 months prior to the index date; and a follow-up HbA1c value recorded at least three months after the index date (Figure 1). We focused on incident treatment with metformin monotherapy, and therefore, excluded patients who had prescriptions for combination antihyperglycemic therapies on the index date; prescriptions for oral or injectable antihyperglycemic therapies (i.e., insulin or incretin mimetics) prior to the index date; or prescriptions for other antihyperglycemic agents ≤14 days after the index date. Most (87%) patients with type 2 diabetes are treated with metformin as a first-line agent in our clinical population, as compared to other oral or injectable drugs (13%).[16] We also excluded patients with a diagnosis of type 1 diabetes (ICD-9: 250.×1, 250. ×3) at any time, or those who were pregnant in the 12 months prior to or during the study period. Patients were censored at last EHR encounter through December 31, 2012.
2. 3 Covariates
Baseline covariates
Patient socio-demographic information, including age during the index year, sex, race/ethnicity, smoking status, and primary insurance type were extracted from the EHR. Prevalent comorbid conditions from encounter, problem list, and medical claims ICD-9 diagnoses were identified as of the index date. Hypertension and hypercholesterolemia were also identified by active prescriptions for antihypertensive or lipid-lowering agents, respectively. Charlson Cormorbidity Index (CCI) scores, a proxy of disease burden, were calculated as previously described.[17, 18] Census data from 2010 were used to infer socioeconomic status (SES). Low SES was defined as ≥20% of population in Census tract living below the poverty level or ≥25% of population ≥25 years of age in the Census tract with less than a high school education.[19] Daily dose of metformin was calculated from prescribed medication strength, quantity dispensed, and day’s supply. For a subset of patients with pharmacy claims (managed-care beneficiaries and those who fill prescriptions in the PAMF clinical pharmacy, regardless of insurance type), medication possession ratio (MPR) was used to assess adherence to metformin. MPR was calculated as the sum of day’s supply of therapy from the date of the first prescription fill to the date of follow-up divided by the days from the start date of the medication order to the date of follow-up plus last day’s supply. For patients who filled prescriptions early, overlapping day’s supply was counted once to prevent MPR from exceeding 1.00.
Exposure variables
Early treatment was defined as an index order for metformin within six months of the first evidence of type 2 diabetes. Delayed treatment was defined as an index order for metformin more than six months after first evidence of type 2 diabetes. Alternative definitions of early versus delayed treatment (three-month intervals from three to 36 months) were also evaluated.
Outcome variables
Primary outcome measures were change in HbA1c from baseline to follow-up and percentage of patients at HbA1c target (<7% [<53mmol/mol]) at follow-up. Follow-up HbA1c was captured at least three months after the index date but before the end date for therapy. For patients with more than one eligible follow-up value, the measurement closest to 12 months from the index date was used. Secondary outcome measures included change in BMI from baseline to follow-up (defined as described for HbA1c), and incidence of therapy intensification (defined as addition or substitution of a second antihyperglycemic medication) and metformin dose titrations through follow-up.
2.4 Propensity-score estimation and matching
Propensity scores were estimated as the probability of receiving early treatment, conditional on baseline covariates. Covariates used in the propensity score included age, sex, race/ethnicity, diabetes-related complications at baseline, metformin dose at baseline, baseline HbA1c and BMI, smoking status, payer type, SES, duration of EHR history, and time to follow-up. Patients were matched 1:1 within 0.2 caliper widths of the pooled standard deviation of the logit of propensity scores.[20, 21]
2.5 Bias assessment
Sensitivity analyses were performed to test the robustness of outcomes to the definition of early treatment. Medication adherence as a potential mediator of differences in HbA1c and BMI outcomes between the early and delayed treatment groups was explored in the subgroup of patients with pharmacy claims data. Residual confounding after propensity-score matching was addressed by additional adjustment for baseline covariates in all statistical models.
2.6 Statistical Methods
Baseline demographics and clinical characteristics for the early and delayed treatment groups in both the unmatched and matched cohorts were compared by absolute standardized mean differences (SMD). A SMD <0.1 was considered a negligible difference. Within the matched cohort, baseline demographics and clinical characteristics were compared by a t test (continuous variables) or a chi-square test (categorical variables). We fit generalized linear models (GLMs) to assess between-group differences in mean changes in HbA1c and BMI from baseline to follow-up. We fit logistic regression models to assess differences in proportion of patients at HbA1c target at follow-up. Cox proportional hazard models were fit to assess differences in the risk for therapy intensification. Poisson regression models were fit to assess differences in the incidence of metformin dose increases. Statistical modeling was performed for the matched cohort with and without adjustment for baseline covariates (age, sex, race/ethnicity, HbA1c and BMI, diabetes-related complications, metformin dose, CCI score, diagnosis of hypertension and hypercholesterolemia, smoking status, insurance payer, and SES). GLMs and logistic regression models also included time to HbA1c or BMI measurement as a covariate, whereas Cox proportional hazard models and Poisson regression models included time to event or censoring as an exposure variable. Point estimates from all models were reported with two-sided 95% confidence intervals (CI). CIs were calculated with robust standard errors to account for within-pair correlation. For all hypothesis testing, a p-value <0.05 was considered statistically significant. Statistical analyses were performed in Stata 13 (StataCorp; College Station, TX).
3. RESULTS
3.1 Description of the Study Population
Among 7,688 incident users of oral antihyperglycemic medications, 2,925 patients met study eligibility criteria (Figure 2). Of these, 1,333 (46%) received an order for metformin within six months of the first evidence of type 2 diabetes (early treatment cohort) and 1,592 (54%) received an order more than six months after first evidence of type 2 diabetes (delayed treatment cohort).
Figure 2. Patient Flow Chart.
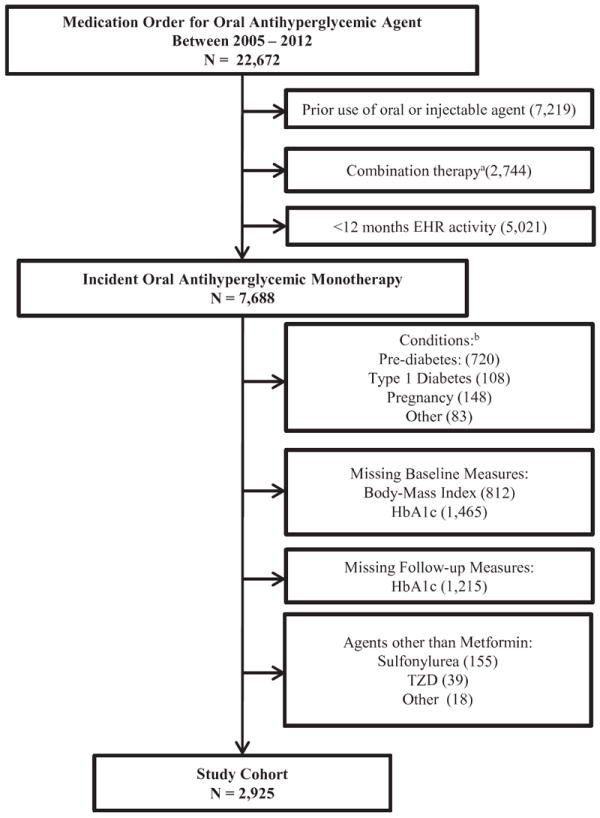
EHR, electronic health record; HbA1c, hemoglobin A1c; TZD, thiazolidinedione.
aCombination therapy defined as fixed-dose agent as initial therapy or addition of another antihyperglycemic agent within 14 days of initiating metformin. bType 1 Diabetes at any time; Pre-diabetes defined as baseline HbA1c ≥5.7 to <6.5% (≥39 to <48mmol/mol) or fasting blood glucose ≥100 mg/dL to <126 mg/dL; Pregnancy 12 months prior to or during the study period; “Other” = use of oral antihyperglycemic agent without evidence of type 2 diabetes.
Baseline demographics and clinical characteristics are shown in Table 1. In the unmatched cohort, the early treatment group was on average younger and had less comorbidity compared to the delayed treatment group. The early treatment group also had a higher mean baseline HbA1c. The proportion of patients with HbA1c at least 9% (75mmol/mol) in the early treatment group was more than twice as high as the proportion in delayed treatment group (25.4% vs. 11.5%, respectively). After 1:1 propensity-score matching, 80% and 67% of patients in the early and delayed treatment groups, respectively, were retained in the matched cohort (1,072 patients in each group). Patient demographics and clinical characteristics were well balanced after matching (SMD <0.1 and p-value >0.05 for all comparisons).
Table 1.
Baseline Demographics and Clinical Characteristics
| Unmatched | Matched | ||||||
|---|---|---|---|---|---|---|---|
| Early Treatment N = 1,333 | Delayed Treatment N = 1,592 | SMD | Early Treatment N = 1,072 | Delayed Treatment N = 1,072 | SMD | P Valuea | |
| Age, years, mean ± SD | 52.2 ± 12.4 | 57.0 ± 12.2 | 0.398 | 53.5 ± 12.2 | 54.4 ± 11.8 | 0.075 | 0.084 |
| Female, n (%) | 556 (41.7) | 692 (43.5) | 0.036 | 458 (42.3) | 467 (43.6) | 0.026 | 0.695 |
| Race/ethnicity, n (%) | 0.887 | ||||||
| Non-Hispanic White | 625 (46.9) | 783 (49.2) | 0.046 | 502 (46.8) | 520 (48.5) | 0.034 | |
| African American | 326 (1.95) | 32 (2.01) | 0.004 | 21 (1.96) | 17 (1.59) | 0.028 | |
| Hispanic | 158 (11.8) | 165 (10.4) | 0.045 | 120 (11.2) | 123 (11.5) | 0.009 | |
| Asian | 466 (35.0) | 566 (35.6) | 0.013 | 387 (36.1) | 373 (34.8) | 0.027 | |
| Other | 58 (4.35) | 46 (2.89) | 0.078 | 42 (3.92) | 39 (3.64) | 0.015 | |
| CCI Score, n (%) | 0.802 | ||||||
| 0 | 813 (61.0) | 833 (55.5) | 0.112 | 640 (59.7) | 629 (58.7) | 0.020 | |
| 1-3 | 491 (36.8) | 638 (40.1) | 0.068 | 406 (37.9) | 413 (38.5) | 0.012 | |
| >3 | 29 (2.18) | 71 (4.46) | 0.128 | 26 (2.43) | 30 (2.80) | 0.023 | |
| Diabetes-related complications, n (%) | 216 (16.2) | 283 (17.8) | 0.043 | 176 (16.4) | 172 (16.0) | 0.011 | 0.815 |
| Hypercholesterolemia, n (%) | 860 (64.5) | 1,291 (81.1) | 0.380 | 766 (71.5) | 794 (74.1) | 0.058 | 0.174 |
| Hypertension, n (%) | 824 (61.8) | 1,151 (72.3) | 0.225 | 703 (65.6) | 743 (69.3) | 0.079 | 0.065 |
| BMI, kg/m2, mean ± SD | 32.2 ± 7.15 | 31.1 ± 6.78 | 0.158 | 31.8 ± 6.84 | 31.8 ± 7.20 | 0.000 | 0.977 |
| HbA1c, %, mean ± SD | 8.09 ± 1.98 | 7.48 ± 1.33 | 0.362 | 7.71 ± 1.61 | 7.62 ± 1.51 | 0.058 | 0.205 |
| HbA1c distribution, n (%) | 0.784 | ||||||
| <6% (<42mmol/mol) | 63 (4.73) | 67 (4.21) | 0.025 | 52 (4.85) | 51 (4.76) | 0.004 | |
| ≥6.07.0% (≥42-53mmol/mol) | 399 (29.9) | 533 (33.5) | 0.077 | 363 (33.9) | 382 (35.6) | 0.036 | |
| ≥7.08.0% (≥53-64mmol/mol) | 357 (26.8) | 640 (40.2) | 0.287 | 331 (30.9) | 332 (31.0) | 0.002 | |
| ≥8.09.0% (≥64-75mmol/mol) | 175 (13.1) | 169 (10.6) | 0.077 | 136 (12.7) | 138 (12.9) | 0.006 | |
| ≥9.0% (≥75mmol/mol) | 339 (25.4) | 183 (11.5) | 0.364 | 190 (17.7) | 169 (15.8) | 0.051 | |
| Index Daily Dose, mg | 0.181 | ||||||
| 500 | 333 (25.0) | 455 (28.6) | 0.081 | 289 (27.0) | 307 (28.6) | 0.036 | |
| 1000 | 819 (61.4) | 921 (57.8) | 0.073 | 649 (60.5) | 603 (56.2) | 0.087 | |
| 1500 | 24 (1.80) | 32 (2.01) | 0.015 | 18 (1.68) | 26 (2.43) | 0.053 | |
| 2000 | 100 (7.50) | 99 (6.22) | 0.051 | 72 (6.72) | 76 (7.09) | 0.015 | |
| Other | 57 (4.28) | 85 (5.34) | 0.050 | 44 (4.10) | 60 (5.60) | 0.070 | |
| Payer, n (%) | 0.965 | ||||||
| FFS/PPO | 666 (50.0) | 695 (43.7) | 0.127 | 518 (48.3) | 511 (47.7) | 0.012 | |
| HMO | 462 (34.7) | 516 (32.4) | 0.049 | 374 (34.9) | 368 (34.3) | 0.013 | |
| Medicare | 186 (14.0) | 356 (22.4) | 0.219 | 168 (15.7) | 181 (16.9) | 0.032 | |
| Medicaid | 7 (0.53) | 14 (0.88) | 0.042 | 6 (0.56) | 6 (0.56) | 0.000 | |
| Other | 12 (0.89) | 11 (0.69) | 0.023 | 6 (0.56) | 6 (0.56) | 0.000 | |
| Smoking status, n (%) | 0.868 | ||||||
| Yes | 94 (7.05) | 98 (6.16) | 0.036 | 74 (6.90) | 71 (6.62) | 0.011 | |
| Quit | 303 (22.7) | 362 (22.7) | 0.000 | 244 (22.8) | 258 (24.1) | 0.031 | |
| Never | 891 (66.8) | 1,081 (67.9) | 0.023 | 721 (67.3) | 707 (66.0) | 0.028 | |
| Unknown | 45 (3.38) | 51 (3.20) | 0.010 | 33 (3.08) | 36 (3.36) | 0.016 | |
| Low SESb, n (%) | 61 (4.86) | 96 (6.36) | 0.065 | 52 (4.85) | 51 (4.76) | 0.004 | 0.920 |
| EHR history, months, mean ± SD | 55.3 ± 31.0 | 59.0 ± 31.4 | 0.119 | 56.12 ± 31.1 | 56.4 ± 30.8 | 0.009 | 0.813 |
BMI, body-mass index; CCI, Charlson Comorbidity Index; CVD, cardiovascular disease; EHR, electronic health record; FFS, fee for service; HbA1c, hemoglobin A1c; HMO, health maintenance organization; PPO, preferred provider organization; SES, socioeconomic status; SMD, standardized mean difference; SD, standard deviation.
P values derived from a t test (continuous variables) or a chi-squared test (categorical variable)
Defined as ≥20% of population in Census tract living below the poverty level or ≥25% of population 25+ years of age in Census tract with less than a high school education.
Among patients in the matched cohort, the median time from first evidence of type 2 diabetes to initiation of metformin was three days (interquartile range [IQR]:0 to 20 days) in the early treatment group and 838 days (IQR: 466 to 1,460 days) in the delayed treatment group. Similar proportions of patients in the early and delayed treatment groups entered the cohort each year between 2005 and 2012 (data not shown). The mean time to HbA1c and BMI follow-up (325 and 329 days, respectively; P=0.965) and mean time to censoring (3.2 and 3.3 years, respectively; P=0.189) were also similar in the early and delayed treatment groups.
3.2 Outcomes
In the matched cohort, HbA1c levels decreased in both the early and delayed treatment groups; however, the magnitude of effect was significantly larger among patients receiving early metformin treatment (adjusted difference: -0.36%; 95% CI:-0.44 to -0.27%; P<0.001) (Table 2). The early treatment group also had a significantly greater likelihood of attaining an HbA1c target of <7% (<53mmol/mol) during follow-up than the delayed treatment group (adjusted odds ratio [OR]: 2.00; 95% CI: 1.63 to 2.45; P<0.001). BMI decreased in both treatment groups; yet, the magnitude of effect was significantly larger with early metformin treatment (adjusted difference: -0.46k/m2; 95%CI: -0.64 to -0.29 k/m2; P<0.001) (Table 3). Each unit decrease in BMI was associated with a -0.01% (95% CI: -0.02 to -0.08; P<0.001) decrease in HbA1c; however, change in BMI did not impact the magnitude of the relationship between early versus delayed treatment and change in HbA1c (adjusted difference: -0.33%; 95% CI: -0.42 to -0.24%; P<0.001).
Table 2.
Primary Outcome Measures in Matched Cohort
| Mean Change in HbA1c, % (95% CI) | Difference in Mean Change (95% CI) for Early vs. Delayed Treatment Groups | ||
|---|---|---|---|
| Unadjusted | Adjusteda | ||
| Early Treatment | -1.11 (-1.21, -1.02) | -0.42 (-0.54, -0.30) P<0.001 | -0.36 (-0.44, -0.27) P<0.001 |
| Delayed Treatment | -0.69 (-0.79, -0.60) | ref | ref |
| Proportion of Patients at HbA1c Target <7.0% (53mmol/mol) (95% CI) | Odds Ratio (95% CI) for Early vs. Delayed Treatment Groups | ||
| Unadjusted | Adjusteda | ||
| Early Treatment | 75.8 (73.2, 78.3) | 1.76 (1.46, 2.13) P<0.001 | 2.00 (1.63, 2.45) P<0.001 |
| Delayed Treatment | 64.0 (61.2, 66.9) | ref | ref |
CI, confidence interval; HbA1c, hemoglobin A1c.
Adjustment for age, sex, race/ethnicity, baseline HbA1c and body mass index, diabetic complications, daily dose, time to follow-up, CCI score, hypercholesterolemia, hypertension, smoking status, payer type, and socioeconomic status
Table 3.
Secondary Outcome Measures in Matched Cohort
| Mean Change in Body Mass Index, kg/m2 (95% CI) | Difference in Mean Change (95% CI) for Early vs. Delayed Treatment Groups | ||||
|---|---|---|---|---|---|
| Unadjusted | Adjusteda | ||||
| Early Treatment | -1.12 (-1.25, -0.99) | -0.45 (-0.64, -0.27) P<0.001 | -0.46 (-0.64, -0.29) P<0.001 | ||
| Delayed Treatment | -0.67 (-0.80, -0.53) | ref | ref | ||
| Treatment Intensificationb | Hazard Ratio (95% CI) for Early vs. Delayed Treatment Groups | ||||
| Events, n | Person Years (PY) | Events per 1,000 PY | Unadjusted | Adjusteda | |
| Early Treatment | 233 | 2,961.3 | 78.7 | 0.74 (0.63, 0.88) P<0.001 | 0.72 (0.61, 0.85) P<0.001 |
| Delayed Treatment | 305 | 2,879.9 | 105.9 | ref | ref |
| Metformin Dose Titrations | Incident Rate Ratio (95% CI) for Early vs. Delayed Treatment Groups | ||||
| Events, n | Person Years (PY) | Events per 1,000 PY | Unadjusted | Adjusteda | |
| Early Treatment | 576 | 2,395.5 | 240.4 | 0.91 (0.81, 1.01) P=0.089 | 0.90 (0.81, 0.99) P=0.041 |
| Delayed Treatment | 623 | 2,437.3 | 255.6 | ref | ref |
CI, confidence interval
Adjustment for age, sex, race/ethnicity, baseline hemoglobin A1c and body mass index, diabetic complications, daily dose, time to follow-up, CCI score, hypercholesterolemia, hypertension, smoking status, payer type, and socioeconomic status
Addition or substitution of a second antihyperglycemic agent
Rates of therapy intensification were 78.7 and 105.9 per 1,000 person years in the early and delayed treatment groups, respectively, representing a 28% risk reduction (adjusted hazard ratio: 0.72; 95% CI: 0.61 to 0.85; P<0.001) (Table 3). Early treatment was associated with a 10% lower incidence of metformin dose titrations (adjusted incident rate ratio: 0.90; 95% CI: 0.81 to 0.99; P=0.041).
3.3 Sensitivity Analyses
We explored multiple definitions of early initiation of metformin, and compared changes in HbA1c between early and delayed treatment groups with different cut-points. In these analyses, we found consistently larger reductions in HbA1c in patients receiving early treatment (Figure 3). Each additional month of delayed treatment with metformin was associated with an increased HbA1c of 0.005% (95% CI: 0.003, 0.006; P<0.001).
Figure 3. Difference in Mean Change in Hemoglobin A1c (HbA1c) for Various Cut-points of Early versus Delayed Metformin Treatment.
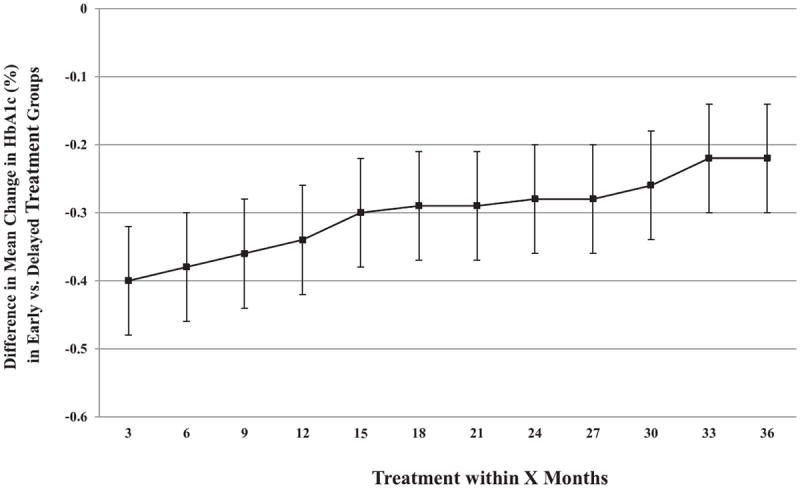
Point estimates derived from generalized linear models in the unmatched cohort with statistical adjustment for baseline covariates (age, sex, race/ethnicity, HbA1c and body-mass index, diabetes-related complications, metformin dose, Charlson Comorbidity Index score, diagnosis of hypertension and hypercholesterolemia, smoking status, insurance payer, and socioeconomic status). Negative values denote benefit for early treatment versus delayed treatment. Error bars represent 95% confidence intervals.
In subgroup analysis of patients with available pharmacy claims (N=885), no significant differences in adherence to metformin therapy, as measured by MPR, were observed in the early and delayed treatment groups (0.59 and 0.58, respectively; P=0.45). Also, adjusting for adherence did not change the relationship between early metformin treatment and changes in HbA1c or BMI (data not shown).
4. DISCUSSION
4.1 Interpretation of Study Findings
This study allowed for the careful evaluation of changes in glycemic control and BMI, and incidence of therapy augmentation in a large, longitudinal cohort of patients with type 2 diabetes newly initiating metformin. Results from this study demonstrate substantial clinical benefit of early treatment in patients with type 2 diabetes. Compared to patients receiving metformin more than six months after first evidence of diabetes, patients receiving treatment within six months had significantly larger reductions in HbA1c and BMI, and were significantly more likely to attain an HbA1c goal of <7% (<53mmol/mol), over an average of approximately 12 months of treatment. Change in BMI had minimal influence on change in HbA1c, suggesting that the effects of metformin on these measures is largely independent. In addition, there was a reduced risk of therapy augmentation (intensification and metformin dose titrations) in the early treatment group over an average of more than three-year of follow-up.
The benefits of early and intensive antihyperglycemic therapy have been well established in randomized clinical trials. In the UKDPS trial, patients with incident diabetes receiving intensive pharmacotherapy showed improved glycemic control and a reduced risk of microvascular disease compared with patients receiving conventional dietary management [2, 3]. Several studies have shown that early and intensive antihyperglycemic therapy, with insulin or oral agents, leads to short-term improvements in β-cell function; however, this improvement diminishes in the ensuing years [22-27]. Long-term preservation of β-cell function through 3.5 years has been demonstrated with insulin plus metformin or triple oral therapy [28].
The ability of β-cells to secrete insulin is critical to managing diabetes, preventing diabetes-related complications, and delaying onset of cardiovascular disease. We hypothesize that preserved β-cell function, may in part, explain the more pronounced HbA1c and BMI reductions with early metformin treatment in our cohort. Indeed, patients receiving early treatment were less likely to have therapy intensified and metformin titrated to higher doses, suggesting that progression of diabetes was delayed. Our findings are corroborated by recent studies from Kaiser Permanente in the Northwestern United States, which showed that patients initiating metformin within three months of diagnosis relative to those receiving delayed treatment (12-23 months from diagnosis) had greater odds of achieving an HbA1c <7% (<53mmol/mol) (OR: 2.85; 95% CI: 2.04 to 3.98). [29] The authors also showed that, in a subset of patients who initially attained an HbA1c <7% with metformin, early treatment was associated with lower odds of subsequent treatment failure, defined as HbA1c ≥7.5% (≥58mmol/mol) or the addition or substitution of another antihyperglycemic agent.[30]
In our analysis, we chose to define early treatment as initiation of pharmacotherapy within six months of first evidence of type 2 diabetes. Although this is somewhat arbitrary, a more conservative definition (e.g., at or within three months of diagnosis) may not have been practical in a real-world setting because many clinicians and patients, in particular, may wish to first attempt lifestyle modification before pharmacotherapy. Through sensitivity analyses, we found that there was a significant advantage over delayed treatment in the reduction of HbA1c regardless of the definition of early treatment; however, the magnitude of this benefit for early treatment decreased the as the time for the definition of early treatment was increased. Each additional month delay in metformin treatment was associated with an increase in HbA1c of 0.005%.
Adherence to metformin therapy is a potential mediator of treatment effects, and differential levels of adherence in the early and delayed treatment groups are likely to influence outcome measures, including changes in HbA1c and BMI. Subgroup analysis of patients with pharmacy claims data showed that adherence, as measured by MPR, did not differ among patients receiving early or delayed treatment. Adherence to metformin was overall low in both groups (mean MPR<0.60), but similar to other studies of medication adherence in populations with diabetes.[31, 32] Adjustment for adherence in statistical models of changes in HbA1c and BMI did not alter observed associations.
Current ADA and EASD guidelines recommend the initiation of antihyperglycemic therapy at or soon after diagnosis of type 2 diabetes.[1] Findings from our study further support the benefit for early pharmacotherapy in a clinical-practice setting. Metformin is a preferred antihyperglycemic agent that is cost-effective and has a low risk for weight gain or hypoglycemia relative to other treatment options.[5-7] Nevertheless, we recognize that the timing and type of therapy is a decision that is shared by the clinician and patient. We note that patients receiving early treatment were on average younger, with a higher baseline HbA1c and less comorbidity relative to patients receiving delayed treatment. Future studies are needed to better understand treatment decisions for type 2 diabetes in clinical practice, and reasons for delays in initiating pharmacotherapy.
The results of our study should be interpreted in the context of several limitations. Due to the observational and retrospective nature of the study design, causal inferences are restricted. Moreover, we used HbA1c as a proxy for clinical endpoints, as the association between HbA1c and these outcomes, particularly microvascular events, is well documented.[2, 3, 33] A larger sample size and/or longer duration of follow-up would likely be needed to detect statistically significant differences in clinical endpoints. There may be limited generalizability of study findings as our sample was from a single geographic area in Northern California. Furthermore, because the vast majority of the study cohort had health insurance, the medically underserved were underrepresented. However, this homogeneity provides better internal validity for group comparison and eliminates the potential confounding effects of differential access to medical care.
4. 2 Conclusions
Treatment with metformin earlier in the course of type 2 diabetes is associated with better glycemic control and more pronounced weight reduction over an average of 12 months of treatment, and a lower risk of therapy augmentation over more than three years of follow-up. Antihyperglycemic therapy should be initiated early after diagnosis to achieve optimal outcomes.
Highlights.
-
■
We evaluated the effectiveness of early versus delayed metformin in patients on changes in hemoglobin A1c (HbA1c) and body-mass index (BMI)
-
■
Early treatment was associated with significantly larger decreases in HbA1c and BMI relative to delayed treatment
-
■
Patients receiving early treatment were more likely to achieve HbA1c goal of less than 7% (53mmol/mol) and had a reduced risk of therapy augmentation
Acknowledgments
FUNDINGS
This study was supported by a grant awarded to L.P. from the National Institute of Diabetes and Digestive and Kidney Diseases (R01DK081371-01A1S1) and by a grant awarded to S.C. from the Agency of Healthcare Research and Quality (K01HS019815).
Footnotes
CONTRIBUTIONS
R.J.R. was involved in the study design, data acquisition, data analysis, and drafted the manuscript. S.C. was involved in the study design and assisted in the revision of the manuscript. J.P was involved in the study design and drafted the manuscript. V.N. was involved in data acquisition and drafted the manuscript. B.Z. was involved in study design and drafted the manuscript. L.P. was involved in study design and revised the manuscript. All authors approved the final draft of the manuscript.
CONFLICTS OF INTEREST
The authors have no conflicts of interest to report.
Publisher's Disclaimer: This is a PDF file of an unedited manuscript that has been accepted for publication. As a service to our customers we are providing this early version of the manuscript. The manuscript will undergo copyediting, typesetting, and review of the resulting proof before it is published in its final citable form. Please note that during the production process errors may be discovered which could affect the content, and all legal disclaimers that apply to the journal pertain.
References
- 1.Inzucchi SE, Bergenstal RM, Buse JB, et al. Management of hyperglycemia in type 2 diabetes: a patient-centered approach: position statement of the American Diabetes Association (ADA) and the European Association for the Study of Diabetes (EASD) Diabetes care. 2012;35:1364–1379. doi: 10.2337/dc12-0413. [DOI] [PMC free article] [PubMed] [Google Scholar]
- 2.Intensive blood-glucose control with sulphonylureas or insulin compared with conventional treatment and risk of complications in patients with type 2 diabetes (UKPDS 33). UK Prospective Diabetes Study (UKPDS) Group. Lancet. 1998;352:837–853. [PubMed] [Google Scholar]
- 3.Effect of intensive blood-glucose control with metformin on complications in overweight patients with type 2 diabetes (UKPDS 34). UK Prospective Diabetes Study (UKPDS) Group. Lancet. 1998;352:854–865. [PubMed] [Google Scholar]
- 4.Bailey CJ, Del Prato S, Eddy D, Zinman B Global Partnership for Effective Diabetes M. Earlier intervention in type 2 diabetes: the case for achieving early and sustained glycaemic control. International journal of clinical practice. 2005;59:1309–1316. doi: 10.1111/j.1742-1241.2005.00675.x. [DOI] [PubMed] [Google Scholar]
- 5.Pratley RE. The early treatment of type 2 diabetes. The American journal of medicine. 2013;126:S2–9. doi: 10.1016/j.amjmed.2013.06.007. [DOI] [PubMed] [Google Scholar]
- 6.Klip A, Leiter LA. Cellular mechanism of action of metformin. Diabetes care. 1990;13:696–704. doi: 10.2337/diacare.13.6.696. [DOI] [PubMed] [Google Scholar]
- 7.Noury J, Nandeuil A. Comparative three-month study of the efficacies of metformin and gliclazide in the treatment of NIDD. Diabete & metabolisme. 1991;17:209–212. [PubMed] [Google Scholar]
- 8.Hannon TS, Kirkman MS, Patel YR, Considine RV, Mather KJ. Profound defects in ss-cell function in screen-detected type 2 diabetes are not improved with glucose-lowering treatment in the early diabetes prevention program (EDIP) Diabetes/metabolism research and reviews. 2014 doi: 10.1002/dmrr.2553. [DOI] [PMC free article] [PubMed] [Google Scholar]
- 9.Garber AJ. Incretin effects on beta-cell function, replication, and mass: the human perspective. Diabetes care. 2011;34(Suppl 2):S258–263. doi: 10.2337/dc11-s230. [DOI] [PMC free article] [PubMed] [Google Scholar]
- 10.Dixon JB, Dixon AF, O’Brien PE. Improvements in insulin sensitivity and beta-cell function (HOMA) with weight loss in the severely obese. Homeostatic model assessment. Diabetic medicine : a journal of the British Diabetic Association. 2003;20:127–134. doi: 10.1046/j.1464-5491.2003.00889.x. [DOI] [PubMed] [Google Scholar]
- 11.Pratley RE, Weyer C. The role of impaired early insulin secretion in the pathogenesis of Type II diabetes mellitus. Diabetologia. 2001;44:929–945. doi: 10.1007/s001250100580. [DOI] [PubMed] [Google Scholar]
- 12.Kahn SE. The relative contributions of insulin resistance and beta-cell dysfunction to the pathophysiology of Type 2 diabetes. Diabetologia. 2003;46:3–19. doi: 10.1007/s00125-002-1009-0. [DOI] [PubMed] [Google Scholar]
- 13.Stumvoll M, Goldstein BJ, van Haeften TW. Type 2 diabetes: principles of pathogenesis and therapy. Lancet. 2005;365:1333–1346. doi: 10.1016/S0140-6736(05)61032-X. [DOI] [PubMed] [Google Scholar]
- 14.Butler AE, Janson J, Bonner-Weir S, Ritzel R, Rizza RA, Butler PC. Beta-cell deficit and increased beta-cell apoptosis in humans with type 2 diabetes. Diabetes. 2003;52:102–110. doi: 10.2337/diabetes.52.1.102. [DOI] [PubMed] [Google Scholar]
- 15.Knowler WC, Barrett-Connor E, Fowler SE, et al. Reduction in the incidence of type 2 diabetes with lifestyle intervention or metformin. The New England journal of medicine. 2002;346:393–403. doi: 10.1056/NEJMoa012512. [DOI] [PMC free article] [PubMed] [Google Scholar]
- 16.Chung S, Zhao B, Lauderdale D, Linde R, Stafford R, Palaniappan L. Initiation of treatment for incident diabetes: Evidence from the electronic health records in an ambulatory care setting. Primary care diabetes. 2014 doi: 10.1016/j.pcd.2014.04.005. [DOI] [PMC free article] [PubMed] [Google Scholar]
- 17.Charlson ME, Pompei P, Ales KL, MacKenzie CR. A new method of classifying prognostic comorbidity in longitudinal studies: development and validation. Journal of chronic diseases. 1987;40:373–383. doi: 10.1016/0021-9681(87)90171-8. [DOI] [PubMed] [Google Scholar]
- 18.Quan H, Sundararajan V, Halfon P, et al. Coding algorithms for defining comorbidities in ICD-9-CM and ICD-10 administrative data. Medical care. 2005;43:1130–1139. doi: 10.1097/01.mlr.0000182534.19832.83. [DOI] [PubMed] [Google Scholar]
- 19.Raebel MA, Ellis JL, Schroeder EB, et al. Intensification of antihyperglycemic therapy among patients with incident diabetes: a Surveillance Prevention and Management of Diabetes Mellitus (SUPREME-DM) study. Pharmacoepidemiology and drug safety. 2014 doi: 10.1002/pds.3610. [DOI] [PubMed] [Google Scholar]
- 20.Austin PC. Optimal caliper widths for propensity-score matching when estimating differences in means and differences in proportions in observational studies. Pharmaceutical statistics. 2011;10:150–161. doi: 10.1002/pst.433. [DOI] [PMC free article] [PubMed] [Google Scholar]
- 21.Romanelli RJ, Jukes T, Segal JB. Compliance after switching from branded to generic statins. Pharmacoepidemiology and drug safety. 2014 doi: 10.1002/pds.3630. [DOI] [PubMed] [Google Scholar]
- 22.Garvey WT, Olefsky JM, Griffin J, Hamman RF, Kolterman OG. The effect of insulin treatment on insulin secretion and insulin action in type II diabetes mellitus. Diabetes. 1985;34:222–234. doi: 10.2337/diab.34.3.222. [DOI] [PubMed] [Google Scholar]
- 23.Ilkova H, Glaser B, Tunckale A, Bagriacik N, Cerasi E. Induction of long-term glycemic control in newly diagnosed type 2 diabetic patients by transient intensive insulin treatment. Diabetes care. 1997;20:1353–1356. doi: 10.2337/diacare.20.9.1353. [DOI] [PubMed] [Google Scholar]
- 24.Ryan EA, Imes S, Wallace C. Short-term intensive insulin therapy in newly diagnosed type 2 diabetes. Diabetes care. 2004;27:1028–1032. doi: 10.2337/diacare.27.5.1028. [DOI] [PubMed] [Google Scholar]
- 25.Weng J, Li Y, Xu W, et al. Effect of intensive insulin therapy on beta-cell function and glycaemic control in patients with newly diagnosed type 2 diabetes: a multicentre randomised parallel-group trial. Lancet. 2008;371:1753–1760. doi: 10.1016/S0140-6736(08)60762-X. [DOI] [PubMed] [Google Scholar]
- 26.Chen HS, Wu TE, Jap TS, Hsiao LC, Lee SH, Lin HD. Beneficial effects of insulin on glycemic control and beta-cell function in newly diagnosed type 2 diabetes with severe hyperglycemia after short-term intensive insulin therapy. Diabetes care. 2008;31:1927–1932. doi: 10.2337/dc08-0075. [DOI] [PMC free article] [PubMed] [Google Scholar]
- 27.Kahn SE, Haffner SM, Heise MA, et al. Glycemic durability of rosiglitazone, metformin, or glyburide monotherapy. The New England journal of medicine. 2006;355:2427–2443. doi: 10.1056/NEJMoa066224. [DOI] [PubMed] [Google Scholar]
- 28.Harrison LB, Adams-Huet B, Raskin P, Lingvay I. beta-cell function preservation after 3.5 years of intensive diabetes therapy. Diabetes care. 2012;35:1406–1412. doi: 10.2337/dc11-2170. [DOI] [PMC free article] [PubMed] [Google Scholar]
- 29.Nichols GA, Conner C, Brown JB. Initial nonadherence, primary failure and therapeutic success of metformin monotherapy in clinical practice. Current medical research and opinion. 2010;26:2127–2135. doi: 10.1185/03007995.2010.504396. [DOI] [PubMed] [Google Scholar]
- 30.Brown JB, Conner C, Nichols GA. Secondary failure of metformin monotherapy in clinical practice. Diabetes care. 2010;33:501–506. doi: 10.2337/dc09-1749. [DOI] [PMC free article] [PubMed] [Google Scholar]
- 31.Schmittdiel JA, Uratsu CS, Karter AJ, et al. Why don’t diabetes patients achieve recommended risk factor targets? Poor adherence versus lack of treatment intensification. Journal of general internal medicine. 2008;23:588–594. doi: 10.1007/s11606-008-0554-8. [DOI] [PMC free article] [PubMed] [Google Scholar]
- 32.Melikian C, White TJ, Vanderplas A, Dezii CM, Chang E. Adherence to oral antidiabetic therapy in a managed care organization: a comparison of monotherapy, combination therapy, and fixed-dose combination therapy. Clinical therapeutics. 2002;24:460–467. doi: 10.1016/s0149-2918(02)85047-0. [DOI] [PubMed] [Google Scholar]
- 33.The effect of intensive treatment of diabetes on the development and progression of long-term complications in insulin-dependent diabetes mellitus. The Diabetes Control and Complications Trial Research Group. The New England journal of medicine. 1993;329:977–986. doi: 10.1056/NEJM199309303291401. [DOI] [PubMed] [Google Scholar]