

Abstract
Selective attention uses temporal regularity of relevant inputs to bias the phase of ongoing population-level neuronal oscillations. This phase entrainment streamlines processing, allowing attended information to arrive at moments of high neural excitability. How entrainment resolves competition between spatially segregated inputs during visuospatial tasks is not yet established. Using high-density electroencephalography in humans, a bilateral entrainment response to the rhythm (1.3 or 1.5 Hz) of an attended stimulation stream was observed, concurrent with a considerably weaker contralateral entrainment to a competing rhythm. That ipsilateral visual areas strongly entrained to the attended stimulus is notable because competitive inputs to these regions were being driven at an entirely different rhythm. Strong modulations of phase locking and weak modulations of single-trial power suggest that entrainment was primarily driven by phase-alignment of ongoing oscillatory activity. In addition, interhemispheric differences in entrained phase were found to be modulated by attended hemifield, implying that the bilateral nature of the response reflected a functional flow of information between hemispheres. This modulation was strongest at the third of at least four harmonics that were strongly entrained. Ipsilateral increases in alpha-band (8–12 Hz) power were also observed during bilateral entrainment, reflecting suppression of the ignored stimulation stream. Furthermore, both entrainment and alpha lateralization significantly affected task performance. We conclude that oscillatory entrainment is a functionally relevant mechanism that synchronizes endogenous activity across the cortical hierarchy to resolve spatial competition. We further speculate that concurrent suppression of ignored input might facilitate the widespread propagation of attended information during spatial attention.
Keywords: attention, biased competition, delta band, entrainment, harmonics, oscillations
Introduction
Fluctuations in membrane potential often occur synchronously across neural ensembles at multiple spatial scales, from coordinated variations in the subthreshold potential of cells in close proximity (Lampl et al., 1999) to correlated firing across cortical columns (Gray et al., 1989; Engel et al., 1990) and synchronized activity between spatially disparate cortical areas (Hipp et al., 2011). It was proposed that these oscillatory fluctuations are important for activation of larger cell assemblies (Stern et al., 1998), which in turn serve a range of diverse cognitive functions from input selection to learning (Buzsáki and Draguhn, 2004).
Several recent studies provide evidence that, during intersensory tasks, selectively attending a rhythmic stimulus in one sensory modality results in entrainment of the corresponding sensory cortices (Lakatos et al., 2008; Besle et al., 2011; Gomez-Ramirez et al., 2011). It has also been shown that entrainment is correlated with increases in stimulus-evoked response amplitudes (Lakatos et al., 2008; Cravo et al., 2013; Lakatos et al., 2013b), indicating that entrainment can act as a signal amplification mechanism for attentionally relevant information. Furthermore, because entrainment is observed in regions of cortex beyond primary sensory areas (Besle et al., 2011; Mercier et al., 2013), it is unlikely that it simply represents a stimulus-evoked process; rather, it is in part endogenously generated, serving to transmit rhythmic sensory input along the sensory hierarchy for higher-order analysis. Each of these studies used stimulus rhythms in the delta range (1–4 Hz), strikingly similar in frequency to the intrinsic oscillations of subthreshold membrane potentials observed in striatal (Stern et al., 1998) and neocortical (Hutcheon et al., 1996) neurons. This is consistent with the hypothesis that selective attention modulates such membrane fluctuations by coordinating the firing probabilities of large numbers of neurons within sensory cortices (Schroeder and Lakatos, 2009). However, whether entrainment also operates as a mechanism to resolve competing sources of information during spatial attention remains unknown.
With this in mind, we sought to explore the role of low-frequency entrainment during a taxing spatial attention task. Using high-density electroencephalography (EEG) and leveraging long recording epochs to obtain adequate frequency resolution, we used a task requiring participants to covertly sustain their spatial attention on one of two simultaneously presented input streams, each rhythmically alternating at distinct frequencies (1.3 and 1.5 Hz).
In stark contrast to the majority of existing findings on spatial attention, we found that sustained covert attention to a low-frequency stimulus in one hemifield resulted in global entrainment across both hemispheres of visual cortex to the attended frequency. Conversely, the unattended stimulus produced substantially less entrainment, which was restricted to a highly delimited area over the contralateral hemisphere. Furthermore, there was a robust relationship between the strength of entrainment and the detection of the target stimulus, demonstrating that entrainment to the temporal structure of the environment is an extremely powerful and functionally relevant mechanism deployed during selective visuospatial attention.
Materials and Methods
Participants.
Twenty-four healthy young adults (mean age: 26.7, SD: 4.2; 8 females, 2 left-handed) participated in this study and received compensation of $12/h for their time. All had normal or corrected-to-normal vision and no history of neurological illness. Data from 8 of the 24 were excluded from further analysis: 1 due to poor behavioral performance across blocks (27% accuracy), 5 due to excessive EEG artifacts resulting in insufficient trial numbers to obtain a clean signal, and 2 due to excessive eye movements away from central fixation. Sixteen participants remained after these exclusions (mean age: 26, SD: 3.1; 3 females, 1 left-handed). The study was approved by the Institutional Review Board of The Albert Einstein College of Medicine and ethical guidelines were in accordance with the tenets of the Declaration of Helsinki.
Task and stimuli.
To examine entrainment to multiple low-frequency rhythms during visuospatial attention with sufficient frequency resolution, a task requiring relatively long periods of sustained attention was devised. We adapted a sustained attention task called the continuous temporal expectancy task (CTET) from an earlier study (O'Connell et al., 2009) in which participants were required to continuously monitor a centrally presented, rhythmically alternating checkerboard pattern and respond to a rarely occurring target with a longer duration than the standards. In the current study, we instead simultaneously presented 2 checkerboard streams bilaterally, which rotated either every 766.66 ms (1.3 Hz) or 666.66 ms (1.5 Hz). See Figure 1 for a schematic.
Figure 1.

To-scale schematic of the spatial CTET task. At the beginning of each 3.25 min block, participants were instructed (via an instruction screen) to covertly attend to one of the simultaneously presented rhythmic checkerboard streams. A response was required when there was a brief pause in the rhythm of the attended checkerboard. Stimulus dimensions and eccentricity are shown in degrees of visual angle. The stimuli and monitor colors are approximately the same as what was used in the experiment. Average fixation positions are plotted for the attended conditions in each stimulus configuration.
During 24 ∼3.25 min blocks, participants were instructed to covertly attend to either the left or right checkerboard and press a response button when there was a brief pause in the rhythm of the attended checkerboard. Participants always pressed the button with their right index finger. Before the experimental blocks, an ∼3.25 min practice block was given and it was verbally ascertained whether each participant understood and could successfully complete the task. After the practice block, the task difficulty was titrated until performance was stable for each subject during an additional block in which 3 hits in a row shortened the target duration by 33 ms and a single miss increased the target duration by 33 ms (3-up, 1-down rule). A hit was considered a response that occurred within 1500 ms of a stimulus becoming a target (i.e., when the checkerboard remained in a given orientation for longer than the standard duration). This resulted in an average target duration of 560 ms longer than the standards and an average detection rate of 76.8%. The target duration was the same for both checkerboard streams.
The attended direction alternated every block and the rhythms of the checkerboards were counterbalanced by switching them every four blocks. A total of 190 targets were presented on each attended side. There were 8–12 s between each attended target, which prevented participants from being able to predict the target stimuli. The delays between targets were drawn randomly from a uniform distribution and were the same for each participant. Targets also occurred in the unattended checkerboard stream to equate the degree of rhythmicity of the attended and unattended checkerboard streams. It is important to note, however, that participants were not informed of or instructed to respond to the presence of unattended targets. Furthermore, no participant ever reported having seen unattended targets given how attentionally demanding the task was. Participants were usually given short breaks after four blocks or when requested.
To attenuate the transient, stimulus-evoked responses to the rotating checkerboard, and thus to optimize our resolution of endogenous phase-related changes in the EEG data, we minimized the contrast between the monitor background (gray) and the checkerboard stimuli (light and dark gray). As an additional measure, the checkerboard stimuli were rotated randomly to the left or right by 90° or 180° instead of purely alternating by 180° to reduce the average contrast change within the checkerboard after each rotation. There were four possible orientations of the rotating checkerboard and they were chosen randomly with equal probability from a uniform distribution.
The checkerboards were 5.9° × 5.9° in size and divided into 10 × 10 equally sized squares, which were further divided in half diagonally. Half of each square was light gray with a luminance of 43.3 cd/m2 and the other half was dark gray with a luminance of 8.3 cd/m2. The background had a luminance of 25.2 cd/m2. The checkerboards were centered 5.25° below and 6.5° to either side (8.4° diagonally) of a small black fixation square (0.23° in diameter) located at the center of the screen.
Participants sat with their head resting on a chinrest in a dark, sound-attenuated, and electrically shielded room (International Acoustics). Stimuli were displayed on a 26-inch LCD monitor (ViewSonic model VP2655wb) positioned 80 cm away from the participant, which was set to a refresh rate of 60 Hz and a resolution of 1680 × 1050 pixels. Stimuli were delivered using the Presentation (Neurobehavioral Systems) software package.
Data acquisition.
EEG was recorded with a 168-channel BioSemi Active-Two electrode system at a sampling rate of 512 Hz and with an online low-pass filter set at 100 Hz. The data were initially recorded relative to an active, two-electrode (CMS/DRL) reference located just anterior to, and on either side of a midline central parietal scalp site (Pz). This reference setup creates a feedback loop that minimizes drift in the raw signal during recording. The 160-channel cap does not follow the 10–20 nomenclature system and instead consists of five equally sized 32-channel groups (A1-A32, B1-B32, etc.) that radiate outward from the Cz electrode. In all figures and statistical analyses involving sensor groups, symmetric left and right parietal-occipital sensor groups were used. Each sensor group consisted of 9 sensors (a 3 × 3 grid) covering visual areas classically examined in visuospatial attention studies (Di Russo et al., 2003). A10 (left) and B7 (right) were the central electrodes of the groups and are slightly (less than a radial column) more medial than the PO7 and PO8 sensors of the 10–20 system. We averaged across groups of electrodes to reduce noise (topographical and otherwise) within and between subjects. A very similar grouping was used recently in another study examining the laterality of high-frequency entrainment during spatial attention (Kim et al., 2011).
Eye position data were collected using an EyeLink 1000 infrared eye-tracking system to identify trials in which participants excessively deviated from fixation. The data were sampled at 500 Hz using the “head-free” setting, which minimizes the effects of shifts in head position on the recorded eye position. Calibration was performed at least every four blocks using a nine-point grid. Eye data were synchronized to the EEG by simultaneously sending triggers from the stimulus presentation computer to the EyeLink and EEG acquisition computers when each attended target was presented.
Data processing.
EEG processing was conducted in MATLAB (The MathWorks) using custom-written scripts as well as functions from the FieldTrip toolbox (Oostenveld et al., 2011). Bad channels were identified using statistics of neighboring channels and interpolated using linear, distance-weighted interpolation. After this step, the data were re-referenced to the average potential across all electrodes (averaged reference). A high-pass filter at 0.75 Hz was applied to the continuous data using a sixth-order Butterworth filter with zero phase shift. This resulted in negligible attenuation at the lowest frequencies of interest (<0.14% at 1.3 Hz and <0.03% at 1.5 Hz). For most analyses, the EEG data were first divided into 8.5 s segments, taking 8 s before and 0.5 s after each attended and unattended target stimulus onset. Note that this 0.5 s poststimulus time is still before the stimulus has remained on the screen long enough to become a target. Therefore, no target-processing artifacts or target-evoked activity have been introduced into the data with this epoching. The 8.5 s epochs were linearly detrended and trials with muscle artifacts were removed. To identify trials with muscle artifacts, the data were band-pass filtered from 60 to 90 Hz using a fifth-order Butterworth filter and then z-transformed. Trials exceeding a z-value of 20 were removed. The data were then low-pass filtered at 40 Hz using a sixth-order Butterworth filter with zero phase shift and trials with amplitude fluctuations exceeding 150 μV were also removed.
Because large eye movements away from fixation could affect the topographical distribution of the entrainment response, we rejected trials in which a participant's gaze deviated by >2.5° horizontally or vertically from fixation for >400 ms in a single movement, allowing some very brief, involuntary glances to remain in the data. It was also ensured that none of these remaining trials contained >1000 ms worth of large deviations (<12% of a trial). Smaller eye movements (i.e., microsaccades) were inevitable because they are known to occur involuntarily and far more frequently than the 8.5 s trial length used. However, we reasoned that these are less likely to be systematically biased toward the attended stimulus and are also too small to have a noticeable influence on any topographical differences between conditions. Mean fixation positions for each condition are overlaid on Figure 1 and demonstrate that there were no systematic biases in the cleaned data and a <0.5° spread in mean fixation position between conditions.
Blinks were also inevitable given the long trial lengths, so trials containing blink artifacts could not be rejected outright. Instead, the independent component analysis function in FieldTrip was used to remove blink artifacts from the signal. For each subject and condition, the data epochs were concatenated into one continuous time series that was then decomposed into 160 independent components and then sorted by the amount of variance they explained in the data. The components were visualized topographically and in the time domain so it could be determined which were reliably associated with blinks or heartbeat artifact. Those components were then removed from the data. A blink component was identified and removed for all 16 subjects. For five subjects, an additional heartbeat component was also identified and removed.
Task performance analyses.
Task performance was analyzed using trials that remained after all artifact rejections were complete. Target detection percentages, reaction times, and perceptual sensitivity (d′) were each analyzed with separate two-way ANOVAs with factors of Stimulus Frequency × Attended Hemifield. Reaction times were assessed from the time at which a stimulus had been on the screen longer than the standard duration (i.e., when it became a target).
Phase and phase-locking analyses.
In an initial characterization of the data, the 8.5 s recording epochs were averaged across trials (in the time domain) to examine synchronous activity leading up to the target stimulus. The averaged data were then band-pass filtered at 1.3 and 1.5 Hz (second-order Butterworth, 13 dB attenuation at 0.2 Hz from the frequency of interest) to determine how much stimulus-locked rhythmicity was induced by attention (Fig. 2).
Figure 2.
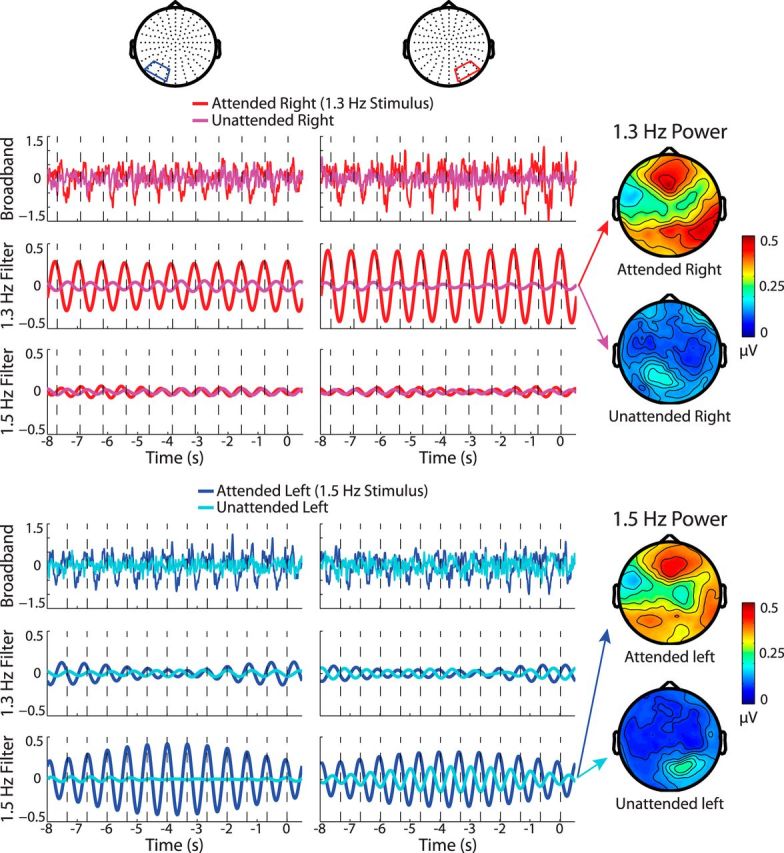
Time course of entrainment. Shown are the broadband and filtered waveforms during entrainment at left and right occipital sensor groups averaged across trials and then across participants. Rhythmicity is readily visible in the attended broadband signals at both sensor groups and the filtered waveforms confirm that this is specific to the frequency being attended. Average power topographies are also shown for the attended and unattended signals at the entrained frequencies. Only one stimulus configuration is shown.
To further assess the strength of entrainment induced by attention, the trial-by-trial data (without averaging in the time-domain) were transformed into the frequency domain via fast Fourier transformation (FFT). The recording epochs were first multiplied by a cosine-tapered (Tukey) window with an alpha of 0.25 and then padded to 10 s, affording a frequency resolution of 0.1 Hz. After the FFT, intertrial phase coherence (ITPC), which describes how consistently activity at a given frequency is phase locked across trials, was calculated for frequency f and sensor s across trials k according to the following:
 |
Where N is the total number of trials for a given subject. From the ITPC (which is still a complex number), phase-locking values (PLVs) and preferred phases ϕ at frequency f and sensor s were then derived as follows:
 |
 |
Where |x| and arg(x) represent the modulus and argument of x, respectively, in the standard complex analysis sense. PLVs range from 0 to 1, such that PLVs close to 1 (rare in practice) indicate completely phase-locked activity at a given frequency and sensor, whereas PLVs near 0 indicate no phase locking across trials. ϕ is constrained between −π and π and reflects the average phase across trials at a given frequency and sensor. See Lachaux et al. (1999) for further details regarding PLV analyses. PLVs were calculated for each sensor separately and then averaged across sensors for statistical analysis.
Next, additional circular means were calculated across sensors and then across subjects (separately), as defined by the following:
 |
Where S is the number of sensors and ϕS(f) represents the average phase across sensors at a given frequency. An analogous computation was performed to compute average phases across subjects. Last, phase lags between sensor groups and conditions were calculated as follows:
 |
Where a and b are angle measurements in radians, 〈x, y〉 represents the inner product of two complex values, and ∠(x, y) represents the phase lag between sensor groups or attended hemifields. Note that, unlike a conventional dot product, ∠(a, b) is constrained between −π and π and exhibits anti-symmetry with respect to its arguments (i.e., ∠(a, b) = − ∠(b, a)). Therefore, the sign of the angle gives an indication of the (albeit arbitrary) directionality of the phase lag. When possible, functions from the CircStats toolbox written for MATLAB (Berens, 2009) were used by our custom library of MATLAB scripts for these analyses.
In addition to examining phase and phase locking at the fundamental stimulus frequencies (i.e., the first harmonic), we were also interested in whether higher harmonics (multiples) of the stimulus frequencies were also involved in the entrainment response, as has been reported previously (Gomez-Ramirez et al., 2011). To this end, PLVs of the fundamental frequencies and their first 3 higher harmonics were submitted to a five-way ANOVA, with factors of Stimulus Frequency (1.3 or 1.5 Hz) × Attention (attended vs unattended signal) × Hemifield × Hemisphere × Harmonic (F1 − F4). A similar five-way ANOVA was computed to assess the relationship between entrainment and task performance, with factors of Stimulus Frequency × Target Detection (hits vs misses) × Attended Hemifield × Sensor Group × Harmonic. For this ANOVA, PLV values were z-scored (using the variability across the frequency domain) to minimize differences resulting from unequal trial numbers between hit and miss trials. Last, before computing both of these ANOVAs, it was ensured that the subject means for all conditions were normally distributed by way of the Kolmogorov–Smirnov test. For this test, PLV values were first converted to z-scores and then each condition was compared against the standard normal distribution.
It was also of interest whether the phases of the entrained oscillations changed systematically across the scalp, particularly between left and right occipital regions, and whether this was influenced by attended hemifield. By the methods mentioned previously, average phases were computed for each sensor, frequency of interest, and subject. Then the phase-lag between left and right sensor groups, ∠(left sensors, right sensors), was separately calculated for the attend left and attend right conditions at each attended harmonic. These interhemispheric phase-lag (IHPL) values were then submitted to two two-way Harrison–Kanji ANOVAs for circular values (Harrison and Kanji, 1988), 1 for each stimulus frequency, with factors of Attended Hemifield × Harmonic. For follow-up testing to determine which harmonics were most influenced by attended hemifield, further phase lags were calculated between the IHPL values of each condition ∠(attend left IHPL, attend right IHPL). One sample circular tests against a mean angle of 0 were then conducted on these values using a Bonferroni-corrected threshold of p = 0.0063.
Spectral power analyses.
To demonstrate reliability of the PLV analyses we conducted, we analyzed the spectral power of the averaged broadband signal for each subject and condition, computed by taking the magnitude of the FFT of the broadband signal after averaging across trials in the time domain. This measure of average power is similar to PLV because it also reflects activity that is consistent across trials (the rest has been averaged out of the broadband signal). As in the main PLV analysis, we conducted a five-way ANOVA with the same factors as before.
To capture activity not necessarily phase locked to the rhythmic stimuli, we also analyzed the total power of the signal by taking the magnitude of the FFT on each single trial and then averaging across trials. This is sometimes referred to as “induced” power because non-phase-locked activity is preserved when averaging across trials. We will refer to this measure as total power because power from phase-locked activity is also preserved. Because total power was considerably noisier than evoked power or PLV, a signal-to-noise ratio (SNR) was obtained by taking the ratio between power at a frequency of interest and the average power between the neighboring frequency bins on either side of it (±0.1 Hz), as has been done previously (Kim and Verghese, 2012). Again, another five-way ANOVA was conducted on the total power SNRs with the same factors as used in the main PLV analysis. We were only interested in effects related to attention in this analysis and thus omit reporting any other effects in the results.
Visual evoked potential analysis.
Based on suggestions from a reviewer of an earlier version of this manuscript, we decided to analyze whether the checkerboard reversals evoked a classic visual evoked potential (VEP) and whether there was also attentional modulation of this response. Specifically, we were interested in whether the P1 was modulated by attention (Mangun and Hillyard, 1987) and if it showed temporally distinct contralateral and ipsilateral phases, as has been shown previously (Di Russo et al., 2002).
VEPs were obtained for all conditions by further dividing the already processed 8.5 s broadband epochs into 600 ms segments (for each stimulus trigger) containing 100 ms of prestimulus baseline and 500 ms of poststimulus baseline. To remove slow drift caused by the entrainment response, each subject's average VEPs were high-pass filtered at 2 Hz using a second-order Butterworth filter with zero-phase shift. The average VEPs were then baseline corrected using the mean of the 100 ms prestimulus period and subsequently collapsed across stimulus configurations. The mean of these data across subjects was used to create topographies for an early and late time range, shown in Figure 7B. For simplification of waveform figures (Fig. 7A) and statistical analysis, VEPs were further collapsed across hemifield and hemisphere such that there remained only an attended and unattended waveform for contralateral and ipsilateral sensors.
Figure 7.

VEP waveforms and topographies. A, Averaged VEP waveforms (to each checkerboard reversal) for contralateral and ipsilateral sensors collapsed across all other factors. Gray bars indicate the early (left plot) and late (right plot) time periods that were used for statistical analysis and topography plotting. The gray bars are centered at the significant onset time of the attended waveform, which was defined as the 10th consecutive time-point (∼20 ms) that was significantly >0 (paired t test, p < 0.05). B, Amplitude topographies averaged across the early (left) and late (right) time periods. In the late time window, bilateral spreading can be seen in the attended VEP, but not the unattended.
For both the attended contralateral and ipsilateral VEPs, P1 onset latencies of the attended waveforms were determined using running t tests against a mean of 0 at an uncorrected significance level of p = 0.05. The onset latency was then defined as the 10th consecutive sample point (19.53 ms) at which the waveforms were significantly >0. Because this analysis revealed that the onset latency was substantially later for the ipsilateral P1, data were averaged across an early and a late time bin, each 29.29 ms long and centered at their respective onset times. To test the laterality and attentional modulation of the P1, these early and late time bins were submitted to a three-way ANOVA with factors of Attention (attended/unattended) × Hemisphere (ipsilateral/contralateral) × Time Range (early/late).
Results
Task performance
The average target duration was 560 ± 159 ms (mean ± SD) longer than the standards (84% longer than the 1.5 Hz standard and 73% longer than the 1.3 Hz standard). Participants detected 76.4 ± 10.52% of targets on average (range = 61–91%), with an average reaction time of 588 ± 67 ms (range, 479–703 ms). There were no effects of attended hemifield or stimulus frequency on the percentage of targets detected (Attended Hemifield: F(1,17) = 2.07, p = 0.171; Stimulus Frequency: F(1,17) = 1.66, p = 0.217). However, both factors had an effect on reaction times (Attended Hemifield: F(1,15) = 4.71, p = 0.046; Stimulus Rhythm: F(1,15) = 10.4, p = 0.006). Reaction times were significantly shorter to left hemifield targets (p = 0.041; left targets: 579 ms ± 74 ms; right targets: 596 ± 68 ms) and significantly shorter to targets in the 1.3 Hz stimulus stream (p = 0.013; 1.3 Hz stream: 579 ± 70 ms; 1.5 Hz stream: 597 ± 72 ms).
Compared with the number of nontarget stimuli, participants made very few false alarms (mean = 1.63 ± 0.95%). Therefore, the resulting perceptual sensitivity (d′) values were relatively high (mean = 2.97 ± 0.46). Similar to reaction times, d′ values showed a significant effect of Stimulus Rhythm (F(1,15) = 6.93, p = 0.019) and a trend toward significance of Attended Hemifield (F(1,15) = 4.3, p = 0.056). D′ values were significantly higher for left hemifield targets (p = 0.050; left targets: 3.041 ± 0.505; right targets: 2.904 ± 0.513) and significantly higher for targets in the 1.3 Hz stimulus stream (p = 0.032; 1.3 Hz stream: 3.040 ± 0.512; 1.5 Hz stream: 2.905 ± 0.507).
Robust entrainment during sustained spatial attention
The long periods of sustained spatial attention to one of two competing rhythmic checkerboard streams resulted in a clear rhythmicity in the averaged broadband EEG signal during the 8 s leading up to the target stimulus. As shown in the band-pass-filtered waveforms of Figure 2, the rhythmicity selectively corresponded to the frequency of the attended stimulus, thus indicating that phase entrainment can operate to select between multiple spatially separated rhythms in the visual modality. The “unattended” waveforms in Figure 2 represent activity epoched to the ignored target stimulus and show substantially less rhythmicity at the relevant frequency, suggesting that the majority of the entrainment response resulted from directed attention rather than the rhythmic stimulation itself or, alternatively, rhythmic suppression of the competing frequency (Horton et al., 2013; Lakatos et al., 2013a).
Consistent with previous entrainment and ssVEP studies (Herrmann, 2001; Gomez-Ramirez et al., 2011; Kim et al., 2011), several higher harmonic frequencies were also strongly phase locked to the attended stimulus and markedly attenuated in the unattended signal (Fig. 3). In contrast to the contralaterally focused unattended response, strong attentional enhancements of PLV were seen bilaterally over both contralateral and ipsilateral sensor groups.
Figure 3.
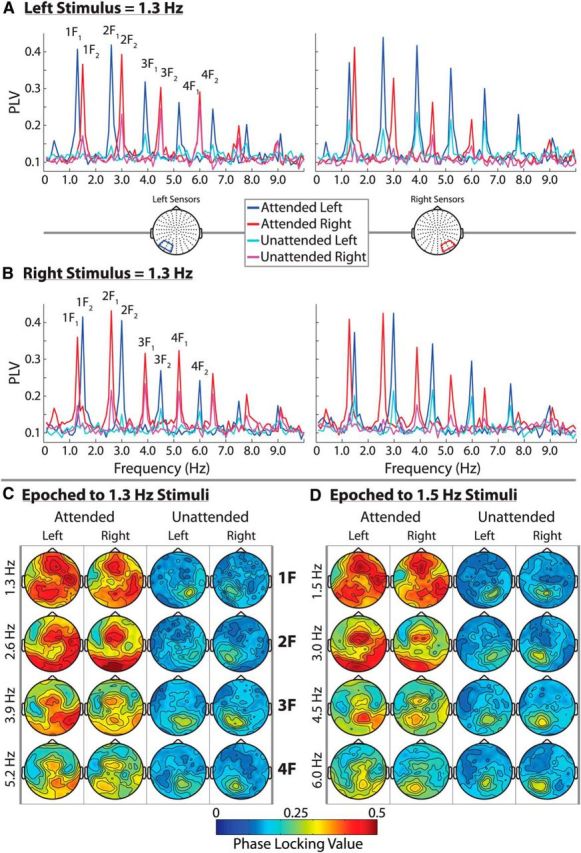
Spectral and topographical distribution of the entrainment response. A and B show average phase-locking spectra at left and right occipital sensor groups for the two stimulus configurations; 0.1–10 Hz PLVs are shown. Strong attentional modulation can be seen over both sensor groups at the frequency of the attended checkerboard stream (1F) as well as at several higher harmonics (2F–4F). The attended and unattended signals were obtained by segmenting the data according to the attended and unattended targets, respectively. This is why the “attend left” signals are distinctly different from the “unattended right” signals, for example. C and D show the full topographical distribution of the 4 most strongly entrained harmonics for 1.3 Hz stimuli and 1.5 Hz stimuli separately. Bilateral entrainment is readily visible in the attended signals. The harmonics are organized by rows and the attended/unattended signal for left/right hemifield stimuli are organized by columns.
Laterality of entrainment
To formally assess the laterality and attentional modulation of the entrained frequencies, a five-way repeated-measures ANOVA was conducted, with factors of Stimulus Frequency × Attention × Hemifield × Hemisphere × Harmonic. For the Harmonic factor, the fundamental stimulus frequency (i.e., the first harmonics: 1.3 or 1.5 Hz) and the next three harmonic frequencies (2.6, 3.9, and 5.2 Hz or 3.0, 4.5, and 6.0 Hz) were included because these were the frequencies with the highest PLVs at the left/right sensor groups of interest. These are also the frequencies for which full PLV topographies can be seen in Figure 3.
Main effects
There was a significant main effect of Attention (F(1,15) = 159, p < 0.001), demonstrating that attention dramatically increased PLV to the attended stimulus (mean PLV for attended = 0.349 ± 0.07; unattended = 0.182 ± 0.04; 91% increase in attended PLV, collapsing across all other factors). There were also main effects of Harmonic (F(3,45) = 7, p < 0.001) and Stimulus Frequency (F(1,15) = 11.2, p = 0.004; 1.3 Hz stimulus mean PLV: 0.273 ± 0.05; 1.5 Hz stimulus mean PLV: 0.258 ± 0.05).
Two-way interactions with attention
There was a significant Attention × Stimulus Frequency interaction (F(1,15) = 9.11, p < 0.001). This interaction was driven by greater attentional modulation of PLV to the 1.3 Hz stimulus (101% vs 82% increase in PLV), paralleling the behavioral finding that performance was better for 1.3 Hz targets. There was a significant Attention × Harmonic interaction (F(3,45) = 12.7, p < 0.001), indicating that the harmonics were not equally modulated by attention (percent increases: F1 = 135%, F2 = 130%, F3 = 58%, F4 = 51%). Because effects of phase at the attended harmonics would be tested in a later section, it was ensured that all attended harmonics were significantly entrained at both sensor groups (32 comparisons, all p < 0.001).
Other two-way interactions
There was a significant Stimulus Frequency × Hemisphere interaction (F(1,15) = 5.33, p = 0.036), reflecting a slight right hemisphere bias in PLV to the 1.3 Hz stimulus and a slight left hemisphere bias to the 1.5 Hz stimulus. In addition, there was a significant Hemifield × Hemisphere interaction (F(1,15) = 12.7, p = 0.003) driven by greater PLV over contralateral sensors for both stimulus hemifields.
Three-way interactions
The key interaction of interest in this analysis was the Attention × Hemifield × Hemisphere interaction. Based on existing EEG findings on visuospatial attention, the most likely scenario would be that contralateral sensors receive the most attentional modulation, resulting in a significant Attention × Hemifield × Hemisphere interaction. However, the current data show a different and very striking pattern: attentional modulation of the entrainment response occurred bilaterally and was actually stronger over ipsilateral sensors (average percent increases in attended PLV: ipsilateral = 122%, contralateral = 70%). This resulted in a significant Attention × Hemifield × Hemisphere interaction (F(1,15) = 8.03, p = 0.013). The greater attentional modulation over ipsilateral sensors is largely due to the contralateral PLV evoked by the unattended stimuli, as can be seen in Figure 3, rather than a raw increase in attended PLV over ipsilateral sensors. There was also a significant Hemifield × Hemisphere × Harmonic interaction (F(3,45) = 7.24, p < 0.001), which again is at least partly driven by the contralateral focus of unattended PLV.
Last, there was one significant four-way interaction: Attention × Hemifield × Hemisphere × Harmonic (F(3,45) = 5.12, p = 0.005). Although a concrete interpretation is difficult, this four-way interaction might reflect that the attentional modulation of the entrainment response changed in both magnitude and topographical distribution across harmonics.
To summarize, widespread entrainment was observed at the frequency of an attended stimulus and at least three higher harmonics. Attentional modulation of the entrainment response occurred bilaterally and, in contrast to most previous literature, was actually stronger over ipsilateral sensors. Some interesting differences between harmonics were also observed. As can be seen in Figure 3, the maxima of the first attended harmonics were more anteriorly distributed than the second to fourth attended harmonics and the third and fourth attended harmonics became markedly weaker and showed less attentional modulation. Conversely, the unattended entrainment response remained contralaterally focused and of similar strength across harmonics.
Average and total power modulation during entrainment
As expected, spectral power distributions of the trial-averaged activity were almost identical to those of PLV. In fact, the five-way ANOVA revealed identical effects to the PLV ANOVA. Every significant effect mentioned in the previous section was also significant in this ANOVA and no other effects were present. This strong correspondence can be seen in Figure 4A.
Figure 4.
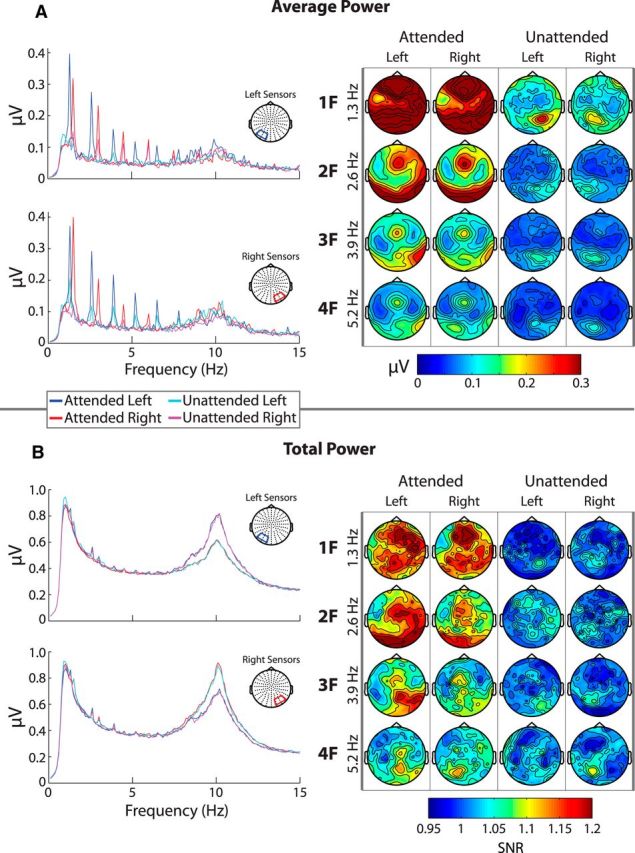
Power modulation of the entrainment response. A, Left, Spectral distributions of average power (FFT after averaging across trials) from 0.1 to 15 Hz for left and right sensor groups. The same color scheme is used in these spectra as in the previous figure (blue = attended left; red = attended right; cyan = unattended left; magenta = unattended right). Data from only one stimulus configuration is shown. A, Right, Topographical distributions of average power for the first four harmonics (rows) and for the attended and unattended signals to left and right hemifield stimuli (columns). Only data from 1.3 Hz stimuli are shown. Average power shows similarly strong modulations to those of PLV. B, Total power (FFT on single trials before averaging) of the entrainment response organized in the same manner as A. Here, topographies are expressed in terms of SNR computed by taking the ratio between power at a frequency of interest and the average power between the neighboring frequency bins on either side of it (±0.1 Hz). Note that, although similar topographical distributions can be seen, modulation was drastically weaker. Also note the strong lateralization in the alpha-band that can be seen in the total power spectrum. This is analyzed in a later section.
Total power was not expected to correspond as well to PLV because this measure includes activity that is not phase locked across trials and thus emphasizes single-trial amplitude enhancements rather than phase alignments. For example, if the entrainment response were entirely due to the phase alignment of ongoing activity without any concurrent amplitude enhancement, no peaks in the power spectrum would be visible. If, on the other hand, the entrainment response were entirely due to single-trial amplitude modulations, one would expect similarly large peaks to those observed in the PLV and average power spectra.
Total power seems to be less robustly modulated by the entrainment response than PLV, consistent with a scenario in which phase alignment is more strongly involved in the entrainment response than single-trial amplitude modulations. As can be seen in the spectral plots in Figure 4B, the peaks at the entrained harmonics were quite small relative to the total power at those frequencies. In fact, the third and fourth harmonic peaks were barely visible at all and there was only a very weak entrainment response in the unattended conditions. Instead, the unattended signals primarily showed power modulations at the attended harmonics (i.e., the unattended left signal showed power modulations at the harmonics of the right stimulus, rather than a contralateral response at the harmonics of the left stimulus, as was seen in the PLV analysis). The near absence of an entrainment response to the unattended frequencies in the total power spectra nicely illustrates that significant entrainment can occur without power modulation above the “background” noise level.
The five-way ANOVA on total power SNRs revealed a significant main effect of Attention (F(1,15) = 59.3, p < 0.001). Collapsing across all other factors, attentional modulation of total power was much smaller than that of PLV (8.8% increase in total power SNR vs 91% increase in PLV). See Figure 5 for a graphical comparison of attentional modulation between the different entrainment metrics at each harmonic and between sensor groups. As can be seen, attentional modulation of average power and PLV is orders of magnitude greater than that of total power. As in the PLV analysis, there was also a significant Attention × Harmonic interaction (F(3,45) = 10.8, p < 0.001), reflecting less attentional modulation at the higher harmonics (F1 = 13%; F2 = 11.7%; F3 = 6.9%; F4 = 2.9%). There were no other significant interactions involving attention. Notably, the significant Attention × Hemifield × Hemisphere interaction seen in the PLV analysis, reflecting greater attentional modulation over ipsilateral sensors, was absent from this ANOVA (F(1,15) = 0.669, p > 0.250).
Figure 5.
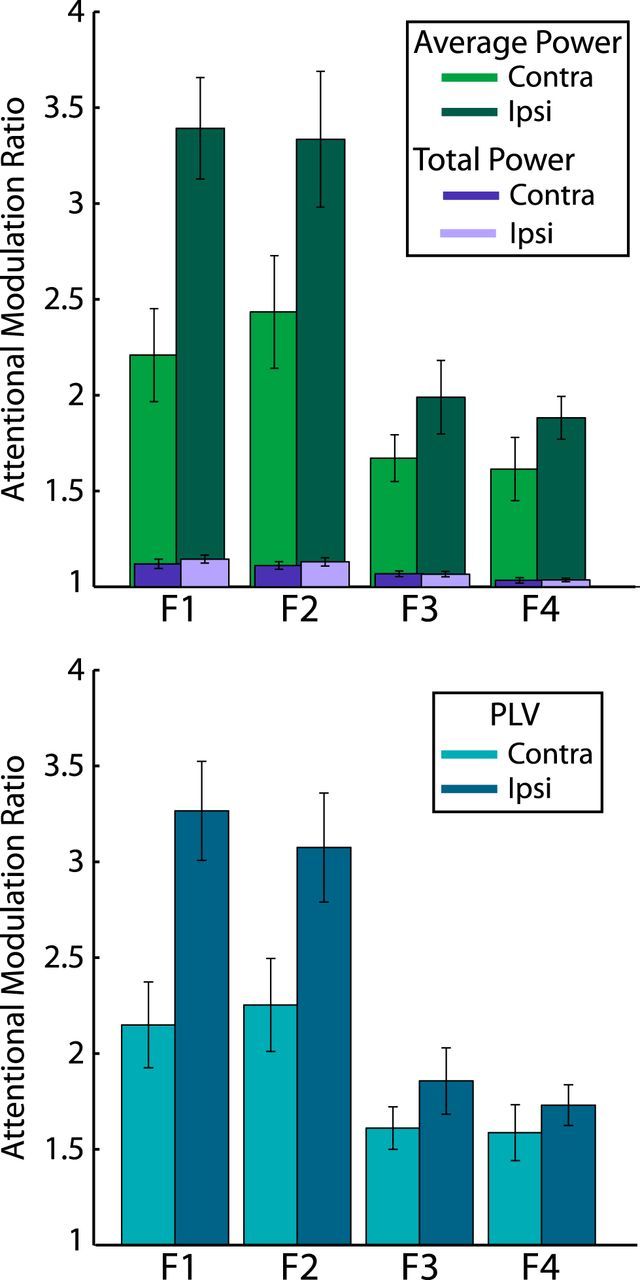
Attentional modulation ratios for both power metrics (top) and PLV (bottom). Data were first collapsed across stimulus configurations so that differences between contralateral and ipsilateral sensors could be more easily visualized. Ratios were then calculated between the attended and unattended signals at each harmonic. Error bars represent SEM across subjects.
Interhemispheric phase differences
If the bilateral entrainment response resulted from strong contralateral source projections (which might be expected if the response were entirely stimulus evoked), no meaningful differences in the average entrainment phases between hemispheres would be predicted (or one might observe a clear 180° phase reversal between opposite ends of a source dipole). Speaking against this possibility, a more gradual and systematic change in the average phase angle of the entrained frequencies and their harmonics was observed. Shown in Figure 6, the average phase at the first four harmonics of the attended frequency showed similar patterns of gradual change across the scalp. This pattern changed as a function of attended direction, suggesting that this phase pattern was not simply a passive property of the rhythmic sensory stimulation and was likely functional in nature. This seems to suggest that there was a reversal in the flow of the entrained oscillations.
Figure 6.
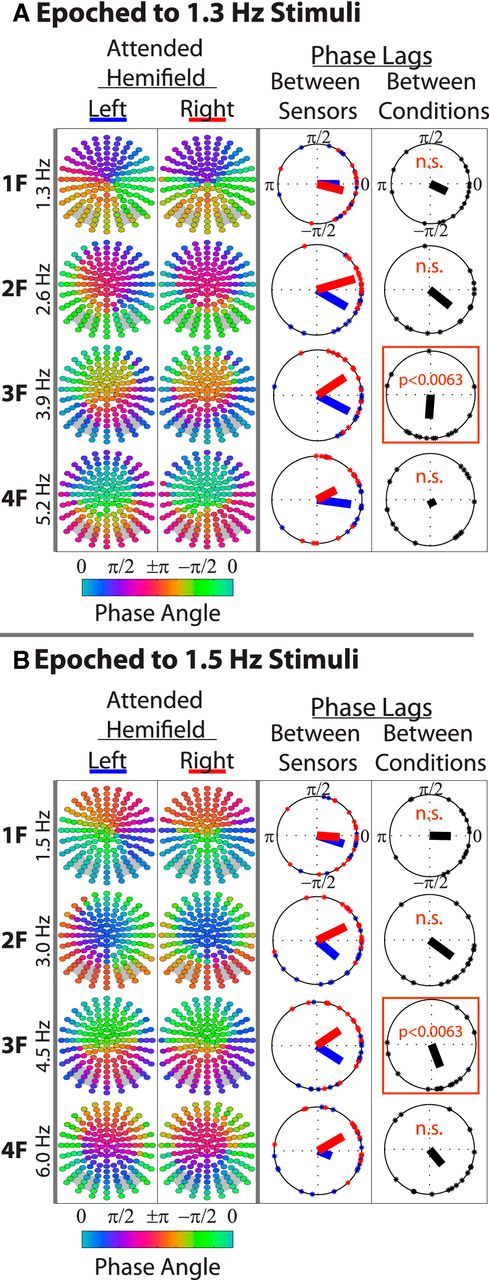
Topographical phase distributions of the entrainment response. A and B show the entrainment response to 1.3 and 1.5 Hz stimuli, respectively. In the first two columns of each panel, each point represents a sensor color coded by the average phase at the respective harmonic frequency. Phase values were first averaged across trials and then across participants, as described in the Materials and Methods. Only the attended responses are shown. Gray boxes in the background of each topography indicate the sensor groups that were analyzed. It was ensured that there was significant entrainment at all sensors and all harmonics (p < 0.001) before these phase analyses were conducted. In the third columns, phase lags between left and right sensor groups as a function of attended direction (blue = attend left; red = attend right). Points along the circumference of each plot represent single-subject phase lags. The direction of bars emanating from the plot origins represent average interhemispheric phase lags across subjects and the length of these bars indicates phase consistency. The fourth columns are phase lags (of the interhemispheric phase lags) between attended hemifields. Orange boxes denote significant differences from 0 (Bonferroni-corrected).
To test for potential interhemispheric phase differences that change as a function of attended hemifield, circular differences were first computed between each participant's average phases over left and right sensor groups. These values were then submitted to two two-way circular ANOVAs (Harrison and Kanji, 1988), one for each stimulus frequency, with Attended Hemifield × Harmonic as factors. Two-way ANOVAs were used instead of a single three-way ANOVA because, to the best of our knowledge, such a three-way extension has not yet been validated.
Confirming the visually apparent effect of attended hemifield on the phase topographies, a significant main effect of Attended Hemifield was found for both stimulus frequencies (1.3 Hz Stimulus: p < 0.001; 1.5 Hz Stimulus: p < 0.001). There was no main effect of Harmonic for either stimulus frequency, but there was a significant interaction of Attended Hemifield × Harmonic for the 1.3 Hz stimulus (p < 0.001), which only approached significance for the 1.5 Hz stimulus (p = 0.086).
To determine in which harmonics the interhemispheric phase differences were most influenced by attended hemifield, further circular differences (of the interhemispheric phase differences) between attend left and attend right conditions were computed for each subject. One sample circular tests against a mean angle of 0 were then conducted using a Bonferroni-corrected significance threshold of p = 0.0063. Significant nonzero differences were found for the third harmonic for both stimulus frequencies (p < 0.0063).
VEP analysis: latency and laterality of the P1
Although this study was not designed with the intention of obtaining a reliable VEP, there did appear to be one in the broadband signal, albeit of very small amplitude. Therefore, the latency and laterality of the checkerboard-evoked VEP were interrogated, as described in the Materials and Methods. We were specifically interested in the P1 component, which is typically lateralized in its early phase and sometimes has a later ipsilateral phase.
As can be seen in Figure 7A, the unattended P1 was remarkably attenuated across most of the poststimulus period (main effect of Attention: F(1,15) = 19.3, p < 0.001). The onset latency of the attended response was substantially later in the ipsilateral hemisphere (contralateral latency: 115.23 ms; ipsilateral latency: 144.53 ms). The topographies in Figure 7B confirm that the attended P1 was largely contralateral in the early time range (101.6 ms-128.9 ms) and then spread bilaterally in the later time range (130.9–158.2 ms). The unattended P1, on the other hand, shifted from being contralaterally focused in the early time range to being more ipsilaterally focused in the later time range. This pattern of results is corroborated by a significant Hemisphere × Time Bin interaction (F(1,15) = 14.8, p = 0.002). There was also far greater attentional modulation in the late time period, as indicated by a significant Attention × Time Bin interaction (F(1,15) = 12.4, p = 0.003).
Strength of entrainment influences task performance
To examine the relationship between target detection and entrainment during visuospatial attention, difficulty of the spatial CTET task was titrated such that participants inevitably missed an average of ∼25% of targets. We predicted that entrainment would be disrupted during trials in which the target delay went undetected. Since there were less of such “miss” trials, within-participant PLV values for “hit” and miss trials were separately normalized to z-scores (based on the variability across the frequency domain). As shown in Figure 8, phase locking across miss trials was substantially reduced over at least the first four harmonics. There did not appear to be any meaningful differences in entrainment topographies between hits and misses, suggesting that missing a target involves a breakdown of the entire entrainment network rather than disruption within one or a subset of visual areas.
Figure 8.

Entrainment influences task performance. A, B, Z-score topographies of PLV are shown for hit and miss trials (columns) at the first four harmonics (rows). A strong reduction in the entrainment response can be seen for miss trials across all harmonics. A and B are divided by stimulus frequency, as in previous figures.
These observations were tested with another five-way ANOVA with the following factors: Stimulus Frequency × Target Detection (hits vs misses) × Attended Hemifield × Hemisphere × Harmonic.
Main effects
Confirming the observation that there was substantially more entrainment during trials in which the target was detected, there was a significant main effect of Target Detection (F(1,15) = 121, p < 0.001; z-scores: Hits = 3.25 ± 1.03, Misses = 1.13 ± 0.69; 187% increase). There was also a significant main effect of Harmonic (F(3,45) = 11.7, p < 0.001), as in the previous five-way ANOVA; however, there was no main effect of Stimulus Frequency.
There was a significant Target Detection × Harmonic interaction (F(3,45) = 6.64, p = 0.001), reflecting a reduction in z-scores for both hits and misses at the higher harmonics, although the percentage at which target detection modulated the harmonics remained relatively stable (Percent increases in z-scores: F1 = 171%, F2 = 187%, F3 = 193%, F4 = 212%). Paralleling the behavioral advantages noted for left hemifield stimuli, the Target Detection × Hemifield interaction was approaching significance (F(1,15) = 4.24, p = 0.057). This was driven by a stronger modulation of Target Detection on entrainment to left hemifield stimuli (percentage increase in z-scores due to target detection: left hemifield = 209%, right hemifield = 167%).
Alpha-band lateralization and target detection
The unattended stimulus stream was subjectively very distracting, so successful performance on the task likely required suppression of this competing visual input. Oscillations in the alpha-band (8–12 Hz) have been repeatedly associated with this process, but more often in the context of anticipatory/cued shifts of attention (Worden et al., 2000; Thut et al., 2006; Kelly et al., 2009; Banerjee et al., 2011; Capilla et al., 2014), although they are also observed during sustained spatial attention tasks (Kelly et al., 2006) or even preparation of saccades (Belyusar et al., 2013). It was therefore of significant interest to determine whether regions that were entraining to an attended rhythm in the delta band (i.e., 1.3 or 1.5 Hz) would show concomitant suppressive oscillatory signatures in this faster frequency band. Furthermore, did alpha-band activity also play a role in target detection?
Within participants, total power was averaged across the alpha-band and subsequently collapsed across stimulus frequencies for hit and miss trials separately, and converted to z-scores (based on the variability across sensors) to normalize the relative contribution of alpha lateralization from a given participant. As shown in Figure 9, robust lateralization of alpha power was observed over occipital scalp regions such that alpha power was greater over the hemisphere ipsilateral to the attended hemifield (Worden et al., 2000). There were also small differences in alpha lateralization in hit versus miss trials, replicating what was found in a nonspatial variant of this task (O'Connell et al., 2009). To test these observations, a three-way ANOVA with Target Detection × Attended Hemifield × Hemisphere as factors was conducted. As predicted, and replicating numerous studies, there was a robust Attended Hemifield × Hemisphere interaction (F(1,15) = 68.2, p = 5.84e-07), demonstrating that there was significantly higher alpha power over ipsilateral sensors when attending either hemifield (attend left = 128% ipsilateral increase z-scores; attend right = 68% ipsilateral increase). There was also a significant Target Detection × Attended Hemifield × Hemisphere interaction (F(1,15) = 7.31, p = 0.0163), confirming that there was a reduction in alpha lateralization in miss versus hit trials (hits: attend left = 141% ipsilateral increase, attend right = 74% ipsilateral increase; misses: attend left = 115% ipsilateral increase, attend right = 64% ipsilateral increase). There was no main effect of Target Detection (F(1,15) = 0.96, n.s.), suggesting that lapses of attention in this task were not influenced by global changes in alpha and were instead hemisphere specific. There was a main effect of Attended Hemifield (F(1,15) = 5.6, p = 0.0319), driven by overall higher alpha power when attending to the left hemifield. There was also a trending effect of Hemisphere (F(1,15) = 3.97, p = 0.0647), suggesting that there was more alpha power over the right hemisphere regardless of the attended hemifield (Foxe et al., 1998).
Figure 9.

Alpha-band lateralization during entrainment. Top, Replicating previous findings, strong lateralization of total power in the alpha-band (8–12 Hz) can be seen. Within participants, total power was first averaged across 8–12 Hz and then normalized by converting to z-scores. The resulting z-score topographies were then averaged across participants. Bottom, Difference topographies between hit and miss trials. Although the differences are relatively small, they demonstrate a significant reduction in alpha lateralization in miss trials. For both attended hemifields, alpha power was greater for hit trials over ipsilateral areas and weaker over contralateral areas.
Discussion
Bilateral entrainment during unilateral spatial attention
The current data demonstrate that entrainment of low-frequency neuronal oscillations (1.3 or 1.5 Hz in our experiment) can operate as a mechanism to resolve competition between two continuously presented, spatially separated streams of visual input. Using two distinct stimulus rhythms allowed for the isolation of the neural responses occurring simultaneously to the attended and unattended streams. It was shown that sustained spatial attention to a rhythmic stimulus in one hemifield resulted in dramatically increased phase locking to the attended stimulus frequency and also several higher harmonics. This entrainment was robust and widespread, including bilateral visual areas and extending over frontal-central regions, which is not what would be expected of a typical visual sensory response. The phase locking evoked by the unattended stimulus, on the other hand, was substantially weaker and was confined to a highly delimited set of contralateral sensors. This topographical dissociation suggests that neuronal populations in both hemispheres of visual cortex can be recruited when attending to a unilateral region of visual space. Furthermore, because modulations of phase locking and average power were orders of magnitude larger than total power, it can be concluded that the entrainment response was largely due to the alignment of ongoing oscillations, rather than the result of single-trial amplitude enhancements.
That ipsilateral visual areas can be recruited during sustained attention to one hemifield is quite surprising in light of decades of research demonstrating contralateral cortical mapping and attentional modulation of the visual hemifields. Many human fMRI studies have characterized the contralaterally mapped visuospatial attention network (Gandhi et al., 1999; Somers et al., 1999; Beauchamp et al., 2001; Corbetta and Shulman, 2002), and spatiotopic attentional modulations have been observed to extend into parietal regions (Silver et al., 2005). EEG studies have paralleled these findings by showing that shifts in covert attention result in a contralateral increase in the amplitude of the early components of the transient VEP (Woldorff et al., 1997; Hillyard et al., 1998; Martinez et al., 1999; Luck et al., 2000; Di Russo et al., 2003; Kelly et al., 2008) as well as in the power of the so-called steady-state VEP (Morgan et al., 1996; Müller et al., 1998; Müller and Hillyard, 2000). Because most of these studies have found highly similar topographies for attended and unattended stimuli and only observed amplitude or power modulations, these findings have been taken to reflect an amplification of the stimulus-driven neuronal response. Attentional modulation of the VEP was also found in the current study; however, this manifest as an atypical bilateral positivity in the later ipsilateral phase of the attended P1. Conversely, the unattended P1 showed a more typical contralateral to ipsilateral shift in its topography (Di Russo et al., 2003). This topographic spreading of the attended P1 parallels that of the attended entrainment response and provides indirect support for the hotly debated hypothesis that the alignment of ongoing oscillations, rather than single-trial amplitude fluctuations, are the major contributor to the VEP (Makeig et al., 2002; Gruber et al., 2005; Moratti et al., 2007).
Relationship between entrainment and alpha lateralization
Lateralized oscillatory activity within multiple distinct frequency bands has also been observed during spatial attention (Siegel et al., 2008). Of particular interest to the current study, our group and others have repeatedly shown that oscillatory power in the alpha-band (8–12 Hz) increases over the hemisphere ipsilateral to an attended stimulus (Worden et al., 2000; Kelly et al., 2006; Kelly et al., 2009; Capilla et al., 2014; Frey et al., 2014) and is even retinotopically specific within a hemifield (Rihs et al., 2007). This has been most commonly interpreted as a top-down inhibitory mechanism serving to reduce neuronal excitability and consequently inhibit the processing of ignored information (Foxe and Snyder, 2011). Consistent with these findings, a highly lateralized distribution of alpha power was found here, demonstrating that suppressive oscillatory mechanisms were concurrently active during entrainment.
Extending the findings of Kelly et al. (2009) to a sustained attention task, it was also found that small reductions in alpha lateralization were associated with trials in which participants failed to detect the target stimulus. An even stronger association was found between target detection and the entrainment response, suggesting that alpha lateralization and the bilateral propagation of attended information represent complimentary mechanisms that are both functionally important in resolving competition during spatial attention. The fact that there was topographic overlap between alpha lateralization and entrainment also speaks to the neural selectivity of alpha lateralization. The incoming to-be-ignored rhythm was prevented from propagating past presumably early visual areas while the attended rhythm flourished. Perhaps the putative reduction in ipsilateral neural excitability caused by alpha lateralization was necessary for the low voltage but highly synchronized entrainment response to supersede the competing rhythm in these areas.
Because there appeared to be very little phase-locked activity in the alpha-band (as demonstrated by the average power spectra in Fig. 4A), we further speculate that alpha could also operate by desynchronizing incoming information, thereby preventing this input from properly resetting the phase of endogenous oscillations and subsequently being linked with neural populations involved in higher-order processing. It should be noted, however, that in the case of briefly presented target stimuli, alpha does exhibit a phasic relationship with detection (Mathewson et al., 2009), particularly when alpha oscillations (specifically, 10 Hz) have been entrained by a preceding rhythmic stimulus (Mathewson et al., 2012; Spaak et al., 2014). Perhaps alpha assumes a more phasic role when the task involves transient stimuli or stimulation rates in this range.
Potential functional importance of harmonic oscillations
A relationship was found between attended hemifield and the interhemispheric phase lag of the entrainment response, such that this difference reversed sign depending on which hemifield was attended. This striking pattern of results suggests that the widespread entrainment response reflects a functional flow of information between hemispheres. This effect was significant at the third attended harmonic, also appeared reliably at the second harmonic, and was almost completely absent at the first harmonic, suggesting that the harmonics may play different functional roles within the entrainment response.
Speaking further to this possibility, a subtle but interesting topographical dissociation was seen between the first and second attended harmonics, perhaps reflecting the dorsal and ventral attention networks described by Corbetta and Shulman (2002). The second harmonic was more ventrally distributed, showing maximal entrainment over bilateral occipitotemporal regions and also over a distinct frontocentral region, whereas the maxima of first harmonic were located more dorsally and anteriorly over parietal areas and over an even more frontal region than in the second harmonic. Because the third harmonic also showed an occipitotemporally biased topography and because both of these harmonics (and not the first) seemed to show the aforementioned relationship between interhemispheric phase lag and attended hemifield, perhaps the second and third harmonics are reflective of a cortical network that is more involved in the initial relay of attended information between visual hemispheres. The more frontoparietally biased first harmonic may in turn reflect a network more involved in attentional control itself, which would be consistent with recent work that has demonstrated stimulus-independent oscillatory synchronization between frontal and parietal regions during spatial attention (Siegel et al., 2008). In the current study, attention-induced interregional synchrony was instead robustly tagged by an attended stimulus rhythm and its harmonics. Although principled follow-up studies are needed, low-frequency entrainment could prove to be a particularly useful technique for probing oscillatory synchronization within and between attentional networks, particularly if distinct networks are indeed being tagged by separate harmonics of a single stimulation frequency (other studies not involving spatial attention have already suggested this possibility: Pastor et al., 2007; Heinrichs-Graham and Wilson, 2012).
Another recent covert spatial attention study has also provided evidence for distinct networks being tagged at different harmonics (Kim et al., 2011), although the stimulation rates used were much higher (12.5 and 16.67 Hz). The dissociation that they found was more clear-cut: the first harmonic occurred bilaterally and showed no attentional modulation, whereas the second harmonic was strongly lateralized and modulated by attention. The investigators speculated that the first harmonic in their data reflected population activity of low-level frequency-following neurons, whereas the second harmonic reflected activity from frequency-doubling neurons involved in higher-order processing. Although this is a compelling framework for their observations, it is unclear how it can be reconciled with numerous aspects of the current findings. Attentional modulation occurred almost as robustly in the first harmonic but was nonexistent in their data. Attention also induced a drastic topographic spreading of the entrainment response in all four harmonics that we examined, whereas no such change was seen in their data. A third and fourth harmonic were seen in their data (and often are in ssVEP studies); however, they were not analyzed in the context of attention.
Together with the findings of other ssVEP studies of spatial attention, all of which used much higher entrainment frequencies, it seems plausible that the low-frequency stimulation rates used in the current study allowed for the tagging of one or more endogenous (not stimulus-driven) attentional networks involved in sustained spatial attention that are simply not indexed by higher-frequency entrainment. Although less likely, it is also possible that the current findings reflect a separate mechanism of visuospatial attention that is only in operation when lower-frequency stimulus rhythms are involved.
Footnotes
This work was primarily supported by the National Science Foundation (Grant BCS1228595 to J.J.F.). T.J.W. received partial support from the National Institute of General Medical Sciences Medical Scientist Training Program (Grant T32 GM007288). Participants in this study were recruited and evaluated at The Human Clinical Phenotyping Core, a facility of the Rose F. Kennedy Intellectual and Developmental Disabilities Research Center, which is funded through a center grant from the Eunice Kennedy Shriver National Institute of Child Health and Human Development (Grant P30 HD071593). We thank Frantzy Acluche and Gregory Peters for help with data collection.
The authors declare no competing financial interests.
References
- Banerjee S, Snyder AC, Molholm S, Foxe JJ. Oscillatory alpha-band mechanisms and the deployment of spatial attention to anticipated auditory and visual target locations: supramodal or sensory-specific control mechanisms? J Neurosci. 2011;31:9923–9932. doi: 10.1523/JNEUROSCI.4660-10.2011. [DOI] [PMC free article] [PubMed] [Google Scholar]
- Beauchamp MS, Petit L, Ellmore TM, Ingeholm J, Haxby JV. A parametric fMRI study of overt and covert shifts of visuospatial attention. Neuroimage. 2001;14:310–321. doi: 10.1006/nimg.2001.0788. [DOI] [PubMed] [Google Scholar]
- Belyusar D, Snyder AC, Frey HP, Harwood MR, Wallman J, Foxe JJ. Oscillatory alpha-band suppression mechanisms during the rapid attentional shifts required to perform an anti-saccade task. Neuroimage. 2013;65:395–407. doi: 10.1016/j.neuroimage.2012.09.061. [DOI] [PMC free article] [PubMed] [Google Scholar]
- Berens P. CircStat: A MATLAB toolbox for circular statistics. Journal of Statistical Software. 2009;31:1–21. [Google Scholar]
- Besle J, Schevon CA, Mehta AD, Lakatos P, Goodman RR, McKhann GM, Emerson RG, Schroeder CE. Tuning of the human neocortex to the temporal dynamics of attended events. J Neurosci. 2011;31:3176–3185. doi: 10.1523/JNEUROSCI.4518-10.2011. [DOI] [PMC free article] [PubMed] [Google Scholar]
- Buzsáki G, Draguhn A. Neuronal oscillations in cortical networks. Science. 2004;304:1926–1929. doi: 10.1126/science.1099745. [DOI] [PubMed] [Google Scholar]
- Capilla A, Schoffelen JM, Paterson G, Thut G, Gross J. Dissociated alpha-band modulations in the dorsal and ventral visual pathways in visuospatial attention and perception. Cereb Cortex. 2014;24:550–561. doi: 10.1093/cercor/bhs343. [DOI] [PMC free article] [PubMed] [Google Scholar]
- Corbetta M, Shulman GL. Control of goal-directed and stimulus-driven attention in the brain. Nat Rev Neurosci. 2002;3:201–215. doi: 10.1038/nrn755. [DOI] [PubMed] [Google Scholar]
- Cravo AM, Rohenkohl G, Wyart V, Nobre AC. Temporal expectation enhances contrast sensitivity by phase entrainment of low-frequency oscillations in visual cortex. J Neurosci. 2013;33:4002–4010. doi: 10.1523/JNEUROSCI.4675-12.2013. [DOI] [PMC free article] [PubMed] [Google Scholar]
- Di Russo F, Martinez A, Sereno MI, Pitzalis S, Hillyard SA. Cortical sources of the early components of the visual evoked potential. Hum Brain Mapp. 2002;15:95–111. doi: 10.1002/hbm.10010. [DOI] [PMC free article] [PubMed] [Google Scholar]
- Di Russo F, Martínez A, Hillyard SA. Source analysis of event-related cortical activity during visuo-spatial attention. Cereb Cortex. 2003;13:486–499. doi: 10.1093/cercor/13.5.486. [DOI] [PubMed] [Google Scholar]
- Engel AK, König P, Gray CM, Singer W. Stimulus-dependent neuronal oscillations in cat visual cortex: inter-columnar interaction as determined by cross-correlation analysis. Eur J Neurosci. 1990;2:588–606. doi: 10.1111/j.1460-9568.1990.tb00449.x. [DOI] [PubMed] [Google Scholar]
- Foxe JJ, Snyder AC. The role of alpha-band brain oscillations as a sensory suppression mechanism during selective attention. Front Psychol. 2011;2:154. doi: 10.3389/fpsyg.2011.00154. [DOI] [PMC free article] [PubMed] [Google Scholar]
- Foxe JJ, Simpson GV, Ahlfors SP. Parieto-occipital approximately 10 Hz activity reflects anticipatory state of visual attention mechanisms. Neuroreport. 1998;9:3929–3933. doi: 10.1097/00001756-199812010-00030. [DOI] [PubMed] [Google Scholar]
- Frey HP, Schmid AM, Murphy JW, Molholm S, Lalor EC, Foxe JJ. Modulation of early cortical processing during divided attention to non-contiguous locations. Eur J Neurosci. 2014;39:1499–1507. doi: 10.1111/ejn.12523. [DOI] [PMC free article] [PubMed] [Google Scholar]
- Gandhi SP, Heeger DJ, Boynton GM. Spatial attention affects brain activity in human primary visual cortex. Proc Natl Acad Sci U S A. 1999;96:3314–3319. doi: 10.1073/pnas.96.6.3314. [DOI] [PMC free article] [PubMed] [Google Scholar]
- Gomez-Ramirez M, Kelly SP, Molholm S, Sehatpour P, Schwartz TH, Foxe JJ. Oscillatory sensory selection mechanisms during intersensory attention to rhythmic auditory and visual inputs: a human electrocorticographic investigation. J Neurosci. 2011;31:18556–18567. doi: 10.1523/JNEUROSCI.2164-11.2011. [DOI] [PMC free article] [PubMed] [Google Scholar]
- Gray CM, König P, Engel AK, Singer W. Oscillatory responses in cat visual cortex exhibit inter-columnar synchronization which reflects global stimulus properties. Nature. 1989;338:334–337. doi: 10.1038/338334a0. [DOI] [PubMed] [Google Scholar]
- Gruber WR, Klimesch W, Sauseng P, Doppelmayr M. Alpha phase synchronization predicts P1 and N1 latency and amplitude size. Cereb Cortex. 2005;15:371–377. doi: 10.1093/cercor/bhh139. [DOI] [PubMed] [Google Scholar]
- Harrison D, Kanji G. The development of analysis of variance for circular data. Journal of Applied Statistics. 1988;15:197–223. doi: 10.1080/02664768800000026. [DOI] [Google Scholar]
- Heinrichs-Graham E, Wilson TW. Presence of strong harmonics during visual entrainment: a magnetoencephalography study. Biol Psychol. 2012;91:59–64. doi: 10.1016/j.biopsycho.2012.04.008. [DOI] [PMC free article] [PubMed] [Google Scholar]
- Herrmann CS. Human EEG responses to 1–100 Hz flicker: resonance phenomena in visual cortex and their potential correlation to cognitive phenomena. Exp Brain Res. 2001;137:346–353. doi: 10.1007/s002210100682. [DOI] [PubMed] [Google Scholar]
- Hillyard SA, Vogel EK, Luck SJ. Sensory gain control (amplification) as a mechanism of selective attention: electrophysiological and neuroimaging evidence. Philos Trans R Soc Lond B Biol Sci. 1998;353:1257–1270. doi: 10.1098/rstb.1998.0281. [DOI] [PMC free article] [PubMed] [Google Scholar]
- Hipp JF, Engel AK, Siegel M. Oscillatory synchronization in large-scale cortical networks predicts perception. Neuron. 2011;69:387–396. doi: 10.1016/j.neuron.2010.12.027. [DOI] [PubMed] [Google Scholar]
- Horton C, D'Zmura M, Srinivasan R. Suppression of competing speech through entrainment of cortical oscillations. J Neurophysiol. 2013;109:3082–3093. doi: 10.1152/jn.01026.2012. [DOI] [PMC free article] [PubMed] [Google Scholar]
- Hutcheon B, Miura RM, Puil E. Subthreshold membrane resonance in neocortical neurons. J Neurophysiol. 1996;76:683–697. doi: 10.1152/jn.1996.76.2.683. [DOI] [PubMed] [Google Scholar]
- Kelly SP, Lalor EC, Reilly RB, Foxe JJ. Increases in alpha oscillatory power reflect an active retinotopic mechanism for distracter suppression during sustained visuospatial attention. J Neurophysiol. 2006;95:3844–3851. doi: 10.1152/jn.01234.2005. [DOI] [PubMed] [Google Scholar]
- Kelly SP, Gomez-Ramirez M, Foxe JJ. Spatial attention modulates initial afferent activity in human primary visual cortex. Cereb Cortex. 2008;18:2629–2636. doi: 10.1093/cercor/bhn022. [DOI] [PMC free article] [PubMed] [Google Scholar]
- Kelly SP, Gomez-Ramirez M, Foxe JJ. The strength of anticipatory spatial biasing predicts target discrimination at attended locations: a high-density EEG study. Eur J Neurosci. 2009;30:2224–2234. doi: 10.1111/j.1460-9568.2009.06980.x. [DOI] [PubMed] [Google Scholar]
- Kim YJ, Verghese P. The selectivity of task-dependent attention varies with surrounding context. J Neurosci. 2012;32:12180–12191. doi: 10.1523/JNEUROSCI.5992-11.2012. [DOI] [PMC free article] [PubMed] [Google Scholar]
- Kim YJ, Grabowecky M, Paller KA, Suzuki S. Differential roles of frequency-following and frequency-doubling visual responses revealed by evoked neural harmonics. J Cogn Neurosci. 2011;23:1875–1886. doi: 10.1162/jocn.2010.21536. [DOI] [PMC free article] [PubMed] [Google Scholar]
- Lachaux JP, Rodriguez E, Martinerie J, Varela FJ. Measuring phase synchrony in brain signals. Hum Brain Mapp. 1999;8:194–208. doi: 10.1002/(SICI)1097-0193(1999)8:4<194::AID-HBM4>3.0.CO%3B2-C. [DOI] [PMC free article] [PubMed] [Google Scholar]
- Lakatos P, Karmos G, Mehta AD, Ulbert I, Schroeder CE. Entrainment of neuronal oscillations as a mechanism of attentional selection. Science. 2008;320:110–113. doi: 10.1126/science.1154735. [DOI] [PubMed] [Google Scholar]
- Lakatos P, Schroeder CE, Leitman DI, Javitt DC. Predictive suppression of cortical excitability and its deficit in schizophrenia. J Neurosci. 2013a;33:11692–11702. doi: 10.1523/JNEUROSCI.0010-13.2013. [DOI] [PMC free article] [PubMed] [Google Scholar]
- Lakatos P, Musacchia G, O'Connel MN, Falchier AY, Javitt DC, Schroeder CE. The spectrotemporal filter mechanism of auditory selective attention. Neuron. 2013b;77:750–761. doi: 10.1016/j.neuron.2012.11.034. [DOI] [PMC free article] [PubMed] [Google Scholar]
- Lampl I, Reichova I, Ferster D. Synchronous membrane potential fluctuations in neurons of the cat visual cortex. Neuron. 1999;22:361–374. doi: 10.1016/S0896-6273(00)81096-X. [DOI] [PubMed] [Google Scholar]
- Luck SJ, Woodman GF, Vogel EK. Event-related potential studies of attention. Trends Cogn Sci. 2000;4:432–440. doi: 10.1016/S1364-6613(00)01545-X. [DOI] [PubMed] [Google Scholar]
- Makeig S, Westerfield M, Jung TP, Enghoff S, Townsend J, Courchesne E, Sejnowski TJ. Dynamic brain sources of visual evoked responses. Science. 2002;295:690–694. doi: 10.1126/science.1066168. [DOI] [PubMed] [Google Scholar]
- Mangun GR, Hillyard SA. The spatial allocation of visual attention as indexed by event-related brain potentials. Hum Factors. 1987;29:195–211. doi: 10.1177/001872088702900207. [DOI] [PubMed] [Google Scholar]
- Martínez A, Anllo-Vento L, Sereno MI, Frank LR, Buxton RB, Dubowitz DJ, Wong EC, Hinrichs H, Heinze HJ, Hillyard SA. Involvement of striate and extrastriate visual cortical areas in spatial attention. Nat Neurosci. 1999;2:364–369. doi: 10.1038/7274. [DOI] [PubMed] [Google Scholar]
- Mathewson KE, Gratton G, Fabiani M, Beck DM, Ro T. To see or not to see: prestimulus alpha phase predicts visual awareness. J Neurosci. 2009;29:2725–2732. doi: 10.1523/JNEUROSCI.3963-08.2009. [DOI] [PMC free article] [PubMed] [Google Scholar]
- Mathewson KE, Prudhomme C, Fabiani M, Beck DM, Lleras A, Gratton G. Making waves in the stream of consciousness: entraining oscillations in EEG alpha and fluctuations in visual awareness with rhythmic visual stimulation. J Cogn Neurosci. 2012;24:2321–2333. doi: 10.1162/jocn_a_00288. [DOI] [PubMed] [Google Scholar]
- Mercier MR, Foxe JJ, Fiebelkorn IC, Butler JS, Schwartz TH, Molholm S. Auditory-driven phase reset in visual cortex: human electrocorticography reveals mechanisms of early multisensory integration. Neuroimage. 2013;79:19–29. doi: 10.1016/j.neuroimage.2013.04.060. [DOI] [PMC free article] [PubMed] [Google Scholar]
- Moratti S, Clementz BA, Gao Y, Ortiz T, Keil A. Neural mechanisms of evoked oscillations: stability and interaction with transient events. Hum Brain Mapp. 2007;28:1318–1333. doi: 10.1002/hbm.20342. [DOI] [PMC free article] [PubMed] [Google Scholar]
- Morgan ST, Hansen JC, Hillyard SA. Selective attention to stimulus location modulates the steady-state visual evoked potential. Proc Natl Acad Sci U S A. 1996;93:4770–4774. doi: 10.1073/pnas.93.10.4770. [DOI] [PMC free article] [PubMed] [Google Scholar]
- Müller MM, Hillyard S. Concurrent recording of steady-state and transient event-related potentials as indices of visual-spatial selective attention. Clin Neurophysiol. 2000;111:1544–1552. doi: 10.1016/S1388-2457(00)00371-0. [DOI] [PubMed] [Google Scholar]
- Müller MM, Teder-Sälejärvi W, Hillyard SA. The time course of cortical facilitation during cued shifts of spatial attention. Nat Neurosci. 1998;1:631–634. doi: 10.1038/2865. [DOI] [PubMed] [Google Scholar]
- O'Connell RG, Dockree PM, Robertson IH, Bellgrove MA, Foxe JJ, Kelly SP. Uncovering the neural signature of lapsing attention: electrophysiological signals predict errors up to 20 s before they occur. J Neurosci. 2009;29:8604–8611. doi: 10.1523/JNEUROSCI.5967-08.2009. [DOI] [PMC free article] [PubMed] [Google Scholar]
- Oostenveld R, Fries P, Maris E, Schoffelen JM. FieldTrip: Open source software for advanced analysis of MEG, EEG, and invasive electrophysiological data. Comput Intell Neurosci. 2011;2011:156869. doi: 10.1155/2011/156869. [DOI] [PMC free article] [PubMed] [Google Scholar]
- Pastor MA, Valencia M, Artieda J, Alegre M, Masdeu JC. Topography of cortical activation differs for fundamental and harmonic frequencies of the steady-state visual-evoked responses: an EEG and PET H215O study. Cereb Cortex. 2007;17:1899–1905. doi: 10.1093/cercor/bhl098. [DOI] [PubMed] [Google Scholar]
- Rihs TA, Michel CM, Thut G. Mechanisms of selective inhibition in visual spatial attention are indexed by alpha-band EEG synchronization. Eur J Neurosci. 2007;25:603–610. doi: 10.1111/j.1460-9568.2007.05278.x. [DOI] [PubMed] [Google Scholar]
- Schroeder CE, Lakatos P. Low-frequency neuronal oscillations as instruments of sensory selection. Trends Neurosci. 2009;32:9–18. doi: 10.1016/j.tins.2008.09.012. [DOI] [PMC free article] [PubMed] [Google Scholar]
- Siegel M, Donner TH, Oostenveld R, Fries P, Engel AK. Neuronal synchronization along the dorsal visual pathway reflects the focus of spatial attention. Neuron. 2008;60:709–719. doi: 10.1016/j.neuron.2008.09.010. [DOI] [PubMed] [Google Scholar]
- Silver MA, Ress D, Heeger DJ. Topographic maps of visual spatial attention in human parietal cortex. J Neurophysiol. 2005;94:1358–1371. doi: 10.1152/jn.01316.2004. [DOI] [PMC free article] [PubMed] [Google Scholar]
- Somers DC, Dale AM, Seiffert AE, Tootell RB. Functional MRI reveals spatially specific attentional modulation in human primary visual cortex. Proc Natl Acad Sci U S A. 1999;96:1663–1668. doi: 10.1073/pnas.96.4.1663. [DOI] [PMC free article] [PubMed] [Google Scholar]
- Spaak E, de Lange FP, Jensen O. Local entrainment of alpha oscillations by visual stimuli causes cyclic modulation of perception. J Neurosci. 2014;34:3536–3544. doi: 10.1523/JNEUROSCI.4385-13.2014. [DOI] [PMC free article] [PubMed] [Google Scholar]
- Stern EA, Jaeger D, Wilson CJ. Membrane potential synchrony of simultaneously recorded striatal spiny neurons in vivo. Nature. 1998;394:475–478. doi: 10.1038/28848. [DOI] [PubMed] [Google Scholar]
- Thut G, Nietzel A, Brandt SA, Pascual-Leone A. Alpha-band electroencephalographic activity over occipital cortex indexes visuospatial attention bias and predicts visual target detection. J Neurosci. 2006;26:9494–9502. doi: 10.1523/JNEUROSCI.0875-06.2006. [DOI] [PMC free article] [PubMed] [Google Scholar]
- Woldorff MG, Fox PT, Matzke M, Lancaster JL, Veeraswamy S, Zamarripa F, Seabolt M, Glass T, Gao JH, Martin CC, Jerabek P. Retinotopic organization of early visual spatial attention effects as revealed by PET and ERPs. Hum Brain Mapp. 1997;5:280–286. doi: 10.1002/(SICI)1097-0193(1997)5:4<280::AID-HBM13>3.0.CO;2-I. [DOI] [PubMed] [Google Scholar]
- Worden MS, Foxe JJ, Wang N, Simpson GV. Anticipatory biasing of visuospatial attention indexed by retinotopically specific alpha-band electroencephalography increases over occipital cortex. J Neurosci. 2000;20:RC63. doi: 10.1523/JNEUROSCI.20-06-j0002.2000. [DOI] [PMC free article] [PubMed] [Google Scholar]