

Abstract
Ca2+-triggered release of neurotransmitters and hormones depends on soluble N-ethylmaleimide-sensitive factor attachment protein receptors (SNAREs) to drive the fusion of the vesicle and plasma membranes. The formation of the SNARE complex by the vesicle SNARE synaptobrevin 2 (syb2) and the two plasma membrane SNAREs syntaxin (syx) and SNAP-25 draws the two membranes together, but the events that follow membrane juxtaposition, and the ways that SNAREs remodel lipid membranes remain poorly understood. The SNAREs syx and syb2 have transmembrane domains (TMDs) that can exert force directly on the lipid bilayers. The TMD of syx influences fusion pore flux in a manner that suggests it lines the nascent fusion pore through the plasma membrane. The TMD of syb2 traverses the vesicle membrane and is the most likely partner to syx in completing a proteinaceous fusion pore through the vesicle membrane, but the role of this vesicle SNARE in fusion pores has yet to be tested. Here amperometry and conductance measurements were performed to probe the function of the syb2 TMD in fusion pores formed during catecholamine exocytosis in mouse chromaffin cells. Fusion pore flux was sensitive to the size and charge of TMD residues near the N terminus; fusion pore conductance was altered by substitutions at these sites. Unlike syx, the syb2 residues that influence fusion pore permeation fell along two α-helical faces of its TMD, rather than one. These results indicate a role for the syb2 TMD in nascent fusion pores, but in a very different structural arrangement from that of the syx TMD.
Keywords: calcium-triggered fusion, dense-core vesicle, exocytosis, secretion, synaptobrevin
Introduction
Soluble N-ethylmaleimide-sensitive factor attachment protein receptors (SNAREs) perform essential functions in Ca2+-triggered release of both neurotransmitters from synaptic terminals and hormones from endocrine cells, but the detailed mechanism by which these proteins drive membrane fusion remains elusive (Südhof and Rothman 2009; Jahn and Fasshauer 2012). The vesicle SNARE synaptobrevin 2 (syb2) and the two plasma membrane SNAREs syntaxin (syx) and SNAP-25 can form a tight, stable complex consisting of four parallel α-helices (Sutton et al., 1998). Because syx and syb2 have transmembrane domains (TMDs) anchored in the plasma and vesicle membranes, respectively, the formation of this complex will pull the two membranes together. At some point, lipid in the two membranes merges into a single bilayer, but the precise step where this mixing occurs is controversial. According to one view of SNARE-mediated fusion, SNAREs accelerate a lipid-mixing process that also occurs with protein-free lipid bilayers through the sequential formation of a stalk and a hemifusion diaphragm, and finally a lipid-lined fusion pore (Cohen and Melikyan 2004; Chernomordik and Kozlov 2008). A contrasting view holds that SNARE TMDs initially form a proteinaceous channel spanning both lipid bilayers (Lindau and Almers 1995; Jackson 2011). Distinguishing between these two models depends critically on establishing the roles of the SNARE TMDs, but efforts to address this question in different laboratories have produced dramatically different results (Grote et al., 2000; McNew et al., 2000; Langosch et al., 2007; Shi et al., 2012; Zhou et al., 2013). Mutations along one α-helical face of the syx TMD alter fusion pore permeation (Han et al., 2004; Han and Jackson 2005), much as mutations in pore-forming domains of ion channel proteins alter ion permeation (Ashcroft 1999). The most likely partner to syx in completing a proteinaceous channel through the vesicle membrane is the cognate vesicle SNARE syb2, but the role of vesicle SNAREs in controlling flux through fusion pores has yet to be investigated.
To address the role of the syb2 TMD in fusion pores, we studied exocytosis in chromaffin cells from syb2/cellubrevin double-knock-out (DKO) mice. These cells have very low endogenous vesicular SNARE levels and almost no secretion (Borisovska et al., 2005), thus providing an ideal background for testing syb2 mutants. Our measurements of altered fusion pore flux and conductance in chromaffin cells expressing various TMD mutations implicated several residues as fusion pore residents. These results support a structural model for the fusion pore through the vesicle membrane formed by alternating faces of the syb2 TMD, and with a constriction toward its cytoplasmic end.
Materials and Methods
Synaptobrevin 2 and cellubrevin double knock-out chromaffin cells.
Syb2/cellubrevin DKO mice were obtained by crossing syb2 heterozygous knock-out (KO) and cellubrevin homozygous KO mice (Borisovska et al., 2005). One quarter of each litter was DKO and expressed neither syb2 nor cellubrevin. The remainder had one or two wild-type (WT) alleles of syb2 and no cellubrevin, and were taken as littermate controls. Culturing embryonic day 17.5 (E17.5) to E18.5 embryonic mouse chromaffin cells was performed as described previously (Zhang and Jackson 2010). Embryos were genotyped, and cells from each embryo of either sex were cultured in separate dishes.
Molecular biology and virus transfection.
Mouse WT full-length syb2 and cytoplasmic domain of syb2 (cdsyb2) were amplified by PCR adding a XhoI 5′ site and an EcoRI 3′ site. This was then ligated into lentiviral vector pLox–CMV–EGFP to make an EGFP–syb2 fusion construct (with EGFP fused to the N terminus of syb2 linked by the sequence SGLRSRG). All of the amino acid substitutions in the syb2 TMD were generated by Quikchange Site-Directed Mutagenesis (Agilent Technologies). The WT EGFP–syb2, EGFP–cdsyb2, and all mutant constructs were confirmed by sequencing. Lentiviral particles were generated in HEK 293T cells, as described previously (Dong et al., 2006). Chromaffin cells were infected by viral particles on the day of dissection.
Amperometry.
Catecholamine release was detected as an oxidation current using 5 μm carbon fibers polarized to 650 mV. Current was recorded at room temperature (∼22°C) with a VA-10 amplifier (ALA Scientific Instruments). Cells that were in culture for 1–3 d were bathed in the following solution (in mm): 150 NaCl, 4.2 KCl, 1 NaH2PO4, 0.7 MgCl2, 2 CaCl2, and 10 HEPES, pH 7.4. Infected cells were recognized by EGFP fluorescence, and exocytosis was elicited by pressure ejection of a solution similar to the bathing solution but with 105 mm KCl and 5 mm NaCl from an ∼2 μm tipped micropipette positioned 10–15 μm from the cell. Each single amperometry recording lasted 23 s: the first 3 s recorded the resting state, KCl solution was then puffed for 6 s to elicit exocytosis, and recording continued for 14 more seconds. Cells were stimulated up to six times. Amperometry recordings were analyzed with a program written in this laboratory to extract spikes and prespike feet (PSF) information according to the criteria of Chow and von Rüden (1995). Spikes of ≥4 pA were used to determine the spike frequency, which was taken as the event number in the first response to depolarization divided by 20 s. The events in the first response to depolarization from all cells of the same construct were pooled, binned every second, and divided by cell number to construct the cumulative spike curve. The cumulative curve exhibited a sigmoidal shape, and the segment between 10% and 70% of the plateau was well fitted by linear regression (with R2 > 0.98 for all constructs tested). To compare 10–70% rising slopes of cumulative curves, one-way ANOVA was applied to the group of measurements displayed together (Fig. 1D). When this test rejected the null hypothesis that all of the measurements within the group had the same mean, a Dunnett's post-test was used to identify the measurements from mutations that differed from WT syb2. PSF with durations of ≥0.75 ms, from spikes with peaks of ≥20 pA, were used for PSF analysis. For PSF analysis, data were not used from cells with <20 fusion events to exclude very rare potentially nonrescued cells (untransfected DKO cells typically had ∼10 events total in six depolarization trials). PSF amplitude was determined by the PSF area divided by PSF duration. Amplitudes determined in this manner showed no significant correlation with duration (Wang et al., 2006). For comparison of PSF amplitudes, the means of cell means were determined (Colliver et al., 2000), and one-way ANOVA with Fisher's LSD post-test was used to identify the measurements from mutations that differed from WT syb2. The distribution of PSF durations was fitted by a single exponential decay, and the time constant represented the measure of the mean PSF duration. For comparison of PSF durations, one-way ANOVA with Dunnett's post-test was used to identify mutations that differed from WT syb2.
Figure 1.
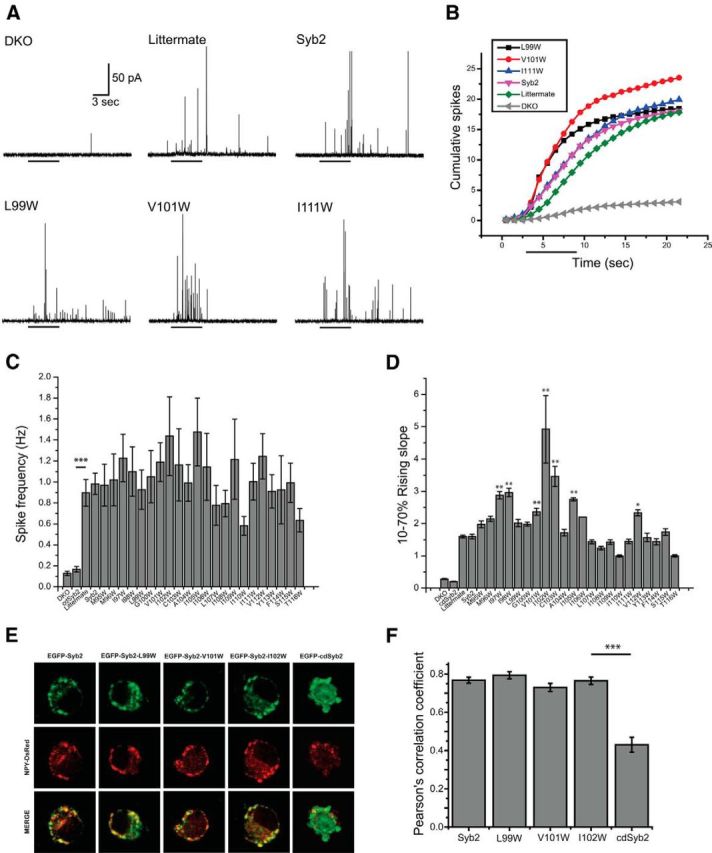
Amperometry recording from chromaffin cells. A, An amperometry trace from a syb2/cellubrevin DKO chromaffin cell showed very little secretion in response to depolarization with 105 mm KCl (application time is indicated by the bar below the trace). Cells from DKO littermates (see Materials and Methods), DKO cells transfected with WT syb2, and DKO cells transfected with three different syb2 TMD tryptophan mutants responded to depolarization with a barrage of spikes. Each spike reports the exocytosis of a single vesicle. B, Cumulative counts of spikes versus time show the average number of events in the first response to depolarization (indicated by the bar below) from transfected DKO and littermate chromaffin cells. Recordings, as in A, were pooled, binned every second, and divided by cell number to display the cumulative curves. C, Spike frequency (the event number in the first response to depolarization divided by the 20 s recording time during and after depolarization) for littermate, untransfected DKO chromaffin cells, and cells transfected with WT syb2 and mutants. One-way ANOVA failed to reject the null hypothesis. ***p < 0.001 for the comparison between DKO and littermate with a two-sample t test. (147 cells expressing WT syb2; 39 cells from littermate controls; 21–38 cells expressing mutants). D, The 10–70% rising slope of cumulative curves for DKO and littermate, and DKO chromaffin cells transfected with WT syb2, cdsyb2, or tryptophan mutants (*p < 0.05, **p < 0.01). E, Vesicle targeting of WT syb2, cdsyb2, and tryptophan mutants. Images of immunofluorescence labeling for syb2 (green) and neuropeptide Y (NPY, red) in DKO chromaffin cells transfected with NPY-DsRed and WT EGFP-syb2, tryptophan mutants, or cdsyb2. F, The colocalization of syb2 and NPY was evaluated with the Pearson's correlation coefficient. N = 17–26 cells. Error bars show the mean ± SEM.
Cell-attached capacitance recording.
Fusion pore conductance and vesicle capacitance were measured in cell-attached patches as described previously (Lollike et al., 1995; Klyachko et al., 2008). Cells were pretreated with 100 nm phorbol myristate acetate for 6 min, and recordings were made with 30 mm K+ in the bathing solution (in mm: 115 NaCl, 30 KCl, 5 CaCl2, 2 MgCl2, 20 glucose, and 10 HEPES, pH 7.3) to increase the basal level of exocytosis. Patch pipettes contained the following (in mm): 125 NaCl, 15 TEA-Cl, 4 KCl, 5 CaCl2, 2 MgCl2, and 10 HEPES, pH 7.3. Capacitance and conductance were taken as the out-of-phase and in-phase components, respectively, from recordings of complex impedance of cell-attached patches measured with an SR 830 lock-in amplifier (Stanford Research Systems) interfaced with a patch-clamp amplifier. Patches were held at 0 mV, and stimulated with a 20 kHz, 100 mV (rms) sine wave. Signals were filtered with a time constant of 3 ms and a slope of 24 dB. Capacitance recordings were analyzed with an in-house program written in IGOR Pro (WaveMetrics). Pore conductance (Gp) was calculated from the in-phase and out-of-phase lock-in outputs, as described previously (Lollike et al., 1995; Klyachko et al., 2008), and the value of fusion pore conductance was the average of Gp between the time points of the plateau in the in-phase component (see Fig. 4B, two vertical dashed lines). Fusion pore duration was estimated by the full-width at half-maximum of the real (Re) part, and events with a duration of <15 ms were discarded.
Figure 4.

Capacitance steps and fusion pore conductance in cell-attached patches of DKO chromaffin cells. A, Representative Im and Re traces from a lock-in amplifier coupled to a patch-clamp amplifier. Some capacitance steps in the Im trace were accompanied by a transient rise in the Re trace. B, The Im and Re traces from different experiments than that in A illustrate the calculation of Gp = (Im2 + Re2)/Re (Lollike et al., 1995). The dashed vertical lines delimit the plateau in the Re trace for calculation of the fusion pore conductance. C, Mean vesicle capacitance in DKO chromaffin cells expressing WT syb2 and mutants (N = ∼200 events). D, Mean fusion pore conductance for syb2 and mutants (N = 19∼34 events). *p < 0.05; for Fisher's least significant difference post-test compared with WT syb2 after one-way ANOVA rejected the null hypothesis. E, Mean fusion pore duration for syb2 and mutants. Error bars show the mean ± SEM.
Immunocytochemistry and confocal imaging.
DKO chromaffin cells were transfected with neuropeptide Y-DsRed (NPY-DsRed) and WT EGFP-syb2 or EGFP-syb2 TMD mutants. Three days after transfection, cells were fixed with 4% paraformaldehyde, permeabilized, blocked in 10% goat serum and 0.1% Triton X-100, and immunostained with mouse anti-syb2 antibody (catalog #104211, Synaptic Systems) and rabbit anti-RFP antibody (catalog #ab62341, Abcam) at room temperature for 1 h. After washing three times with PBS, cells were treated with Cy2-goat anti-mouse and Alexa Fluor 568-goat anti-rabbit secondary antibodies for 1 h at room temperature. Images of immunostained cells were acquired on a Nikon Eclipse Ti confocal microscope with a 100×, 1.49 numerical aperture oil-immersion lens. The laser intensity was set to 6% for 488 nm and 8% for 561 nm, and the exposure time was between 100 and 200 ms. Pearson's correlation coefficient was determined using Nikon Eclipse Ti colocalization analysis software.
Results
Amperometry recordings from WT chromaffin cells generally reveal trains of spikes in response to depolarization, with each spike reporting the exocytosis of a single vesicle. Our amperometry recording confirmed the very low levels of secretion from DKO chromaffin cells. WT syb2 and all tryptophan mutants tested here rescued secretion to similar overall levels, producing approximately eightfold increases in the frequency of fusion events, with a range of 0.6–1.5 Hz over the background measured in untransfected DKO chromaffin cells (0.12 Hz; Fig. 1C). Sample amperometry traces (Fig. 1A) and cumulative spike plots (Fig. 1B) for DKO cells, littermate control cells, and DKO cells expressing WT syb2, and three selected mutants were illustrated. To assess release kinetics, we determined the slope of linear fits to the cumulative curves from 10% to 70% of the final plateau for DKO, littermate, DKO cells expressing WT syb2, cdsyb2, and all of our TMD tryptophan mutants. All full-length syb2 constructs increased the 10–70% slope well above that seen in control DKO cells and cells expressing the cytoplasmic domain of syb2 (Fig. 1D). Several of the mutants rescued better than WT. These mutants targeted dense-core vesicles, colocalizing with a vesicle marker (NPY-DsRed) to a degree indistinguishable from that for wild-type syb2, and well above that for the cdsyb2 (Fig. 1E,F). Mutations produced only small changes in spike amplitude and no significant changes in spike area (data not shown).
Single-vesicle spikes recorded with amperometry are often preceded by feet, which signal a low level of catecholamine release in advance of full fusion. These PSF represent catecholamine flux through nascent fusion pores (Chow et al., 1992; Jankowski et al., 1993; Wang et al., 2001), and PSF recorded from cells transfected with WT and mutant syb2 had qualitatively similar appearances (Fig. 2A). We examined PSF in amperometry recordings from DKO chromaffin cells transfected with 22 mutants harboring tryptophan substitutions within the syb2 TMD (residues 95–116). With four of these mutants, L99W, V101W, C103W, and I105W, PSF had significantly reduced amplitudes (Fig. 2B; p < 0.001 for L99W; p < 0.01 for V101W; p < 0.05 for C103W and I105W). These four residues all resided within the N-terminal half of the TMD, on two different faces of a helical wheel (Fig. 2C). Mutations also altered PSF duration without a clear pattern in terms of TMD structure (Fig. 2D). The reduction in PSF amplitude suggests that the side chains of these residues protrude into the pore lumen and obstruct catecholamine flux.
Figure 2.

Spikes and PSF in DKO chromaffin cells expressing WT syb2 and TMD mutants. A, Amperometry recordings of single spikes with PSF are indicated by shading. B, The means of cell means of PSF amplitudes are shown for DKO chromaffin cells expressing WT syb2 (147 cells, 2347 events) and 22 different tryptophan TMD mutants (21–38 cells, 270–729 events for each), as well as littermate control cells (39 cells, 700 events). ANOVA indicated statistically significant variations with mutants (p < 0.001), and PSF amplitudes were significantly reduced in mutants with tryptophan at positions 99, 101, 103, and 105 compared with WT syb2 (*p < 0.05, **p < 0.01, ***p < 0.001). C, A helical wheel model (generated by DNASTAR, DNASTAR Inc.) placed the four locations where tryptophan reduced PSF amplitude (indicated with red) on two separate faces of an α-helix. D, PSF durations are shown for littermate and DKO chromaffin cells expressing WT syb2 or tryptophan mutants. *p < 0.05, **p < 0.01 compared with WT syb2. Error bars show the mean ± SEM.
We explored this idea further by substituting glycine at positions 99 and 101. Both these mutations increased PSF amplitude, but only the change with residue 101 was significant. Linear regression showed an inverse correlation between PSF amplitude and side chain volume, which was significant for position 101 (Fig. 3A,B). (These mutations also had small effects on spike amplitude; data not shown.) At positions 102 and 111, where tryptophan had no effect, glycine substitutions also had no effect, and there was no correlation between PSF amplitude and side chain volume (Fig. 3C,D). These steric effects were not additive: quadruple mutations at positions 99, 101, 103, and 105 with either four tryptophans or four glycines left the PSF amplitude indistinguishable from single tryptophan or glycine substitutions at these sites (Fig. 3G,H). We also tested a mutant with four tryptophan substitutions in the C-terminal half of the syb2 TMD (Fig. 3G, Cter 4W). None of the tryptophan mutations in this region had an effect, and the quadruple mutant also left PSF amplitude indistinguishable from that of WT syb2. These quadruple mutations also increased PSF duration (Fig. 3I).
Figure 3.

A–D, Relation between PSF amplitude and side chain volume. PSF varied with side chain volume at positions 99 and 101, but only at position 101 was this variation statistically significant. At positions 102 and 111, side chain volume had no effect. The points are means of 24–44 cells (290–1064 events for each mutant). Letters identify the amino acid present at the indicated position. E, F, Relation between PSF amplitude and side chain charge. PSF amplitude increased with the number of negatively charged aspartic acid substitutions and decreased with the number of positively charged arginine substitutions. One charge was introduced at position 99; two charges were introduced at 99 and 101 (2D, 2R); and four charges were introduced at 99, 101, 103, and 105 (4D, 4R). The points are the means of 26–52 cells (220–529 events) for mutants. p values from linear regression are indicated in each plot. G, H, PSF amplitudes in DKO chromaffin cells expressing syb2 with single and multiple tryptophan or glycine TMD mutations. The mean PSF amplitude in DKO chromaffin cells expressing single tryptophan or glycine mutations at position 99 or 101; double glycine mutation at both 99 and 101; and quadruple mutations at 99, 101, 103, and 105 (4W, 4G), and in the C-terminal half of the syb2 TMD (positions 108, 110,112, and 113; Cter-4W). The single mutation values are taken from Figure 2. N = 32–47 cells (290–1133 events) for mutants, 147 cells (2347 events) for WT syb2. *p < 0.05; ***p < 0.001 compared with WT syb2. Two p values are also indicated in H for mutants with changes that were not statistically significant. I, PSF durations are shown for DKO chromaffin cells expressing WT syb2, single and double glycine, and charged mutants; and quadruple glycine, tryptophan, and charged mutations. **p < 0.01 compared with WT syb2. Error bars show the mean ± SEM.
Catecholamine carries a positive charge at neutral pH, and since charge within the syx TMD influences PSF amplitude (Han and Jackson 2005), we tested the role of charge in the TMD of syb2. Substituting residues with negatively charged side chains at positions where tryptophan had an effect significantly increased the PSF amplitude (Fig. 3E), and positively charged side chains did the opposite (Fig. 3F). Charged mutations did not greatly alter PSF duration (Fig. 3I). In contrast to the results produced by additional tryptophan and glycine substitutions, additional charge substitutions produced further changes in PSF amplitude, indicating an additive electrostatic interaction between the syb2 TMD and catecholamine as it passes through the nascent fusion pore. The contrast between additive electrostatic interactions and nonadditive steric effects may reflect the longer range of electrostatic forces or the accommodation of multiple steric effects by subtle rearrangements in TMD packing. Quadruple charged mutations targeted vesicles to a degree that was intermediate between that of the syb2 cytoplasmic domain and WT syb2 or single mutations (Pearson's coefficient, ∼0.55; compare with Fig. 1F). Quadruple mutants increased the frequency of fusion events and 10–70% of slopes fourfold to fivefold over control DKO cells (data not shown), rather than approximately eightfold for WT syb2 and most single mutations.
To evaluate fusion-pore obstruction by a different method, we used a lock-in amplifier to measure the complex impedance of cell-attached membrane patches. The fusion of a single vesicle produced stepwise increases in membrane capacitance [Fig. 4A,B, imaginary (Im) trace]. When capacitance steps were accompanied by a transient increase in the in-phase (Re) output of the lock-in amplifier (Fig. 4A,B, Re), the fusion pore conductance could be calculated from Re and Im (Lollike et al., 1995) (Fig. 4B, Gp trace). Capacitance steps recorded from DKO chromaffin cells expressing WT syb2 and three TMD tryptophan mutations all had amplitudes of ∼200 aF (corresponding to ∼80-nm-diameter vesicles), indicating that these mutations did not alter vesicle size (Fig. 4C). The mutations that reduced PSF amplitude (Fig. 2B, residues 99 and 101) significantly reduced fusion pore conductance by ∼40%, whereas a mutation that failed to alter PSF amplitude (residue 102) had no effect on fusion pore conductance (Fig. 4D). Thus, mutations that reduced catecholamine flux through a fusion pore also reduced its conductance. These results further support the hypothesis that positions 99 and 101 of the syb2 TMD line the fusion pore. Note that these two sites were from the two different pore-lining faces of the putative α-helix, based on amperometry results (Fig. 2C). The lifetimes of fusion pores seen in cell-attached patch capacitance records averaged ∼90 ms for WT syb2 and the three mutants tested (Fig. 4E). This is ∼30-fold longer than typical PSF durations (Fig. 2). The difference between fusion pore lifetimes determined by amperometry and capacitance recording has been discussed previously (Zhang et al., 2010), and suggests that the two methods detect different classes of events. In the present case, it should be noted that the conditions used to trigger fusion were quite different: 105 mm KCl in amperometry and 30 mm KCl, phorbol ester in capacitance.
Discussion
This study has identified four residues in the syb2 TMD that influence passage through exocytotic fusion pores in chromaffin cells. These results implicate those four residues, and thus the syb2 TMD, as a structural component of the fusion pore. This supports a structural model with the syb2 TMD complementing the syx TMD to form a fusion pore that spans and connects the plasma and vesicle membranes (Fig. 5). This proteinaceous view of fusion pores is consistent with the result that membrane bending energy impedes the transition from a nascent fusion pore to an expanding fusion pore (Zhang and Jackson, 2010). However, such a proteinaceous pore would require participation of at least five SNARE complexes (Han et al., 2004; Zhang et al., 2010), and functional studies suggest that exocytosis requires only three SNARE complexes with dense-core vesicles (Mohrmann et al., 2010) and two with synaptic vesicles (Sinha et al., 2011). Estimates of this number in reconstituted liposome fusion vary widely (Jackson 2011), and the reasons for these discrepancies are unclear.
Figure 5.
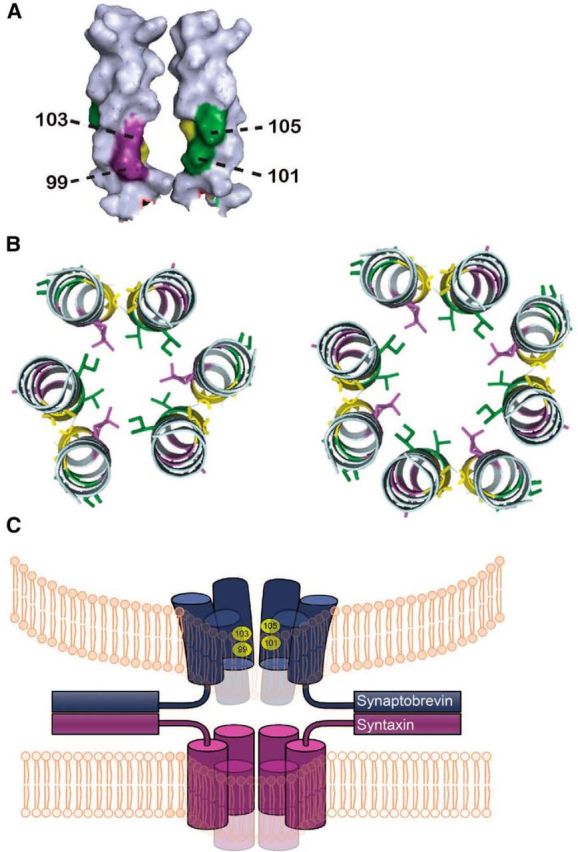
The structural model of syb2 TMDs in a gap junction-like proteinaceous fusion pore. A, Space-filling model of two syb2 TMDs with the pore-lining residues numbered and shaded purple (residues 99 and 103) and green (residues 101 and 105), and the putative dimer interface in yellow (residues 100 and 104; Walters and DeGrado 2006; Mueller et al., 2014). The pore-lining residues of both faces are closer to the N terminus of the TMD (below; generated by Pymol and modified from PDB ID:2KOG). B, Proposed arrangement of six or eight TMDs forming a fusion pore with alternating faces pointing toward the pore lumen (same color code as A). C, Model of the fusion pore formed by the syx and syb2 TMDs. The curved vesicle membrane and flat plasma membrane are presumed to be held together by multiple SNARE complexes (two are shown). The syb2 TMDs are tightly packed near the cytoplasm and spread out toward the vesicle lumen to model the constriction implied by the location of residues influencing PSF amplitude (Fig. 2B).
Although these results support the hypothesis that the syb2 TMD complements the syx TMD of a proteinaceous pore, the distribution of the four syb2 residues differs strikingly from the distribution of the three residues implicated previously by similar experiments in the syx TMD (Han et al., 2004). The three syx residues spanned the entire TMD and fell along a single helical face. By contrast, the four residues of syb2 were clustered in the N terminus within the cytoplasmic half of the TMD, and fell on two distinct helical faces (Figs. 2C, 5A,B). These results indicate fundamentally different structures for the fusion pore through the plasma membrane and vesicle membrane, and introduce an asymmetry between the two fusing membranes. With syx, the involvement of a single helical face implies a structure in which all syx TMDs are equivalent. With syb2, the involvement of two helical faces implies a structure with asymmetric units composed of two nonequivalent syb2 TMDs. Previous analysis indicated that a pore formed by five to eight α-helices would have a conductance in the range observed (Han et al., 2004; Zhang et al., 2010). This same reasoning requires three to four syb2 dimers to form the pore through the vesicle membrane as a complement to the six to eight syx monomers to complete a gap junction-like structure (Fig. 5C).
The alternating pore-lining faces of TMDs proposed here requires two different linker conformations between the TMDs and SNARE motifs in SNARE complexes. Linkers necessarily bend 90° from the perpendicular TMD to the parallel SNARE motif. This makes a break in helical continuity very likely. Such a break will give the linker the flexibility needed so that rotations in some of its 22 backbone bonds could differ to accommodate linkages between different TMD conformations and the SNARE motif. It is also possible that the helix of one conformation extends one or two residues further than the other, so that at the helix–coil break point the linker can still point outward. A coarse-grained simulation of yeast and rat R-soluble SNAREs suggests several substates in the linker region (Durrieu et al., 2009), which could permit twisting in different directions. Finally, it is also possible that the adjacent SNARE complexes surrounding a fusion pore point outward at different angles.
The difference between the syx and syb2 TMDs implied here corresponds well with the much greater tendency of the syb2 TMD to dimerize (Kroch and Fleming 2006). Mutations with bulky side chains at position 100 disrupted syb2 TMD dimerization (Fdez et al., 2010), and arranging our two pore-lining helical faces hexagonally places residue 100 at an interface (Fig. 5A,B, yellow side chains). In a spin-label electron paramagnetic resonance (EPR) study of the yeast syb2 homolog snc2p, six residues in the TMD formed partial tertiary contacts, and four of these fell along one helical face that could represent a dimerization surface (Xu et al., 2005). These four residues of snc2p (100, 103 107, and 111) correspond to positions 104, 107, 111, and 115 in syb2, all of which reside within a TMD contact interface in our structure (Fig. 5A). An EPR study of syb2 TMD dimerization assigned the shortest distances of separation to residues 99 and 103, but since these distances of >15 Å (Tong et al., 2009) are too long for a stabilizing interaction, the actual dimerization interface implied by this study remains unclear. Glycine and other small amino acids separated by two or three residues have been shown to play important roles in TMD dimerization (Walters and DeGrado 2006; Mueller et al., 2014). G100 and A104 in the syb2 TMD represent a potential dimerization motif, but our replacement of these residues with tryptophan did not slow the kinetics of fusion significantly. It remains unclear why establishing a functional relation between syb2 TMD dimerization and exocytosis has proven so difficult (Fdez et al., 2010). These parallels with structural work suggest that the syb2 TMD mutations studied here did not produce major conformational rearrangements. Furthermore, the α-angle (between the lipid-facing helical surface and Cα of the first residue in the α-helix) was predicted by HTMSRAP (Dastmalchi et al., 2007) to induce changes that were small for most of the mutations [0.11∼44.07° except V101D (132.96°)], and much smaller than the angle between adjacent side chains (100° = 360°/3.6). Thus, the fusion pore structure we propose should tolerate the TMD rotations that one might anticipate from these mutations.
In contrast to syx, the TMD of syb2 shows a striking difference in the roles of the N- and C-terminal domains. Not a single tryptophan substitution from residue 107 to residue 116 altered the PSF amplitude (Fig. 2B), and four tryptophans in the C terminus also had no effect (Fig. 3G). Indeed, among the positions where tryptophan reduced the PSF amplitude, the magnitude of the reduction declined toward the C terminus (Fig. 2B). Eighteen of 22 tryptophan mutations reduced the PSF duration (Fig. 2D), and, instead of clustering in the N terminus, these mutations were distributed throughout the TMD without a clear pattern. Tryptophan mutations influenced PSF amplitude and duration differently, suggesting these two fusion pore characteristics have different structural determinants. EPR experiments (Tong et al., 2009) indicate that syb2 TMD dimers can adopt two conformations, one of which splays from the N to the C terminus, with the closest contacts in the N-terminal region as implied here (Fig. 5C). Spectroscopic studies of the syb2 TMD indicated that this domain tilts within a lipid bilayer (Bowen and Brunger 2006). Tilting would require other molecules to fill the gaps between TMDs; either phospholipids (Fang et al., 2008) or other membrane proteins could occupy this space. Such a structure would place C-terminal residues in a more hydrophobic environment, where substitution with residues of differing polarity could accelerate or slow fusion (Ngatchou et al., 2010). Theoretical studies of SNARE-mediated fusion suggest tilting (Jackson 2010; Risselada et al., 2011) or outward translocation (Lindau et al., 2012) of the TMDs during fusion. Molecular dynamics simulations suggest that the linker and TMD N terminus tilt in the lipid bilayer and that the C terminus is flexible with a pivot at residue G100 (Blanchard et al., 2014). Our results suggest that the fusion pore contains a constriction from residues 99–105, which contains the putative G100 kink (Fig. 5C). The structural difference between the N and C termini along with the TMD bending during a kinetic transition may be a decisive feature in exocytosis: the 10–70% rising slope of cumulative event plots changed mostly with mutations in the N-terminal TMD, with an especially large change at residue 102 (Fig. 1D). Interestingly the residues in the syb2 TMD closely contacting the syx TMD in the crystal structure of the cis–SNARE complex also reside in the N terminus (residues 95, 98, 99, 102, and 106; Stein et al., 2009), and tryptophan mutations at or next to these residues (positions 97, 98, 102, 103, and 105) significantly increased the slope of cumulative event plots. These results may indicate that the N termini of the syb2 and syx TMDs interact during fusion pore expansion in a zipper-like association toward the C termini.
The role of the SNARE TMDs in exocytosis received more attention recently as a result of reports (Zhou et al., 2013) that lipid-anchored SNAREs lacking TMDs rescue synaptic release in cultured neurons. However, evoked and spontaneous release in these neurons was far weaker than that seen in other studies of rescue in syb2-null neurons (Schoch et al., 2001; Guzman et al., 2010). We have tested four different lipid-anchored syb2 constructs in DKO chromaffin cells and saw much less rescue of release compared with WT syb2 (our unpublished data).
The present report has provided an important new test for the hypothesis of a proteinaceous fusion pore intermediate during Ca2+-triggered exocytosis. We have identified syb2 TMD residues that interact sterically and electrostatically with catecholamine as it permeates fusion pores. TMD residues also influenced pore conductance. These syb2 residues satisfy the criteria for an involvement in pore permeation by analogy with studies of ion channels (Ashcroft 1999). This is the most parsimonious interpretation for the current results, but alterations in fusion pore flux as a result of subtle conformational changes, changes in relative position, or changes in orientation propagating from the TMD to the fusion pore cannot be rigorously excluded. The striking differences between the distribution of pore residues in the syb2 versus syx TMDs indicate a greater structural complexity of the pore in the vesicle membrane. The syb2 TMDs serve as the structural partners of syx TMDs, but, unlike syx with only one helical pore-lining face, syb2 TMDs have alternating pore-lining faces and a constriction in the N terminus. These differences between the structural roles of syb2 and syx TMDs in fusion pores may enable these motifs to form fusion pores more readily, or to facilitate coupling to the Ca2+ trigger, or to lower the energy barrier during dilation in the transition of a fusion pore from protein to lipid.
Footnotes
This work was supported by National Institutes of Health Grant NS44057. E.R.C. is an investigator of the Howard Hughes Medical Institute. We thank Alessandro Senes and Chung-Wei Chiang for comments on the manuscript; and Xuelin Lou for use of his microscope for targeting studies.
References
- Ashcroft FM. Ion channels and disease. San Diego: Academic; 1999. [Google Scholar]
- Blanchard AE, Arcario MJ, Schulten K, Tajkhorshid E. A highly tilted membrane configuration for the prefusion state of synaptobrevin. Biophys J. 2014;107:2112–2121. doi: 10.1016/j.bpj.2014.09.013. [DOI] [PMC free article] [PubMed] [Google Scholar]
- Borisovska M, Zhao Y, Tsytsyura Y, Glyvuk N, Takamori S, Matti U, Rettig J, Südhof T, Bruns D. v-SNAREs control exocytosis of vesicles from priming to fusion. EMBO J. 2005;24:2114–2126. doi: 10.1038/sj.emboj.7600696. [DOI] [PMC free article] [PubMed] [Google Scholar]
- Bowen M, Brunger AT. Conformation of the synaptobrevin transmembrane domain. Proc Natl Acad Sci U S A. 2006;103:8378–8383. doi: 10.1073/pnas.0602644103. [DOI] [PMC free article] [PubMed] [Google Scholar]
- Chernomordik LV, Kozlov MM. Mechanics of membrane fusion. Nat Struct Mol Biol. 2008;15:675–683. doi: 10.1038/nsmb.1455. [DOI] [PMC free article] [PubMed] [Google Scholar]
- Chow RH, von Rüden L. Electrochemical detection of secretion from single cells. In: Sakmann B, Neher E, editors. Single-channel recording. New York: Plenum; 1995. pp. 245–275. [Google Scholar]
- Chow RH, von Rüden L, Neher E. Delay in vesicle fusion revealed by electrochemical monitoring of single secretory events in adrenal chromaffin cells. Nature. 1992;356:60–63. doi: 10.1038/356060a0. [DOI] [PubMed] [Google Scholar]
- Cohen FS, Melikyan GB. The energetics of membrane fusion from binding, through hemifusion, pore formation, and pore enlargement. J Membr Biol. 2004;199:1–14. doi: 10.1007/s00232-004-0669-8. [DOI] [PubMed] [Google Scholar]
- Colliver TL, Hess EJ, Pothos EN, Sulzer D, Ewing AG. Quantitative and statistical analysis of the shape of amperometric spikes recorded from two populations of cells. J Neurochem. 2000;74:1086–1097. doi: 10.1046/j.1471-4159.2000.741086.x. [DOI] [PubMed] [Google Scholar]
- Dastmalchi S, Beheshti S, Morris MB, Church WB. Prediction of rotational orientation of transmembrane helical segments of integral membrane proteins using new environment-based propensities for amino acids derived from structural analyses. FEBS J. 2007;274:2653–2660. doi: 10.1111/j.1742-4658.2007.05800.x. [DOI] [PubMed] [Google Scholar]
- Dong M, Yeh F, Tepp WH, Dean C, Johnson EA, Janz R, Chapman ER. SV2 is the protein receptor for botulinum neurotoxin A. Science. 2006;312:592–596. doi: 10.1126/science.1123654. [DOI] [PubMed] [Google Scholar]
- Durrieu MP, Bond PJ, Sansom MS, Lavery R, Baaden M. Coarse-grain simulations of the R-SNARE fusion protein in its membrane environment detect long-lived conformational sub-states. Chemphyschem. 2009;10:1548–1552. doi: 10.1002/cphc.200900216. [DOI] [PubMed] [Google Scholar]
- Fang Q, Berberian K, Gong LW, Hafez I, Sørensen JB, Lindau M. The role of the C terminus of the SNARE protein SNAP-25 in fusion pore opening and a model for fusion pore mechanics. Proc Natl Acad Sci U S A. 2008;105:15388–15392. doi: 10.1073/pnas.0805377105. [DOI] [PMC free article] [PubMed] [Google Scholar]
- Fdez E, Martínez-Salvador M, Beard M, Woodman P, Hilfiker S. Transmembrane-domain determinants for SNARE-mediated membrane fusion. J Cell Sci. 2010;123:2473–2480. doi: 10.1242/jcs.061325. [DOI] [PubMed] [Google Scholar]
- Grote E, Baba M, Ohsumi Y, Novick PJ. Geranylgeranylated SNAREs are dominant inhibitors of membrane fusion. J Cell Biol. 2000;151:453–466. doi: 10.1083/jcb.151.2.453. [DOI] [PMC free article] [PubMed] [Google Scholar]
- Guzman RE, Schwarz YN, Rettig J, Bruns D. SNARE force synchronizes synaptic vesicle fusion and controls the kinetics of quantal synaptic transmission. J Neurosci. 2010;30:10272–10281. doi: 10.1523/JNEUROSCI.1551-10.2010. [DOI] [PMC free article] [PubMed] [Google Scholar]
- Han X, Jackson MB. Electrostatic interactions between the syntaxin membrane anchor and neurotransmitter passing through the fusion pore. Biophys J. 2005;88:L20–L22. doi: 10.1529/biophysj.104.056739. [DOI] [PMC free article] [PubMed] [Google Scholar]
- Han X, Wang CT, Bai J, Chapman ER, Jackson MB. Transmembrane segments of syntaxin line the fusion pore of Ca2+-triggered exocytosis. Science. 2004;304:289–292. doi: 10.1126/science.1095801. [DOI] [PubMed] [Google Scholar]
- Jackson MB. SNARE complex zipping as a driving force in the dilation of proteinaceous fusion pores. J Membr Biol. 2010;235:89–100. doi: 10.1007/s00232-010-9258-1. [DOI] [PMC free article] [PubMed] [Google Scholar]
- Jackson MB. Inferring structures of kinetic intermediates in Ca(2+)-triggered exocytosis. Curr Top Membr. 2011;68:185–208. doi: 10.1016/B978-0-12-385891-7.00008-8. [DOI] [PubMed] [Google Scholar]
- Jahn R, Fasshauer D. Molecular machines governing exocytosis of synaptic vesicles. Nature. 2012;490:201–207. doi: 10.1038/nature11320. [DOI] [PMC free article] [PubMed] [Google Scholar]
- Jankowski JA, Schroeder TJ, Ciolkowski EL, Wightman RM. Temporal characteristics of quantal secretion of catecholamines from adrenal medullary cells. J Biol Chem. 1993;268:14694–14700. [PubMed] [Google Scholar]
- Klyachko V, Zhang Z, Jackson MB. Low-noise recording of single-vesicle capacitance steps in cell-attached patches. In: Ivanov A, editor. Methods in molecular biology: exocytosis and endocytosis. Totowa, NJ: Humana; 2008. pp. 275–287. [DOI] [PubMed] [Google Scholar]
- Kroch AE, Fleming KG. Alternate interfaces may mediate homomeric and heteromeric assembly in the transmembrane domains of SNARE proteins. J Mol Biol. 2006;357:184–194. doi: 10.1016/j.jmb.2005.12.060. [DOI] [PubMed] [Google Scholar]
- Langosch D, Hofmann M, Ungermann C. The role of transmembrane domains in membrane fusion. Cell Mol Life Sci. 2007;64:850–864. doi: 10.1007/s00018-007-6439-x. [DOI] [PMC free article] [PubMed] [Google Scholar]
- Lindau M, Almers W. Structure and function of fusion pores in exocytosis and ectoplasmic membrane fusion. Curr Opin Cell Biol. 1995;7:509–517. doi: 10.1016/0955-0674(95)80007-7. [DOI] [PubMed] [Google Scholar]
- Lindau M, Hall BA, Chetwynd A, Beckstein O, Sansom MS. Coarse-grain simulations reveal movement of the synaptobrevin C-terminus in response to piconewton forces. Biophys J. 2012;103:959–969. doi: 10.1016/j.bpj.2012.08.007. [DOI] [PMC free article] [PubMed] [Google Scholar]
- Lollike K, Borregaard N, Lindau M. The exocytotic fusion pore of small granules has a conductance similar to an ion channel. J Cell Biol. 1995;129:99–104. doi: 10.1083/jcb.129.1.99. [DOI] [PMC free article] [PubMed] [Google Scholar]
- McNew JA, Weber T, Parlati F, Johnston RJ, Melia TJ, Söllner TH, Rothman JE. Close is not enough: SNARE-dependent membrane fusion requires an active mechanism that transduces force to membrane anchors. J Cell Biol. 2000;150:105–117. doi: 10.1083/jcb.150.1.105. [DOI] [PMC free article] [PubMed] [Google Scholar]
- Mohrmann R, de Wit H, Verhage M, Neher E, Sørensen JB. Fast vesicle fusion in living cells requires at least three SNARE complexes. Science. 2010;330:502–505. doi: 10.1126/science.1193134. [DOI] [PubMed] [Google Scholar]
- Mueller BK, Subramaniam S, Senes A. A frequent, GxxxG-mediated, transmembrane association motif is optimized for the formation of interhelical Calpha-H hydrogen bonds. Proc Natl Acad Sci U S A. 2014;111:E888–E895. doi: 10.1073/pnas.1319944111. [DOI] [PMC free article] [PubMed] [Google Scholar]
- Ngatchou AN, Kisler K, Fang Q, Walter AM, Zhao Y, Bruns D, Sørensen JB, Lindau M. Role of the synaptobrevin C terminus in fusion pore formation. Proc Natl Acad Sci U S A. 2010;107:18463–18468. doi: 10.1073/pnas.1006727107. [DOI] [PMC free article] [PubMed] [Google Scholar]
- Risselada HJ, Kutzner C, Grubmüller H. Caught in the act: visualization of SNARE-mediated fusion events in molecular detail. Chembiochem. 2011;12:1049–1055. doi: 10.1002/cbic.201100020. [DOI] [PubMed] [Google Scholar]
- Schoch S, Deák F, Königstorfer A, Mozhayeva M, Sara Y, Südhof TC, Kavalali ET. SNARE function analyzed in synaptobrevin/VAMP knockout mice. Science. 2001;294:1117–1122. doi: 10.1126/science.1064335. [DOI] [PubMed] [Google Scholar]
- Shi L, Shen QT, Kiel A, Wang J, Wang HW, Melia TJ, Rothman JE, Pincet F. SNARE proteins: one to fuse and three to keep the nascent fusion pore open. Science. 2012;335:1355–1359. doi: 10.1126/science.1214984. [DOI] [PMC free article] [PubMed] [Google Scholar]
- Sinha R, Ahmed S, Jahn R, Klingauf J. Two synaptobrevin molecules are sufficient for vesicle fusion in central nervous system synapses. Proc Natl Acad Sci U S A. 2011;108:14318–14323. doi: 10.1073/pnas.1101818108. [DOI] [PMC free article] [PubMed] [Google Scholar]
- Stein A, Weber G, Wahl MC, Jahn R. Helical extension of the neuronal SNARE complex into the membrane. Nature. 2009;460:525–528. doi: 10.1038/nature08156. [DOI] [PMC free article] [PubMed] [Google Scholar]
- Südhof TC, Rothman JE. Membrane fusion: grappling with SNARE and SM proteins. Science. 2009;323:474–477. doi: 10.1126/science.1161748. [DOI] [PMC free article] [PubMed] [Google Scholar]
- Sutton RB, Fasshauer D, Jahn R, Brunger AT. Crystal structure of a SNARE complex involved in synaptic exocytosis at 2.4 Å resolution. Nature. 1998;395:347–353. doi: 10.1038/26412. [DOI] [PubMed] [Google Scholar]
- Tong J, Borbat PP, Freed JH, Shin YK. A scissors mechanism for stimulation of SNARE-mediated lipid mixing by cholesterol. Proc Natl Acad Sci U S A. 2009;106:5141–5146. doi: 10.1073/pnas.0813138106. [DOI] [PMC free article] [PubMed] [Google Scholar]
- Walters RF, DeGrado WF. Helix-packing motifs in membrane proteins. Proc Natl Acad Sci U S A. 2006;103:13658–13663. doi: 10.1073/pnas.0605878103. [DOI] [PMC free article] [PubMed] [Google Scholar]
- Wang CT, Grishanin R, Earles CA, Chang PY, Martin TF, Chapman ER, Jackson MB. Synaptotagmin modulation of fusion pore kinetics in regulated exocytosis of dense-core vesicles. Science. 2001;294:1111–1115. doi: 10.1126/science.1064002. [DOI] [PubMed] [Google Scholar]
- Wang CT, Bai J, Chang PY, Chapman ER, Jackson MB. Synaptotagmin-Ca2+ triggers two sequential steps in regulated exocytosis in rat PC12 cells: fusion pore opening and fusion pore dilation. J Physiol. 2006;570:295–307. doi: 10.1113/jphysiol.2005.097378. [DOI] [PMC free article] [PubMed] [Google Scholar]
- Xu Y, Zhang F, Su Z, McNew JA, Shin YK. Hemifusion in SNARE-mediated membrane fusion. Nat Struct Mol Biol. 2005;12:417–422. doi: 10.1038/nsmb921. [DOI] [PubMed] [Google Scholar]
- Zhang Z, Jackson MB. Membrane bending energy and fusion pore kinetics in Ca(2+)-triggered exocytosis. Biophys J. 2010;98:2524–2534. doi: 10.1016/j.bpj.2010.02.043. [DOI] [PMC free article] [PubMed] [Google Scholar]
- Zhang Z, Zhang Z, Jackson MB. Synaptotagmin IV modulation of vesicle size and fusion pores in PC12 cells. Biophys J. 2010;98:968–978. doi: 10.1016/j.bpj.2009.11.024. [DOI] [PMC free article] [PubMed] [Google Scholar]
- Zhou P, Bacaj T, Yang X, Pang ZP, Südhof TC. Lipid-anchored SNAREs lacking transmembrane regions fully support membrane fusion during neurotransmitter release. Neuron. 2013;80:470–483. doi: 10.1016/j.neuron.2013.09.010. [DOI] [PMC free article] [PubMed] [Google Scholar]