

Abstract
Synapses of the mammalian CNS are diverse in size, structure, molecular composition, and function. Synapses in their myriad variations are fundamental to neural circuit development, homeostasis, plasticity, and memory storage. Unfortunately, quantitative analysis and mapping of the brain's heterogeneous synapse populations has been limited by the lack of adequate single-synapse measurement methods. Electron microscopy (EM) is the definitive means to recognize and measure individual synaptic contacts, but EM has only limited abilities to measure the molecular composition of synapses. This report describes conjugate array tomography (AT), a volumetric imaging method that integrates immunofluorescence and EM imaging modalities in voxel-conjugate fashion. We illustrate the use of conjugate AT to advance the proteometric measurement of EM-validated single-synapse analysis in a study of mouse cortex.
Keywords: correlative microscopy, electron microscopy, immunofluorescence, synapses, synaptic diversity
Introduction
Synapses in the mammalian brain are composed of hundreds of protein species, and are highly diverse in size, structure, molecular composition, and function (Emes and Grant, 2012; O'Rourke et al., 2012). Because they are so complex, diverse, and intermingled, single-synapse resolution is needed to answer outstanding questions about synapse populations. Unfortunately, most methods are limited in their capacities for structural, molecular, and functional analysis of individual synapses.
Fluorescence microscopy of single proteins has played a key role in elucidating basic synapse biology, but is not reliable for identifying individual synapses, because synaptic proteins are present at nonsynaptic locations (Sobkowicz et al., 1986; Ahmari et al., 2000; Chung et al., 2013). Reliable discrimination of a synapse requires at least the use of multiple markers to establish colocalization of presynaptic and postsynaptic proteins. Electron microscopy of synaptic ultrastructure remains the definitive criterion (Mishchenko et al., 2010), but has limited ability to measure the molecular composition of synapses and is thus blind to a major aspect of synaptic architecture.
Array tomography (AT) involves reconstruction of images acquired from arrays of serial ultrathin sections, which can be imaged by immunofluorescence (IF-AT), scanning electron microscopy (SEM-AT), or other modalities. IF-AT provides rich molecular information and enables surveys of large synapse populations, whereas SEM-AT offers ultrastructure-based synapse recognition (Micheva and Smith, 2007; Micheva et al., 2010; Oberti et al., 2011; Horstmann et al., 2012; Reichelt et al., 2012; Tapia et al., 2012). Unfortunately, conflicting requirements for preservation of immunoreactivity and ultrastructure severely limit attempts to combine IF-AT and SEM-AT on the same specimens (Micheva et al., 2010; Oberti et al., 2011).
AT requires that the tissue be mechanically stabilized in plastic resin for ultrathin sectioning. Before resin embedment, the sample must be dehydrated with an organic solvent. Dehydration at room temperature impairs ultrastructure, because organic solvents dissolve cell constituents, especially lipid membranes. To circumvent this problem, histologists routinely postfix with osmium tetroxide to stabilize the lipids before dehydration. Unfortunately, osmium also disrupts the tertiary structure of most proteins, preventing their detection with antibodies (Nielson and Griffith, 1979; Emerman and Behrman, 1982). Alternatively, tissue can be dehydrated at low temperatures (<−70°C), where lipids do not dissolve (Kellenberger, 1987); this requires a resin that polymerizes at low temperatures, because warming tissue without strong postfixation would again disrupt lipids. One such resin, Lowicryl HM-20, exhibits good mechanical properties, provides excellent contrast in the electron beam, and retains antigenicity better than Epon (Newman and Hobot, 1993).
We here introduce the technique of conjugate AT. We show that cryoembedding provides markedly improved ultrastructure while still permitting multiplexed immunohistochemistry. Conjugate AT is part of a broad class of “correlative” methods that integrate light and EM imaging of the same or similar specimens (Polishchuk and Mironov, 2001; Grabenbauer et al., 2005; Knott et al., 2006; van Rijnsoever et al., 2008; Shu et al., 2011; Fabig et al., 2012; Lucas et al., 2012). We use the term “conjugate” to distinguish the special case where light and electron micrographs from a single specimen are coregistered with voxel-to-voxel accuracy. The word conjugate is borrowed both from geometric optics (denoting point-to-point correspondence between image planes) and chemistry (denoting attachment of a molecular tag). By integrating the strengths of multiplexed immunofluorescence microscopy with those of serial-section electron microscopy, conjugate AT advances the state of art for single-synapse identification. It should also facilitate structural and molecular analysis of other subcellular structures and tissues (Anderson et al., 2011; Morgan and Lichtman, 2013).
Materials and Methods
Lowicryl freeze-substitution tissue preparation.
All animal procedures were performed according to NIH and University of North Carolina guidelines. After deep anesthesia with pentobarbital, adult male mice were perfusion-fixed with a mixture of 2% glutaraldehyde/2% depolymerized formaldehyde, dissolved in 0.1 m phosphate buffer, pH 6.8. Brains were removed, postfixed overnight at 4°C in the same fixative, and then stored in phosphate buffer. Vibratome sections (200 μm thick) were collected, incubated on ice on a shaker with 0.1% CaCl2 in 0.1 m sodium acetate for 1 h, then cryoprotected through 10 and 20% glycerol, and then overnight in 30% glycerol in sodium acetate solution. The next day, small tissue chunks from S1 neocortex were cut under a dissecting microscope and quick-frozen in a dry ice/ethanol bath. Freeze-substitution was then performed using a Leica AFS instrument with several rinses in cold methanol followed by substitution in a 2–4% solution of uranyl acetate in methanol, all at −90°C. Uranyl acetate helps to stabilize lipids and other tissue elements, without major impact on the tertiary structure of proteins (Terzakis, 1968; Berryman and Rodewald, 1990; Phend et al., 1995). After 30 h incubation, the solution was slowly warmed to −45°C and infiltrated with Lowicryl HM-20 over 2 d. Capsules containing tissue chunks were then exposed to UV during gradual warming to 0°C. Polymerized capsules were removed from the AFS apparatus and further exposed to UV at room temperature for an additional day to complete curing of the plastic.
Other tissue preparation.
The Epon-embedded, osmium-treated samples shown in Figure 1a were prepared as previously described (Tapia et al., 2012). Briefly, 300 μm slices from a glutaraldehyde-perfused male mouse brain were processed and en bloc stained using an osmium bridging technique (Seligman et al., 1966). LR White-embedded, osmium-free samples shown in Figure 1c were prepared using methods described by Micheva and Smith (2007). Briefly, after deep anesthesia with isoflurane, adult male mouse brains were immersion-fixed with 4% formaldehyde (dissolved in 0.01 m phosphate buffer with 2.5% sucrose, pH 7.4), dehydrated in an ethanol series, and infiltrated with LR White resin overnight at 4°C. Tissue blocks were polymerized overnight in an oven at 52°C. For the LR White-embedded light osmium-treated tissue shown in Figure 1b, fresh male mouse brain tissue was immersion-fixed in 4% formaldehyde and 0.1% glutaraldehyde in PB containing 2.5% sucrose. After washes in phosphate buffer containing 3.5% sucrose and 50 mm glycine, the tissue was postfixed in 0.1% OsO4 and 1.5% potassium ferricyanide in PB using microwave irradiation (Ted Pella; 1 min on- 1 min off-1 min on at 100 W) and then for an additional 30 min at room temperature. The tissue was dehydrated and embedded following a standard protocol for embedding in LR White resin.
Figure 1.

Tradeoff between ultrastructural integrity and immunoreactivity. Four different tissue preparation methods were compared using three different imaging modalities. a, Glutaraldehyde fixation, poststained with 2% OsO4 and embedded in Epon resin. b, Formaldehyde fixation, poststained with 0.1% OsO4 and embedded in LR White. c, Formaldehyde fixation, embedded in LR White without osmium. d, Lowicryl method presented here. Images from layer 5 of mouse neocortex were acquired with TEM (i), SEM (ii), or epifluorescence after immunostaining for VGluT1 (iii) and synapsin (iv). All IF was performed under identical conditions, constant exposure, and color map, except for the panels marked enhanced (enh.; aiii, biii) where the maximally bright value was halved, and color images in v, where channels were renormalized to 99.5% percentile. Osmium-free low-temperature embedding in Lowicryl achieved both excellent ultrastructural preservation and immunoreactivity, unlike the other methods. e, f, Larger SEM field and a volumetric rendering of an AT-IF dataset obtained from the same Lowicryl-embedded tissue block. IF scale bars,10 μm; EM scale bars, 500 nm.
Ribbons were prepared and imaged using standard methods of array tomography (Micheva and Smith, 2007). Seventy-nanometer-thick serial sections of the embedded plastic block were cut on an ultramicrotome (Leica Ultracut EM UC6) and mounted on a carbon-coated coverslip. Some coverslips were prepared using a gelatin coating (Micheva and Smith, 2007) and others were purchased with a silane pretreatment (Aratome), and then coated with carbon as before. Gelatin-coated coverslips sometimes exhibited beam damage in the SEM, manifested as a characteristic honeycomb pattern of electron density. To investigate the basis of this beam damage, we imaged samples that displayed beam damage using secondary electrons stimulated via a lower energy beam (1–2 keV). The low-energy electrons (which do not fully penetrate the sample) revealed no evidence of honeycomb pattern, suggesting that the gelatin itself was the source of the pattern; furthermore, samples mounted on silanized coverslips never showed this pattern of beam-induced damage.
Immunofluorescence AT.
Sections were processed for standard indirect immunofluorescence and imaged on an automated epi-fluorescent microscope (Zeiss AxioImager Z1) using a 63× Plan-Apochromat 1.4 NA oil objective. The sources and dilutions of all antibodies used in this study are shown in Table 1. Slight differences from previous AT-IF methodologies included a single application of sodium borohydride (1% in TRIS for 3 min) to reduce nonspecific staining and autofluorescence (Craig, 1974). After immunoprocessing and image acquisition, staining was eluted and sections reprobed with a new set of antibodies. The order of those antibodies for the multiround IF datasets are specified in Table 2.
Table 1.
List of antibodies, sources, and dilutions used in this study
| Antigen | Host | Antibody source | Dilution |
|---|---|---|---|
| Synapsin 1 | Rabbit | Cell Signaling Technology 5297S | 1:200 |
| Synaptophysin | Mouse | Abcam ab8049 | 1:15 |
| VGluT1 | Guinea pig | Millipore AB5905 | 1:5000 |
| PSD-95 | Rabbit | Cell Signaling Technology 3450S | 1:200 |
| GluN1 | Mouse | Millipore MAB363 | 1:200 |
| GABA | Guinea pig | Millipore AB175 | 1:10000 |
| GAD2 | Rabbit | Cell Signaling Technology 5843 | 1:200 |
| Gephyrin | Mouse | Biosciences Pharmingen 612632 | 1:100 |
| α-Tubulin | Rabbit | Abcam ab18251 | 1:100 |
| Acetylated α-tubulin | Mouse | Sigma-Aldrich T6793 | 1:100 |
| βIII-tubulin | Chicken | Abcam 41489 | 1:200 |
| γ-Actin | Mouse | Sigma-Aldrich A8481 | 1:100 |
| Glutamine synthetase | Mouse | BD Biosciences 610517 | 1:25 |
| Prohibitin | Rabbit | Abcam ab28172 | 1:100 |
| GFP | Chicken | GeneTex GTX13970 | 1:100 |
| MBP | Chicken | AVES MBP | 1:100 |
Table 2.
Sequence of antibody application during multiple rounds of immunofluorescence labeling
| Experiment | Staining round | Primary antibodies | Secondary antibodies |
|---|---|---|---|
| KDM-SYN-120905; Figs. 10d,e,g,h; 11, 12 | 1st | PSD-95 (rabbit) | Alexa 488 |
| Gephyrin (mouse) | Alexa 594 | ||
| VGluT1 (guinea pig) | Alexa 647 | ||
| 2nd | βIII-tubulin (chicken) | Alexa 488 | |
| GluN1 (mouse) | Alexa 594 | ||
| GAD2 (rabbit) | Alexa 647 | ||
| 3rd | Synapsin (rabbit) | Alexa 488 | |
| GABA (guinea pig) | Alexa 647 | ||
| VGAT (mouse) | Alexa 594 | ||
| KDM-SYN-140115; Figs. 5, 7, 8, 9, 10a–c,f | 1st | Gephyrin (mouse) | Alexa 488 |
| PSD-95 (rabbit) | Alexa 594 | ||
| VGluT1 (guinea pig) | Alexa 647 | ||
| 2nd | Myelin basic protein (chicken) | Alexa 488 | |
| GluN1 (mouse) | Alexa 594 | ||
| GAD2 (rabbit) | Alexa 647 | ||
| 3rd | GABA (guinea pig) | Alexa 488 | |
| Glutamine synthetase (mouse) | Alexa 594 | ||
| Synapsin (guinea pig) | Alexa 647 |
Contrast was reduced in electron micrographs from samples that had undergone immunostaining and IF microscopy, compared with adjacent sections that were immediately poststained for EM. To determine the basis of this effect, we investigated each component of the immunostaining protocol. Samples that were stained only once (without elution) exhibited an irregular haze, somewhat obscuring the underlying ultrastructure. This haze presumably reflected heavy metal staining of the remaining antibodies, because it was no longer seen after elution. In addition, prolonged exposure to solutions containing Tween detergent or pretreatment with sodium borohydride led to minor degradation of contrast. However, the main source of contrast reduction was from exposure to the pH 13.3 elution solution (see Fig. 6). We found that lowering the pH of the elution solution to 12.3 modestly improved the contrast achieved after poststaining, while remaining effective for eluting antibodies, but further reduction in pH markedly reduced the efficacy of elution. Based on these findings, we used a pH 12.3 elution solution (NaOH 20 vs 200 mm) on much of our material. We also omitted Tween from staining solutions in some experiments. Several rounds of elution and restaining were applied to create a high-dimensional immunofluorescent image. Images from different imaging sessions were registered using a DAPI stain present in the mounting medium. IF images were postprocessed using a Richardson-Lucy deconvolution with empirically measured point spread functions as described previously (Wang and Smith, 2012).
Figure 6.
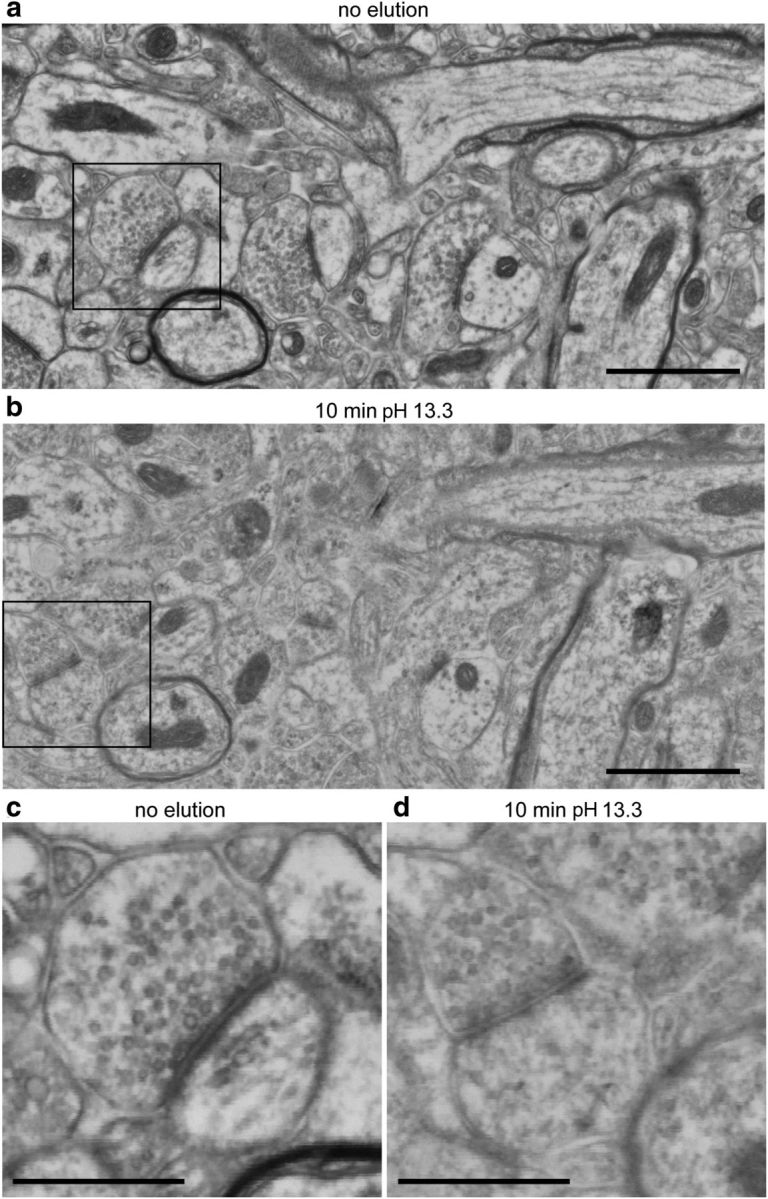
Effects of elution on poststain contrast. a, A representative SEM image from a section that was poststained with KMnO4, UA and Pb, without previous exposure to any buffers other than TRIS and distilled water. Scale bar, 1 μm. b, An SEM image from the same region of a nearby section from the same sample, which was first exposed to 10 min of pH 13.3 elution solution before being washed with TRIS and distilled water, then poststained with KMnO4, UA, and Pb. Scale bar, 1 μm. c, Enlargement of the region outlined by the black box in a. Scale bar, 500 nm. d, An enlargement of the region outlined by the black box in b. Scale bar, 500 nm. Both sections were simultaneously poststained on the same coverslip, and a PAP pen was used to restrict elution solution. The gain of the backscatter detector, dwell times, resolution, brightness, and contrast settings of the SEM were kept constant between the two image acquisitions. The grayscale color map used to display the images is also the same. Therefore, the lighter character of the image in b, d compared with a, c can thus be interpreted as a reduction in the contrast of detected back scattered electrons.
TEM.
Ultrathin sections from samples shown in Figure 1 were mounted on Formvar-coated 3 mm slot grids (Electron Microscopy Sciences). Sections were poststained with 5% aqueous uranyl acetate for 30 min in the dark, washed with water, then poststained with 1% Reynolds' lead citrate for 1 min, washed, and air dried. Sections were imaged at 80 KeV on a JEM-1400 TEM (JEOL). Images were captured with a Gatan Orius CCD camera at 10,000× magnification (0.64 nm/pixel).
Field emission electron scanning microscopy.
After IF imaging, the Lowicryl ribbons were rinsed with water. Some samples were poststained for 1 min with 0.1% KMnO4 dissolved in 0.1N H2SO4; this solution was freshly made and spun down immediately before use. Samples were poststained with either 5% aqueous or methanolic uranyl acetate (UA) for 30 min, washed with water, then poststained with freshly prepared and filtered 1% Reynolds' lead citrate for 1 min, washed, and air dried. The coverslips were attached to 50 mm pin mounts (Ted Pella) using carbon paint.
Ribbons were imaged on a Zeiss Sigma FESEM microscope using the backscatter detector at 5–8 keV. SEM images were collected at a range of magnifications (830–2.23 nm/pixel) and scan speeds (12.9–56.6 μs/pixel) depending on the desired field-of-view and level of signal-to-noise. The highest magnification images (Figs. 1, 2, 7, and 9) were collected at 2.23 nm/pixel and 25.7 μs/pixel.
Figure 2.

Large high-resolution SEM fields from Lowicryl-embedded tissue. a, Field from which the synapse in Figure 1dii was taken (after rotation and cropping). b, Microtubules are visible in two tangentially sectioned dendrites. Scale bars, 500 nm. These images are from freshly cut sections, which did not undergo immunostaining or elution. Sections were mounted on silanized coverslips, and poststained with KMnO4, uranyl acetate, and lead.
Figure 7.
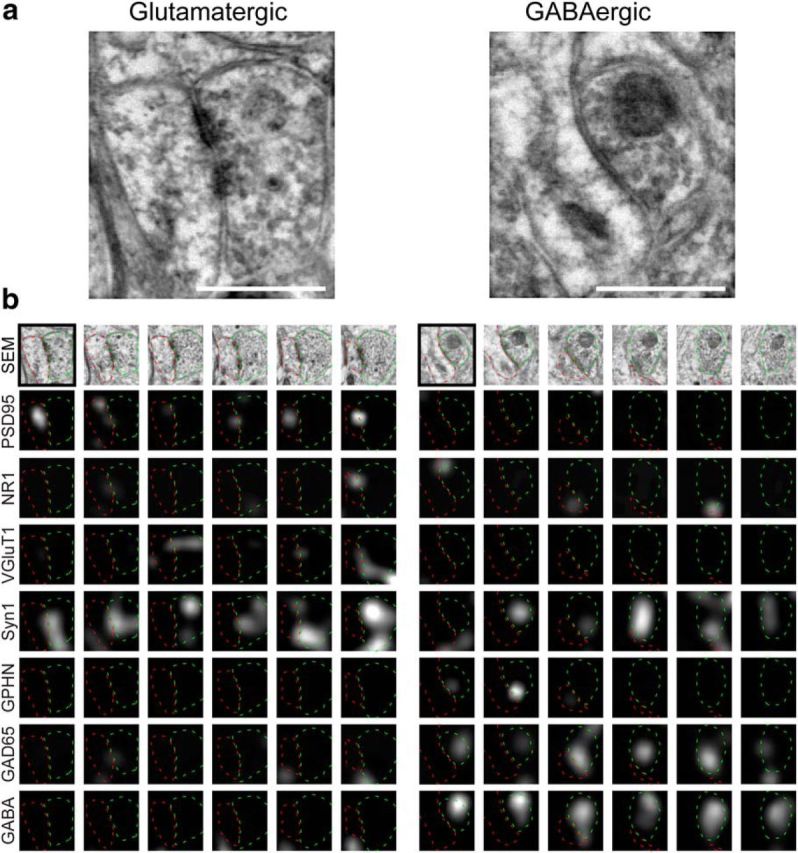
Serial-section reconstruction of the molecular organization of synapses. a, SEM images showing a glutamatergic and a GABAergic synapse (middle row). b, Synaptogram representations of the same synapses, with the corresponding IF data. Each column represents images from consecutive serial sections, and each row shows a different channel. The sections shown in a are outlined in black. The presynaptic bouton (green) and postsynaptic compartment (red) are outlined. Left, The presynaptic side of an excitatory synapse contains IF for VGluT1 and synapsin-1, with postsynaptic PSD-95 and NR1; no evidence for GABA is visible in either the presynaptic or postsynaptic compartment. Right, An inhibitory synapse contains clear presynaptic IF for GABA, GAD-65, and synapsin-1, with signal for gephyrin (GPHN) but not PSD-95. Scale bars, 1 μm.
Figure 9.

Quantitative assessment of IF-based discrimination of synapses. a, A single section shows PSD-95 IF, segmented into puncta (green outlines). b, Conjugate SEM data overlaid with puncta and EM-identified synapses from putatively glutamatergic axons (red). Puncta that do not overlap with a synapse are outlined in black. c, 3D diagram shows the section of a in green, with adjacent sections in gray. 2D puncta from adjacent sections whose IF weighted centroids are <400 nm apart are merged into 3D PSD-95 puncta (vertical lines). d, A histogram of the summed PSD-95 IF signal across puncta. Overlapping puncta (red); nonoverlapping puncta (black). The dotted black line indicates the threshold that best separates overlapping from nonoverlapping puncta. e, Summed fluorescence from four channels (left columns), and total surface area and number of 2D puncta comprising each 3D punctum (middle columns). Each row represents a punctum; grayscale represents Z-score of corresponding measurement, for each column. Puncta in the top block overlap a synapse; those in the bottom block do not. The SVM output column represents fraction of SVM classifiers, which predict that punctum to overlap. The puncta rows have been sorted within each block by SVM output. f, Quantification of synaptic detection performance when using all PSD-95 puncta (all), only those with summed PSD-95 IF above the optimal threshold (PSD IF), or those categorized as overlapping by SVM. Left, Percentage of synapses detected, by virtue of overlapping with at least one PSD-95 punctum. Right, Percentage of PSD-95 puncta that overlap with no synapses. Error bars indicate SD over 100 cross-validated SVM models. See also Figure 10.
Computer assisted imaging of serial sections on rigid substrates.
IF imaging provided a rapid way to map the location of individual sections on the rigid substrate of the glass coverslip. With the sample rigidly mounted, corresponding points on the sample can be located in the SEM and LM, and used to fit a similarity transformation (rigid rotation and a uniform change in scale factor) between the coordinate systems of the two microscopes. To facilitate this process, we obtained a low-magnification SEM mosaic that covered the entire ribbon (Fig. 3b). At these magnifications, no focus adjustments were necessary, so the mosaic acquisition was fully automated. This mosaic was stitched together using scripts which combined the metadata information describing the location of stage of each image along with the stitching algorithms available through FIJI (Schindelin et al., 2012), to automate the process. MosaicPlanner, a custom Python-based graphical user interface, (available at http://smithlabsoftware.googlecode.com), was used to automatically locate corresponding locations across sections and transform those points between the coordinate systems of the two microscopes. Two points of correspondence suffice to fit a similarity transformation, but several points covering the entire length of the ribbon produced a more accurate transformation.
Figure 3.
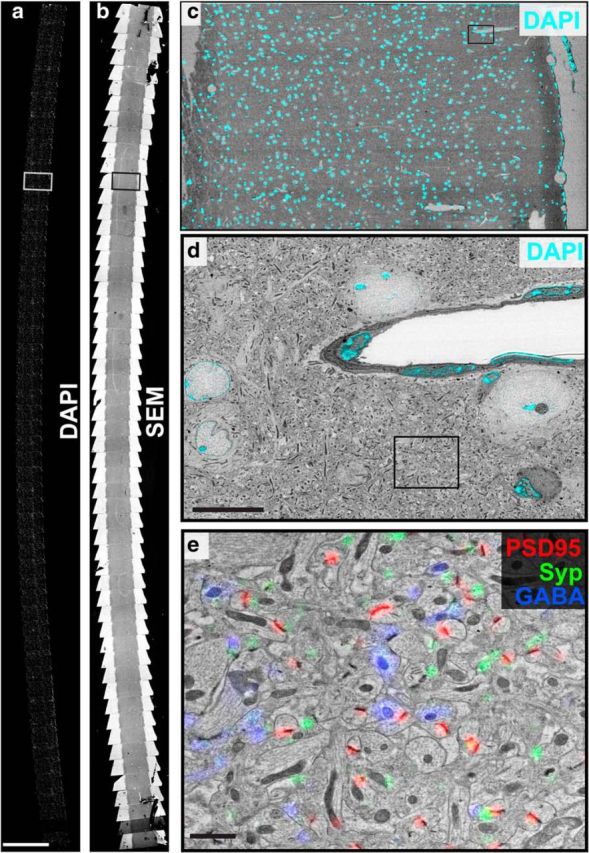
Conjugate SEM-IF imaging. a, A mosaic showing 55 sections of an array tomography ribbon, imaged for the fluorescent nuclear stain DAPI (10× objective). Scale bar, 1 mm. b, A mosaic of low-magnification SEM images of the same ribbon shown in a. c, A color overlay of the boxed region within a, b shows a single section from the ribbon. d, A higher-magnification SEM image, from within the field of c (top right, black box); color overlay shows fluorescent image (63× objective). The DAPI signal (cyan) highlights the correspondence between the locations of nuclei within the field. Scale bar, 10 μm. e, A higher-magnification SEM image taken within the field of d (black box), overlaid with IF signals (PSD-95: red, synaptophysin: green, and GABA: blue; 63× objective). Scale bar, 1 μm.
This position list was then used to acquire a series of SEM images (Fig. 3c), with fields large enough to include several cell bodies. These images were used to register the IF data using correlations between the DAPI stain and the structure of nuclei as defined by the SEM image. These SEM images were aligned across the different sections using a translational transformation to calculate a refined position list, correcting for inaccuracies in the original position list and the differential orientation of sections across the ribbon. Each serial section was then reimaged at high-resolution (2.23–3.7 nm/pixel) using this refined position list to aid in imaging the same region from each section.
Registration of LM and EM.
We used the TrakEM2 plugin (Cardona et al., 2012) within FIJI (Schindelin et al., 2012) to facilitate image registration. TrakEM2 allows one to define sets of corresponding points between two slices, fit a transformation to those points, and propagate that transform to other slices within the project; rather than using different z-slices to correspond to different serial sections, we used them to represent different image channels. We used the open XML format of the TrakEM2 plugin to set up TrakEM projects for each of the sections in the dataset, with a custom MATLAB script. Information from both acquisition systems was used to place the images in rough correspondence. The registration procedure begins with electron micrographs taken at medium and high-resolution, first approximately by translation, and then refined using SIFT feature correspondence in TrakEM2 (Saalfeld et al., 2010). DAPI images were then histogram-normalized to make the spatial structure in both the dim autofluorescence and brighter DAPI fluorescence equally apparent. This is useful because variations in the dim autofluorescence correspond to ultrastructural features visible in the electron microscope, such as large dendrites with weak autofluorescence, and mitochondria with strong autofluorescence. Several corresponding features in the DAPI images and the medium magnification EM images were identified by eye, and used to fit a similarity transformation (rigid rotation plus uniform scaling). This transformation was automatically applied to the other light microscopy images.
Once registered, identical alignment transformations that bring the images from section to section into correspondence can be calculated and applied to images from a set of sections. We calculated the alignment based upon the EM images, using the elastic alignment algorithm in TrakEM2 (Saalfeld et al., 2012). These alignment transforms were then applied to IF data. Our image reconstruction tools, including tools to assist in deconvolution, stitching, registration, and alignment are all available at smithlabsoftware.googlecode.com.
Synaptic analysis.
Synapses in the SEM images were identified by manually inspecting the entire volume. Synapses were annotated by identifying the voxels associated with the electron-dense membrane appositions of each individual synapse using TrakEM2 (Cardona et al., 2012). These annotated sets of voxels were then imported into MATLAB (MathWorks) along with the IF and SEM data; custom scripts were used to quantify IF signals across those voxels, and perform the described synapse detection algorithm. Summed IF signal corresponds to the summation of the IF intensity values across the voxels associated with a particular synapse or PSD-95 punctum.
Synaptic contact area was quantified by counting the total number of voxels associated with each synapse, multiplying by the volume of a single voxel, then dividing by the brush width used to paint the synapse (40 nm). Because this width is approximately the same size as the section thickness, this calculation approximates the synaptic contact area and is linearly related to the number of voxels associated with each synapse. The quantification in Figure 9f excludes synapses and PSD-95 puncta that were identified as touching the “edge” of the dataset. To define the edge, voxels of the final conjugate image stack where there was missing or poor-quality data from either SEM imaging or IF imaging were labeled as edge voxels. An object (either PSD-95 punctum or SEM-identified synapse) was identified as touching the edge if the smallest 3D box that included all of its voxels (its bounding box) contains any edge voxels. An object was also identified as touching the edge if the object contained voxels from the first or last section in the series and only contained voxels from one or two sections. Synapses touching the edge were excluded from the counting of synapses with overlapping PSD-95 puncta, and PSD-95 puncta touching the edge were excluded from the counting of PSD-95 puncta with overlapping synapses.
To determine whether a particular synapse contained presynaptic or postsynaptic GABA, all the SEM and IF data surrounding the synapse were displayed to a human expert observer using a synaptogram format as in Figure 7. The combination of IF and EM data made it easy to determine synaptic polarity, because the presynaptic side stained for synapsin and contained a cloud of synaptic vesicles. The observer could then assess which sides of the synapse were consistently positive for GABA. GABA IF uniformly filled axonal terminals, but could be also be clearly visualized in some dendrites, though not entirely filling the process (Fig. 8). A dendrite was deemed to be GABAergic if it showed staining in two or more serial sections. We are confident that virtually all synapses classified as terminating on GABAergic dendrites were correctly identified, but we might not have identified all such synapses. Furthermore, although the overwhelming majority of neurons whose processes lack GABA are glutamatergic, some likely release other neurotransmitters. However, the same basic methodology could also be used to identify many cell types, including those releasing other neurotransmitters.
Figure 8.
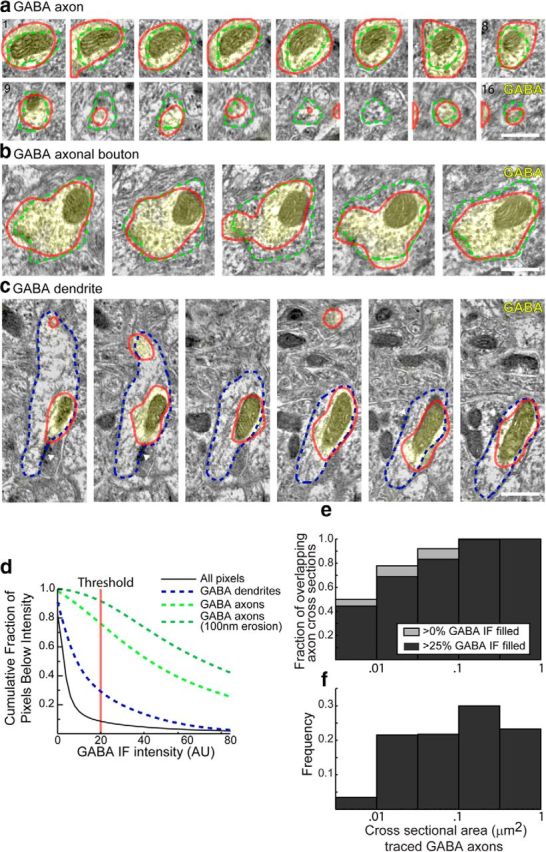
GABA IF in axons and dendrites. Twenty-four axons and six dendrites with consistent GABA IF staining were traced within the dataset shown in Figures 3, 5, and Movie 1. The resulting traces included 531 axonal profiles and 133 dendritic profiles, across 27 serial sections. a, An example tracing of a GABAergic axon over 15 sections. GABA IF is overlaid in yellow. The traced outline of the axon is shown as dashed green line. The outline of a thresholded image of GABA IF is shown in red. Scale bar, 500 nm. b, An example tracing of a GABAergic presynaptic bouton, across 5 sections. Scale bar, 500 nm. c, An example tracing of a GABAergic dendrite; GABA IF is consistently visible in the mitochondria (Somogyi and Hodgson, 1985). Note excitatory synapses (white triangles) on the dendritic shaft and lack of spines. Scale bar, 500 nm. d, Proportion of pixels that exhibit GABA IF, as a function of cutoff threshold intensity. Only 8.4% of all pixels have IF intensity larger than the threshold used in a–c (red lines). On the other hand, 76.0% of the pixels within the traced GABA axons were above this threshold, indicating that the GABA IF signal fills most of the axonal space. Analysis of traced axonal cross-sections (excluding pixels within 100 nm of the traced border) showed that 91.7% of those areas were covered with GABA IF above the same threshold. GABAergic dendrites were less completely filled; only 29.1% of their pixels were covered with GABA IF above this threshold. e, To evaluate consistency of GABA IF labeling in axonal processes as a function of cross-sectional area, the fraction of cross-sections which had at least 1 pixel of overlap, or 25% of its area covered with GABA IF above the threshold, was calculated as a function of the cross-sectional area. f, The corresponding frequency with which cross-sections of different sizes were observed in the data. The data are binned on a log scale, as the cross-sectional area of axons varies over two orders of magnitude. Although smaller axonal cross sections are labeled less consistently, overall the vast majority are labeled.
To assess the amount of IF signal that could be expected to be randomly observed at synapses of varying sizes, we performed simulations, positioning synapses from the real data randomly within the dataset, by independently translating each of its component 2D segmentations. If a randomly translated 2D segmentation touched the edge of the dataset (see Synaptic analysis, second paragraph, above), it was simply randomly translated again. The summed IF for each channel was then recalculated using the locations of the randomly placed voxels.
Regression analysis.
To determine whether different synaptic types had different molecular signatures, we summed the IF signal across all voxels associated with each synapse. Thus, larger synapses should have proportionally larger summed IF, assuming uniform IF intensity per voxel. As different synaptic types might have systematic differences in their distribution of sizes, we wanted to measure differences in their molecular composition controlling for size. Analysis of covariance (ANOCOVA) and multiple-comparison testing was performed with the Statistical toolbox within MATLAB using the functions “aoctool” and “multcompare” respectively. The Tukey–Kramer method at the p = 0.05 level was used to determine significance in both slope and intercept of regression fits.
Synapse detection.
To begin identifying synapses from GABA-negative axons, 2D segmentation of PSD-95 IF was performed by applying a threshold, set to include all IF puncta above the background autofluorescence (see Fig. 9a). For quantitative consistency, this threshold was defined by lowering the threshold until the resulting segmentation produced a median PSD-95 punctum size of >0.09 μm2. We merged 2D PSD-95 puncta from adjacent sections into a single 3D PSD-95 punctum when their IF weighted centroids were <400 nm apart (see Fig. 9c). The threshold was set at 400 nm, because analysis of the conjugate AT data show that ∼90% of all such merges resulted in linking PSD-95 puncta that overlap with the same synapse, without merging distinct synapses (see Fig. 10a).
Figure 10.

Further analysis of IF-based synapse detection. a, A histogram of the 2D distances between pairs of 2D segmented PSD-95 puncta from adjacent sections. The x-axis represents the distance and the y-axis the number of pairs found at that distance. Different colors represent the number of pairs at each distance that represent pairs of PSD-95 puncta which both overlap with the same EM-identified synapse (intrasynaptic merges, dark gray bars), pairs of puncta in which the puncta overlap with distinct synapses (intersynaptic merges, white bars), or pairs in which one or more of the puncta does not overlap with a synapse (nonsynaptic merges, light gray bars). Coplotted as lines using the right hand y-axis is the fraction of pairs less than a given threshold that are intrasynaptic (dark gray line), or are either intrasynaptic or nonsynaptic (light gray line). The chosen merging threshold of 400 nm is noted as an inflection point in both cumulative fractions that captures the vast majority of all intrasynaptic merges. The schematic illustrates examples of the different types of merges, where the two columns represent the adjacent sections, the green outlines represent the pair of PSD puncta being merged, and the colored regions represent synapses. Synapses colored the same color are the same synapse, where distinct colors represent different synapses. b, A heatmap as in Figure 9e, showing all molecular metrics available in the dataset. Training a threshold classifier on each channel individually demonstrated that several metrics could predict whether PSD-95 puncta overlapped with synapses better than expected by chance (p < 0.01 by permutation test; see Materials and Methods). ci, Percentage of synapses within the dataset shown in Figure 9 that overlap with 0 (false-negative), 1 (correct), or ≥2 (double-counted) PSD-95 puncta that were classified positive by SVM models. ii, Percentage of puncta which overlap with 0 (false-positive), 1 (correct), or ≥2 (merged) synapses. Error bars indicate SD over 100 cross validated SVM models. d, Conjugate SEM data overlaid with PSD-95 puncta and EM-identified synapses from glutamatergic synapses (red) and GABAergic synapses (blue). Puncta that do not overlap with a synapse are outlined in black. This image comes from the larger dataset shown in Figure 11; all analyses shown in d, e, g, h, pertain to this dataset. e, A histogram of the summed PSD-95 IF signal across puncta. Overlapping puncta (red); nonoverlapping puncta (black). Coplotted using the right hand axis is the accuracy of simple threshold classifier as that threshold varies (solid black line). The dotted black line indicates the threshold that best predicts overlapping from nonoverlapping puncta. f, An example of a PSD-95 punctum that was classified as overlapping with synaptic contacts by the vast majority of SVM models, but in fact does not overlap. The borders of the segmented PSD-95 punctum are shown in green. Nonsynaptic PSD-95 staining is visible at the edge of a mitochondrion. g, Measurements of summed IF, total surface area and number of merged 2D puncta in each 3D punctum. Each row represents a punctum, each column a measurement. Grayscale represents Z-score of corresponding measurement. The top and bottom blocks indicate whether the punctum overlaps a glutamatergic synapse. SVM-out column represents fraction of SVM classifiers that predict that punctum to overlap. hi, Percentage of glutamatergic synapses that overlap with 0 (false-negative), 1 (correct) or ≥2 (double-counted) puncta. hii, Percentage of puncta that overlap with 0 (false-positive), 1 (correct), or ≥2 (merged) glutamatergic synapses. Error bars indicate SD over 100 cross validated SVM models. Metrics shown for all PSD-95 puncta, as well as only puncta that were classified as likely overlapping with glutamatergic synapses (SVM classified +).
Permutation test.
To test whether linear threshold classifiers performed better than expected by chance, we compared the optimal performance of the linear classifier to the optimal performance obtained when the overlapping/nonoverlapping labels were randomly permuted across the PSD-95 puncta. This procedure preserves the percentage of PSD-95 puncta that overlap, and the statistical distribution of IF-derived measurements, while allowing us to sample how often a particular level of performance is likely to occur due to statistical fluctuations alone. If <10 of 1000 permutation tests produced optimal linear classification better than the actual labeling, then that IF derived measurement was noted as performing significantly better than chance at predicting overlap with synapses, and highlighted in red within Figure 10b,g.
SVM classification.
Measurements for integrated IF of all channels, PSD-95 puncta size, and number of merged puncta for each PSD-95 puncta were preprocessed using a Z-transform (the mean measurement across all puncta was subtracted, and the result divided by the SD across all puncta). For each run of the support vector machine (SVM), 20% of the PSD-95 puncta were randomly selected, and their Z-transformed measurements and corresponding synapse overlap label (overlaps or does not overlap with a synapse) were passed into an SVM classifier included in the Bioinformatics toolbox of MATLAB. The SVM was tuned using a linear kernel, and a Karush–Kuhn–Tucker violation level of 4%. The resulting set of classifiers had an overall accuracy of 90.9 ± 2.1% (see Figure 9f). The overall accuracy is measured by counting the percentage of puncta whose overlap label was predicted correctly by the classifier. This accuracy is measured on the 80% of the PSD-95 puncta not used in training for each run of the SVM. However, the accounting of percentage of synapses identified using SVM classified puncta, and the percentage of puncta that did not overlap with a synapse (false-positives, as reported in Fig. 9f) includes all PSD-95 puncta.
Results
Osmium-free freeze-substitution embedding relieves specimen preparation tradeoffs
We examined the quality of ultrastructural preservation and IF staining in blocks of mouse cortex prepared by various standard methods (Fig. 1), confirming inopportune tradeoffs between ultrastructural preservation and immunoreactivity (Eldred et al., 1983; Rostaing et al., 2004) In contrast, freeze-substitution in Lowicryl HM-20 of material fixed with mixed aldehydes (van Lookeren Campagne et al., 1991; Oprins et al., 1994; Fabig et al., 2012) yielded excellent ultrastructural preservation even without osmium, with good definition of subcellular structures, including mitochondria, synaptic vesicles, the postsynaptic density (PSD), the spine apparatus, and other intracellular compartments (Fig. 2 shows more images). The majority of antibodies previously used successfully on formaldehyde fixed, LR White-embedded tissue yielded similar results on this Lowicryl-embedded tissue (Fig. 1d,f).
Because independent IF, TEM, and SEM experiments performed on thin sections from the same Lowicryl sample provided excellent results, we developed procedures to image individual arrays by both IF and SEM, and to co-register the resulting micrographs. We imaged sections with IF using standard AT methods (Fig. 3a), then poststained and imaged the same ribbon in the SEM (Fig. 3b). By collecting images at a series of magnifications, we could register high-magnification SEM images precisely within individual sections (Fig. 3c). Independent tracing of mitochondria in the IF and SEM data suggest that x–y registration was accurate to within a single pixel of IF data (80 ± 41 nm, 141 mitochondria cross sections over 10 sections; Figure 4). “Registration” here refers to the process of bringing two images of the same physical section into correspondence, and “alignment” to the process of bringing images from different sections into correspondence.
Figure 4.
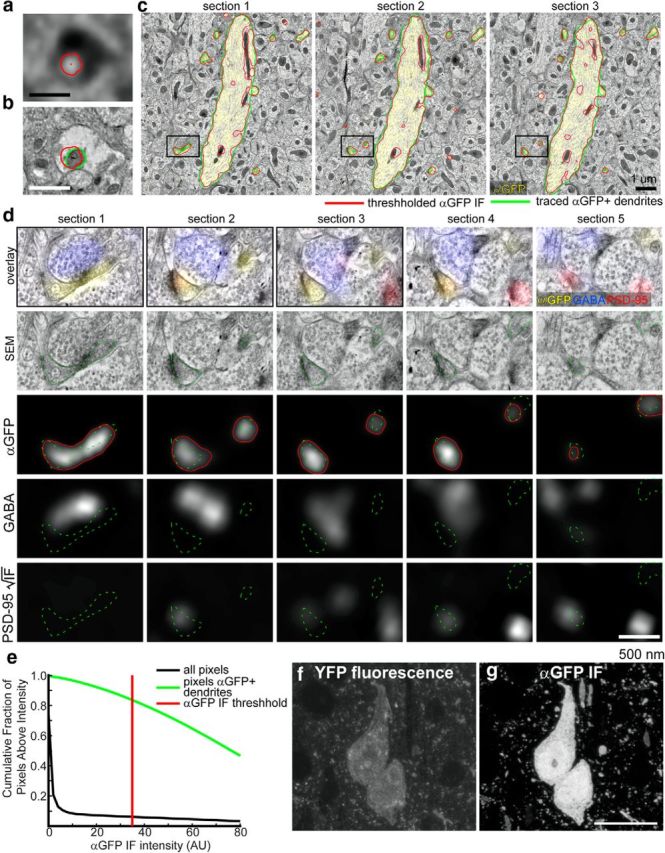
Registration of IF and SEM Measurements of Neuronal Structure. a, An example of a mitochondrial profile, identified by dim autofluorescence in the DAPI channel. The boundary of the traced region is shown in red, and its centroid as a small red x. b, SEM image of the region in a. The mitochondrial profile was independently traced in green, and its centroid labeled with a green dot. The red outline is from a; a black line marks the 78.8 nm displacement between the two centroids. c, Conjugate IF-SEM of layer IV of an YFP line H-positive mouse. Three serial sections are shown, with αGFP IF overlaid in yellow. Dendritic processes that were consistently stained with αGFP were traced in the EM (green outlines). Thresholding the αGFP IF (red outlines) demonstrates that αGFP IF fills nearly the entire dendritic profile, except for mitochondria. Scale bar, 1 μm. d, Five serial sections of the dendritic spine within the black box outlined in a. A color overlay of GABA (blue), αGFP (yellow), and PSD-95 (red) is shown. Bottom, The individual channels are shown in grayscale, with the traced spine repeated across channels in dotted green. The outline of the thresholded αGFP image is overlaid on the αGFP image (red line). The PSD-95 IF is displayed with a color map proportional to the square root of the IF intensity (to reveal the PSD-95 signal within a synapse located on the dendritic spine without saturating the image of the nearby synapse in the lower right of sections 3–5). Scale bar, 500 nm. e, Quantification of the proportion of pixels that have αGFP intensities larger than a varied threshold. For the threshold displayed in c, d (red line), the cutoff included only 6.2% of all pixels visible in the field. On the other hand, 83.5% of the pixels within the dendritic structures traced within seven consecutive sections were above this threshold, indicating that the αGFP signal nearly fills the dendritic space; most of the areas of the dendritic processes that were not positive lie within mitochondria, or near the edges of the dendritic processes. The threshold was chosen such that the outline of the thresholded IF lay approximately on the membrane of the larger dendritic process. f, A fluorescence image from cortical layer 5 of a YFP line-H mouse embedded in Lowicryl HM-20.The fluorescence is detectable, although dimmer than in tissue embedded in LR White. g, An IF image from the same region, after applying an αGFP antibody, and a fluorescent secondary spectrally separable from YFP (AlexaFluor 594). The signal is dramatically amplified. Scale bar, 10 μm.
Importantly, the mixed aldehyde fixation preserved the spatial distribution of the inhibitory neurotransmitter GABA, which is not retained in formaldehyde-fixed tissue (Somogyi and Hodgson, 1985). We found that tissue from animals expressing a genetically encoded fluorescent tag (YFP-line-H mouse; Feng et al., 2000) retained detectable native fluorescence, though the technique was not optimized to preserve fluorescence (Watanabe et al., 2011). Amplification with an anti-GFP antibody greatly enhanced this signal, which filled nearly the entire dendritic arbor (>80%) of YFP-expressing cells (Fig. 4).
Antibody-labeled ribbons of Lowicryl sections can be eluted and subsequently restained and registered to previous cycles of staining and imaging. Thus, like IF-AT (Micheva and Smith, 2007; Micheva et al., 2010), conjugate AT can produce datasets with a high degree of molecular multiplexing (Fig. 5). For example, the three-cycle staining of neocortex shown in Figure 5 included nine different antibodies, labeling presynaptic and postsynaptic compartments of glutamatergic (synapsin, VGluT1, PSD-95, GluN1), and GABAergic (synapsin, GABA, GAD, gephyrin) synapses, as well as markers for myelin and glial cytoplasm (MBP, glutamine synthetase). Contrast was reduced in electron micrographs from samples that had been exposed to elution solution, compared with adjacent sections that were immediately poststained for EM without any LM imaging (Fig. 6); reducing the pH of the elution solution improved, but did not completely alleviate this problem (see Materials and Methods).
Figure 5.
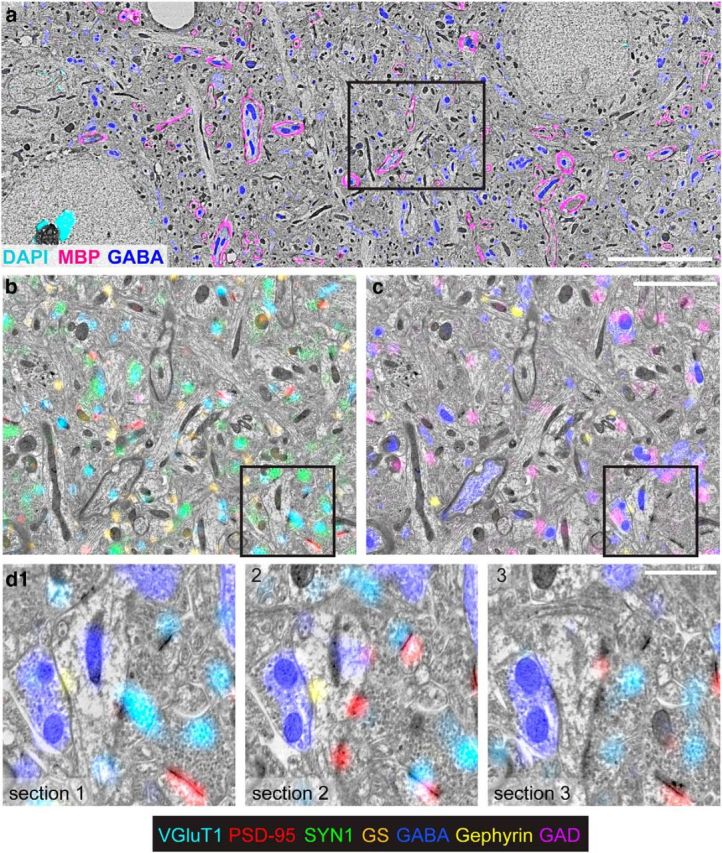
Molecular multiplexing with conjugate AT. a, A large SEM field is shown in grayscale, with immunofluorescence for myelin basic protein (MBP; magenta), GABA (blue), and DAPI (cyan). Scale bar, 10 μm. b, An enlarged subfield (black box in a) overlaid with VGluT1 (light blue), glutamine synthetase (orange), synapsin-1 (green), and PSD-95 (red). c, The same field as b, overlaid with GABA (blue), gephryin (yellow), and GAD (purple). Scale bar, 3 μm. d1, A subfield from b, c (black box) overlaid with GABA (blue), PSD-95 (red), gephyrin (yellow), and VGluT1 (cyan). d2, d3, The corresponding region in two adjacent serial sections. Note the consistent GABA staining of the mitochondria in the central dendrite, indicating that it is a GABAergic dendrite. Scale bar, 1 μm.
AT is well suited to map the complex 3D shape of synapses, since the alignment of images from serial sections allows reconstruction of structures in 3D with high z-axis resolution (Fig. 7; Movie 1). Data from serial sections can be readily visualized using “synaptograms” (Micheva and Smith, 2007; Fig. 7b). The availability of coregistered SEM images enhanced our ability to interpret the IF signal; conversely, IF data could also assist interpretation of EM images. For example, GABA IF, which was largely space-filling within GABAergic axons (>75% of the volume; Fig. 8), proved helpful in tracing individual processes, as most axonal processes are not GABAergic. A subset of dendritic processes also showed consistent GABA staining, particularly in mitochondria (as found also in previous reports; Somogyi and Hodgson, 1985), though only 29% of their dendritic volume was labeled. These dendrites, which had numerous excitatory synapses onto their dendritic shafts and lacked spines, were likely to originate from GABAergic neurons.
Serial SEM sections with color overlay. Very high-resolution SEM images from consecutive sections, overlaid with two sets of molecular markers. As the movie progresses, first it zooms in on a region of the first section, then proceeds to display that region from each section in the series in order. For each section, first the EM alone is displayed, then the first set of IF signals is overlaid [GABA (blue), GAD (purple), gephyrin (yellow)], then the second set of molecular markers is overlaid [PSD-95 (red), synapsin-1 (green), glutamine synthase (orange), VGluT1 (light blue)], and then it progresses to the next section. The movie goes through all 27 sections, then repeats the series of images in the reverse order. The section number is displayed in the lower right corner. Download and play in external Quicktime player to advance frame by frame.
Comparing IF and SEM synaptic analysis
IF-AT provides richer molecular information and higher speed at lower cost than does EM analysis, while EM provides the gold standard for identification of a synapse. Previous methods of IF-AT analysis relied on human judgment alone to determine synaptic locations (Micheva et al., 2010; Busse and Smith, 2013; Rah et al., 2013). In contrast, conjugate AT allows identification of all synapses with SEM, providing a rigorous “ground truth” to compare with putative synapses detected by automated algorithms (Fig. 9). We acquired a serial-section dataset with overlaid IF data, comprising 27 70 nm sections with IF signals for GABA, MBP, GS, gephyrin, GAD, PSD-95, synapsin, VGluT1, and NR1, along with SEM data, encompassing a 14 × 10 × 1.9 μm block. Synapses were visually identified in the SEM data by marking voxels showing increased electron density at the apposition of two processes, where synaptic vesicles were present nearby (Fig. 9b, red areas).
We first evaluated a simple algorithm, using PSD-95 to identify the locations of glutamatergic synapses (identified as involving a GABA-negative axon; see Materials and Methods). We did not attempt automated detection of GABAergic synapses, as only 73% of such EM-identified synapses overlapped with detectable levels of gephyrin IF, presumably reflecting greater diversity in the molecular composition of GABAergic synapses (Viltono et al., 2008). The algorithm used thresholding to segment individual PSD-95 IF puncta in 2D, then merged these 2D puncta into 3D puncta across serial sections (Fig. 9a–c, Fig. 10a; see Materials and Methods).
The resulting set of PSD-95 puncta overlapped the large majority of SEM-defined glutamatergic synapses (94.6%; Fig. 9fi). However, 64.3% of the PSD-95 puncta failed to overlap with a glutamatergic synapse (Fig. 9fii), implying an unacceptably high rate of false-positives. We compared PSD-95 puncta that overlapped with synapses with those that did not. Quantifying the summed IF signal, we found that puncta with bright PSD-95 IF almost always overlapped with synapses, but puncta with the dimmest fluorescence were usually false-positives. Using conjugate AT data, we could select an optimal threshold to distinguish PSD-95 puncta that overlapped with a synapse from those that did not (Fig. 9d, dotted black line). Discarding PSD-95 puncta whose summed PSD-95 IF fell below that threshold yielded a set of puncta that correctly identified 78.9% of the glutamatergic synapses, while producing a false-positive rate of only 5.9%.
To improve upon this simple method, we leveraged the high dimensionality of the conjugate data to combine measurements of the summed IF signal from three other channels, the total number of voxels in each PSD-95 punctum, and the number of 2D puncta comprising each 3D punctum, to predict which PSD-95 puncta overlap with synapses. We used these measurements to train a SVM classifier (Cortes and Vapnik, 1995) to identify overlapping PSD-95 puncta with a high overall accuracy (see Materials and Methods). The resulting set of SVM-identified PSD-95 puncta found 88.8 ± 1.2% of the glutamatergic synapses, with a 6.5 ± 1.6% false-positive rate (mean ± σ over 100 cross-validated models). The SVM models were very consistent with respect to which PSD-95 puncta were predicted to overlap, as 95.5% of the PSD-95 puncta were classified identically by at least 80% of models, demonstrating the robustness of the results (Fig. 9e, true green/black regions). A percentage (46.5%) of the false-positive mistakes made by the SVM models involved PSD-95 puncta that overlapped with the edges of mitochondria (Fig. 10f).
Molecular composition of synaptic subtypes
The majority of neurons in the mammalian neocortex are either glutamatergic or GABAergic (Ottersen and Storm-Mathisen, 1984; Melone et al., 2005). Accordingly, most synapses can be divided into four basic subtypes (Fig. 11a). To visualize and quantify synaptic structures of different types, we acquired a larger serial-section dataset with overlaid IF data, comprising 39 thin sections with IF signals for PSD-95, synapsin, βIII-tubulin, VGluT1, GABA, VGAT, gephyrin, GAD2, and NR1, along with SEM data, encompassing a 29.5 × 14.4 × 2.7 μm block collected at 3.72 nm/pixel. Synapses were identified as before, but the lower resolution of this dataset did not always allow clear visualization of individual synaptic vesicles. To identify synapses belonging to each subtype, we examined the IF and SEM data together, determining whether GABA was present in the presynaptic and/or postsynaptic process of EM-identified synapses (Fig. 11b). GABA-negative processes were presumed to be glutamatergic.
Figure 11.
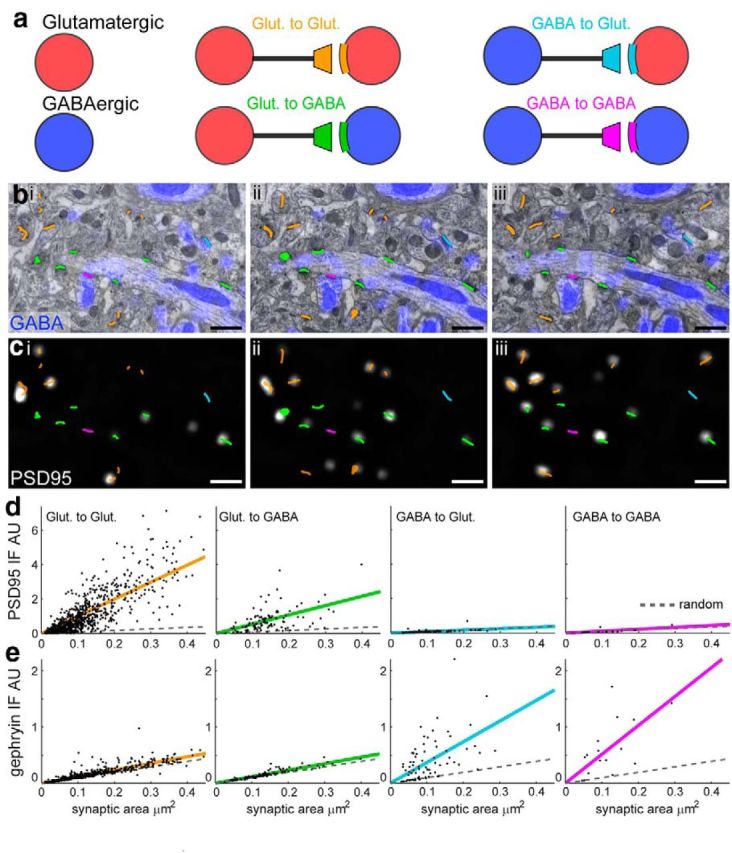
Measuring the molecular composition of four synapse types. a, A simplified schematic of a neural circuit shows two basic cell types: GABAergic (GABA) and glutamatergic (Glut) bi–biii, SEM images from three consecutive sections. EM-identified synapses overlaid in the color of their type indicated in a. c, Images of PSD-95 IF, with EM-identified synapses overlaid in the color of their type. d, Summed PSD-95 IF within each synapse versus synaptic contact area. Each column reflects a different synapse type. (Glut to Glut, n = 790; Glut to GABA, n = 108; GABA to Glut, n = 74; GABA to GABA, n = 16). Colored lines reflect linear fits to the data. Dotted gray lines show linear fits to randomly positioned synapses (n = 988). e, Summed gephyrin IF, plotted as in d.
We quantified immunofluorescence at each synapse by summing the IF signal over all voxels associated with the EM-identified synapses. Molecules associated with excitatory (VGluT1, PSD-95, NR1) or inhibitory synapses (gephyrin, GAD, VGAT) were enriched at their respective synapse types (Figs. 11, 12). The IF signal for PSD-95 appeared weaker within glutamatergic terminals synapsing onto GABAergic dendrites (Glut to GABA) than within glutamatergic terminals synapsing onto glutamatergic dendrites (Glut to Glut). To explore this relationship, we plotted the size of the EM-identified synapses (synaptic contact area; see Materials and Methods) versus the summed PSD-95 IF (Fig. 11d). Although larger synapses tended to have higher levels of PSD-95 IF, Glut to GABA synapses generally had less PSD-95 (green dots/line) than Glut to Glut synapses of equal size (orange dots/lines). As expected, both subclasses of glutamatergic synapses exhibited markedly more PSD-95 than did GABAergic synapses. ANOCOVA analysis of regression fits confirmed these relationships to be significant (p < 0.05; see Materials and Methods; Fig. 12g).
Figure 12.
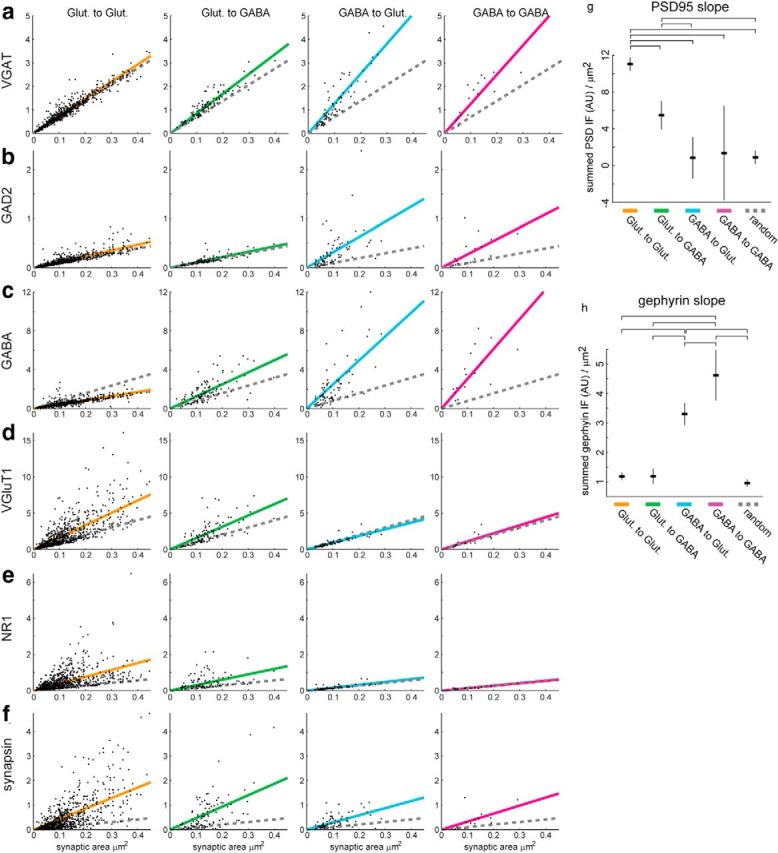
Further molecular measurements of synaptic type. a, Integrated VGAT IF within each synapse, versus synaptic contact area (see Materials and Methods). Different columns represent different synaptic types. Colored lines reflect linear fits to the data. Dotted gray lines show linear fits to randomly positioned synapses (see Materials and Methods). b, Summed GAD2 IF. c, Summed GABA IF. d, Summed VGluT1 IF. e, Summed NR1 IF. f, Summed synapsin-1 IF. Different synapse types show distinct patterns of molecular composition. GABA at Glut to Glut synapses is less than expected from random locations because such synapses implicitly avoid GABAergic processes, whereas random locations have some amount of overlap. Glut to GABA synapses have slightly elevated GABA compared with random because GABA IF is present in GABAergic dendrites. g, h, For the linear fits presented in Figure 11d, e, the best fit and 95% confidence intervals for the slope of those fits are indicated. The horizontal brackets above each graph indicate that the differences in that parameter of the fits were significantly different between the bracketed groups at the p < 0.05 level, using the Tukey–Kramer method for multiple-comparison testing. g, Fits for the slope of PSD-95 IF per μm2 of synaptic area. The slope for Glut to Glut synapses was significantly different from all other synapse types, including random. The slope for Glut to GABA synapses was significantly different from all other synapse types except GABA to GABA synapses (due to its relatively high uncertainty). The slopes of both GABA types were not significantly different from simulated random synapses. These results are consistent with PSD-95 being a molecule specific to excitatory synapses, and with Glut to Glut synapses having more PSD-95 IF than Glut to GABA synapses, while controlling for differences in the distribution of their sizes. h, Fits for the slope of gephyrin IF per μm2 of synaptic area. The slope for GABA to Glut synapses was significantly different from all other synapse types, as well as from simulated random synapses. The slope for GABA to GABA synapses was significantly different from all other synapse types, as well as from simulated random synapses. No other differences were significant. These results are consistent with gephyrin being a molecule specific to inhibitory synapses, and with GABA to GABA synapses having more gephyrin than GABA to Glut synapses of equal size.
To assess whether the PSD-95 signal from GABAergic synapses was above background, we simulated randomly located “synapses” and measured the summed IF across those voxels (Fig. 11, dotted line, see Materials and Methods). The PSD-95 signal from GABAergic synapses was not significantly above that found at these simulated synapses. In contrast, a similar analysis confirmed that gephyrin is selectively present at GABAergic synapses (Figs. 11, 12h).
Discussion
This report introduces conjugate array tomography, and describes a molecular survey of synapses from a single brain region as an example. Conjugate AT integrates immunofluorescence and SEM array image acquisition with computational image reconstruction, visualization, and analysis methods. As a special case of correlative microscopy, conjugate AT provides both high-resolution structural and high-dimensional molecular images in voxel-conjugate register. Earlier attempts at multimodal array tomography were limited by incompatibilities of tissue processing for immunoreactivity and for preservation of ultrastructure, as illustrated here and in our previous work (Micheva and Smith, 2007; Micheva et al., 2010), and as discussed extensively in the literature (Rostaing et al., 2004; Grabenbauer et al., 2005; Kukulski et al., 2011; Oberti et al., 2011; Shu et al., 2011; Lucas et al., 2012).
The work described here required careful optimization of freeze-substitution embedding methods (Humbel and Schwarz, 1989; van Lookeren Campagne et al., 1991; Oprins et al., 1994; McDonald, 2009; Kukulski et al., 2011) and methods for computational alignment and registration of multimodal images. We anticipate that this approach will advance broader efforts to map synapses and circuits. The present study of synapses in mouse somatosensory cortex suggests conjugate AT methods will be useful for the analysis of molecular architecture across many different brain regions, tissues, and species; thus, the same strategy should also be applicable to human pathological material.
Although the addition of molecular tags to volumetric EM has obvious advantages, conjugate AT does not replace techniques specifically optimized for ultrastructural preservation and electron microscopic imaging (Mikula et al., 2012; Tapia et al., 2012). The membrane contrast was adequate to visualize synaptic contacts, and further improvements in elution techniques might allow even greater EM contrast in conjugate AT data, but we are not confident that fine axonal processes can be traced reliably over long distances with these methods. We chose 70 nm as a section thickness to capture most synaptic contacts, but thinner sections might be advantageous for some purposes, including better tracing of fine processes. Notwithstanding continuing development of the technology, we believe the approach reported here should be widely useful.
Our data suggest molecular differences between synapse classes defined by the combination of neuron types comprising the synapse. The observation that PSD-95 levels are lower in glutamatergic synapses onto GABAergic neurons than onto glutamatergic neurons is intriguing. The molecular differences we have detected may relate to the fact that glutamatergic synapses onto pyramidal cells are generally axo-spinous, whereas glutamatergic synapses onto cortical GABAergic neurons are generally axo-dendritic. However, though already known to be physiologically distinct in terms of their short-term and long-term plasticity rules (Kullmann and Lamsa, 2011), few molecular markers distinguishing these two synaptic classes have yet been described (Zhang et al., 1999). Precisely the same analysis presented here, but with alternative molecular targets could identify novel markers of synapse subtypes.
Conjugate AT improves the rigor and performance of IF-based synapse detection. Previous studies of IF-AT data relied upon human identification of likely synaptic contacts, by either machine-assisted or manual inspection of the data. A recent study (Rah et al., 2013) compared human recognition of thalamocortical synapses using IF-AT data (based on axo-dendritic apposition and the presence of synaptophysin) with ultrastructural evidence obtained after transferring sections to TEM grids, using light osmium fixation and LR-White embedding (Micheva et al., 2010). They reported a false-positive rate of 22%, while missing 14% of the thalamocortical synapses. In contrast, the present study used a completely automated methodology for identifying synapses, with a systematic survey of all synapses within a scanned volume. The improved performance presented here is likely due to the use of both presynaptic and postsynaptic markers, as well our use of quantitative automated methodologies on tissue with significantly improved preservation of immunoreactivity and ultrastructure.
The automated algorithm described here aims to identify all glutamatergic synapses, and may prove useful as a tool for neuroscientists to map and quantify numbers of synapses when only IF is available. Conversely, although automated algorithms for synapse detection from EM data are being developed (Morales et al., 2011), the addition of IF channels could aid the automated detection of EM synapses. More broadly, the treatment presented here provides a quantitative framework for evaluating future work, where more sophisticated machine learning or morphological analysis might improve on the identification of synaptic locations.
Quantitative single-synapse analysis is motivated by the need to better understand synaptic mechanisms underlying neural circuit function, and by growing recognition of the importance of molecular and functional diversity present within synapse populations. As a histological imaging method, conjugate AT provides no direct functional information; nevertheless, the functional differences observed among synapses, including differences in synaptic sign and strength (Bourne and Harris, 2008), varied rules of synaptic plasticity (Feldman, 2009; Maffei, 2011), and precise patterns of synapse formation (Yamagata and Sanes, 2012) must all be implemented by differences at the molecular level. As physiological methods to measure the function of individual synapses at known locations become more effective (Jia et al., 2010), molecular measurements may provide a framework for understanding functional diversity in static maps of neural circuits (Lauritzen et al., 2013).
The present work points to two general principles. First, rigorous priors determined from one imaging modality may be used to strengthen inference from sampling by a second, orthogonal imaging modality that provides less complete information but offers other advantages (e.g., cheaper, faster, or more physiological). Second, the power of such cross-modal inference may be greatly increased when the two modalities can be brought into voxel-conjugate image registration. In the present work, information from SEM imaging about the locations of synapses was used to evaluate the same measurements obtained from IF data. We believe that analogous approaches applied to LM-based measurements of neural wiring, conjugate with high quality EM reconstruction, could enable faster and more economical measurement of neural circuits.
Footnotes
This work was supported by Grants from the National Institutes of Health (R21MH099797, R01NS075252, R01NS077601 to S.J.S., R01NS039444 to R.J.W.), the Gatsby Charitable Trust, and a Collaborative Innovation Award (no. 43667) from the Howard Hughes Medical Institute. We thank Nafisa Ghori for performing serial sectioning and Lydia-Marie Joubert for help with the SEM and TEM imaging; and Nancy O'Rourke, Linnaea Ostroff, Natalie Sohn, and Nick Weiler for thoughtful comments on the paper.
S.J.S. and K.D.M. have a founder's equity interest in a company Aratome LLC, which develops array tomography for commercial purposes.
References
- Ahmari SE, Buchanan J, Smith SJ. Assembly of presynaptic active zones from cytoplasmic transport packets. Nat Neurosci. 2000;3:445–451. doi: 10.1038/74814. [DOI] [PubMed] [Google Scholar]
- Anderson JR, Jones BW, Watt CB, Shaw MV, Yang JH, Demill D, Lauritzen JS, Lin Y, Rapp KD, Mastronarde D, Koshevoy P, Grimm B, Tasdizen T, Whitaker R, Marc RE. Exploring the retinal connectome. Mol Vis. 2011;17:355–379. [PMC free article] [PubMed] [Google Scholar]
- Berryman MA, Rodewald RD. An enhanced method for post-embedding immunocytochemical staining which preserves cell membranes. J Histochem Cytochem. 1990;38:159–170. doi: 10.1177/38.2.1688894. [DOI] [PubMed] [Google Scholar]
- Bourne JN, Harris KM. Balancing structure and function at hippocampal dendritic spines. Annu Rev Neurosci. 2008;31:47–67. doi: 10.1146/annurev.neuro.31.060407.125646. [DOI] [PMC free article] [PubMed] [Google Scholar]
- Busse B, Smith S. Automated analysis of a diverse synapse population. PLoS Comput Biol. 2013;9:e1002976. doi: 10.1371/journal.pcbi.1002976. [DOI] [PMC free article] [PubMed] [Google Scholar]
- Cardona A, Saalfeld S, Schindelin J, Arganda-Carreras I, Preibisch S, Longair M, Tomancak P, Hartenstein V, Douglas RJ. TrakEM2 software for neural circuit reconstruction. PLoS One. 2012;7:e38011. doi: 10.1371/journal.pone.0038011. [DOI] [PMC free article] [PubMed] [Google Scholar]
- Chung WS, Clarke LE, Wang GX, Stafford BK, Sher A, Chakraborty C, Joung J, Foo LC, Thompson A, Chen C, Smith SJ, Barres BA. Astrocytes mediate synapse elimination through MEGF10 and MERTK pathways. Nature. 2013;504:394–400. doi: 10.1038/nature12776. [DOI] [PMC free article] [PubMed] [Google Scholar]
- Cortes C, Vapnik V. Support-vector networks. Mach Learn. 1995;20:273–297. doi: 10.1023/A:1022627411411. [DOI] [Google Scholar]
- Craig AS. Sodium borohydride as an aldehyde blocking reagent for electron microscope histochemistry. Histochemistry. 1974;42:141–144. doi: 10.1007/BF00533265. [DOI] [PubMed] [Google Scholar]
- Eldred WD, Zucker C, Karten HJ, Yazulla S. Comparison of fixation and penetration enhancement techniques for use in ultrastructural immunocytochemistry. J Histochem Cytochem. 1983;31:285–292. doi: 10.1177/31.2.6339606. [DOI] [PubMed] [Google Scholar]
- Emerman M, Behrman EJ. Cleavage and cross-linking of proteins with osmium (VII) reagents. J Histochem Cytochem. 1982;30:395–397. doi: 10.1177/30.4.7061831. [DOI] [PubMed] [Google Scholar]
- Emes RD, Grant SG. Evolution of synapse complexity and diversity. Annu Rev Neurosci. 2012;35:111–131. doi: 10.1146/annurev-neuro-062111-150433. [DOI] [PubMed] [Google Scholar]
- Fabig G, Kretschmar S, Weiche S, Eberle D, Ader M, Kurth T. Chapter 5: labeling of ultrathin resin sections for correlative light and electron microscopy. In: Thomas M, Paul V, editors. Methods in cell biology. New York: Academic; 2012. pp. 75–93. [DOI] [PubMed] [Google Scholar]
- Feldman DE. Synaptic mechanisms for plasticity in neocortex. Annu Rev Neurosci. 2009;32:33–55. doi: 10.1146/annurev.neuro.051508.135516. [DOI] [PMC free article] [PubMed] [Google Scholar]
- Feng G, Mellor RH, Bernstein M, Keller-Peck C, Nguyen QT, Wallace M, Nerbonne JM, Lichtman JW, Sanes JR. Imaging neuronal subsets in transgenic mice expressing multiple spectral variants of GFP. Neuron. 2000;28:41–51. doi: 10.1016/S0896-6273(00)00084-2. [DOI] [PubMed] [Google Scholar]
- Grabenbauer M, Geerts WJ, Fernadez-Rodriguez J, Hoenger A, Koster AJ, Nilsson T. Correlative microscopy and electron tomography of GFP through photooxidation. Nat Methods. 2005;2:857–862. doi: 10.1038/nmeth806. [DOI] [PubMed] [Google Scholar]
- Horstmann H, Körber C, Sätzler K, Aydin D, Kuner T. Serial section scanning electron microscopy (S3EM) on silicon wafers for ultra-structural volume imaging of cells and tissues. PLoS One. 2012;7:e35172. doi: 10.1371/journal.pone.0035172. [DOI] [PMC free article] [PubMed] [Google Scholar]
- Humbel BM, Schwarz H. Freeze substitution for immunochemistry. In: Verklej AJ, Leunissen JLM, editors. Immuno-gold labelling in cell biology. Boca Raton, FL: CRC; 1989. pp. 115–134. [Google Scholar]
- Jia H, Rochefort NL, Chen X, Konnerth A. Dendritic organization of sensory input to cortical neurons in vivo. Nature. 2010;464:1307–1312. doi: 10.1038/nature08947. [DOI] [PubMed] [Google Scholar]
- Kellenberger E. The response of biological macromolecules and supramolecular structures to the physics of specimen cryopreparation. In: Steinbrecht RA, Zierold K, editors. Cryotechniques in biological electron microscopy. Heidelberg: Springer; 1987. pp. 35–63. [Google Scholar]
- Knott GW, Holtmaat A, Wilbrecht L, Welker E, Svoboda K. Spine growth precedes synapse formation in the adult neocortex in vivo. Nat Neurosci. 2006;9:1117–1124. doi: 10.1038/nn1747. [DOI] [PubMed] [Google Scholar]
- Kukulski W, Schorb M, Welsch S, Picco A, Kaksonen M, Briggs JA. Correlated fluorescence and 3D electron microscopy with high sensitivity and spatial precision. J Cell Biol. 2011;192:111–119. doi: 10.1083/jcb.201009037. [DOI] [PMC free article] [PubMed] [Google Scholar]
- Kullmann DM, Lamsa KP. LTP and LTD in cortical GABAergic interneurons: emerging rules and roles. Neuropharmacology. 2011;60:712–719. doi: 10.1016/j.neuropharm.2010.12.020. [DOI] [PubMed] [Google Scholar]
- Lauritzen JS, Anderson JR, Jones BW, Watt CB, Mohammed S, Hoang JV, Marc RE. ON cone bipolar cell axonal synapses in the OFF inner plexiform layer of the rabbit retina. J Comp Neurol. 2013;521:977–1000. doi: 10.1002/cne.23244. [DOI] [PMC free article] [PubMed] [Google Scholar]
- Lucas MS, Gunthert M, Gasser P, Lucas F, Wepf R. Chapter 17: bridging microscopes: 3D correlative light and scanning electron microscopy of complex biological structures. In: Thomas M, Paul V, editors. Methods in cell biology. New York: Academic; 2012. pp. 325–356. [DOI] [PubMed] [Google Scholar]
- Maffei A. The many forms and functions of long term plasticity at GABAergic synapses. Neural Plasticity. 2011;2011:254724. doi: 10.1155/2011/254724. [DOI] [PMC free article] [PubMed] [Google Scholar]
- McDonald KL. A review of high-pressure freezing preparation techniques for correlative light and electron microscopy of the same cells and tissues. J Microsc. 2009;235:273–281. doi: 10.1111/j.1365-2818.2009.03218.x. [DOI] [PubMed] [Google Scholar]
- Melone M, Burette A, Weinberg RJ. Light microscopic identification and immunocytochemical characterization of glutamatergic synapses in brain sections. J Comp Neurol. 2005;492:495–509. doi: 10.1002/cne.20743. [DOI] [PubMed] [Google Scholar]
- Micheva KD, Smith SJ. Array tomography: a new tool for imaging the molecular architecture and ultrastructure of neural circuits. Neuron. 2007;55:25–36. doi: 10.1016/j.neuron.2007.06.014. [DOI] [PMC free article] [PubMed] [Google Scholar]
- Micheva KD, Busse B, Weiler NC, O'Rourke N, Smith SJ. Single-synapse analysis of a diverse synapse population: proteomic imaging methods and markers. Neuron. 2010;68:639–653. doi: 10.1016/j.neuron.2010.09.024. [DOI] [PMC free article] [PubMed] [Google Scholar]
- Mikula S, Binding J, Denk W. Staining and embedding the whole mouse brain for electron microscopy. Nat Methods. 2012;9:1198–1201. doi: 10.1038/nmeth.2213. [DOI] [PubMed] [Google Scholar]
- Mishchenko Y, Hu T, Spacek J, Mendenhall J, Harris KM, Chklovskii DB. Ultrastructural analysis of hippocampal neuropil from the connectomics perspective. Neuron. 2010;67:1009–1020. doi: 10.1016/j.neuron.2010.08.014. [DOI] [PMC free article] [PubMed] [Google Scholar]
- Morales J, Alonso-Nanclares L, Rodríguez J, Defelipe J, Rodríguez Å, Merchán-Perez A. ESPINA: a tool for the automated segmentation and counting of synapses in large stacks of electron microscopy images. Front Neuroanat. 2011;5:18. doi: 10.3389/fnana.2011.00018. [DOI] [PMC free article] [PubMed] [Google Scholar]
- Morgan JL, Lichtman JW. Why not connectomics? Nat Methods. 2013;10:494–500. doi: 10.1038/nmeth.2480. [DOI] [PMC free article] [PubMed] [Google Scholar]
- Newman GR, Hobot JA. Resin microscopy and on-section immunocytochemistry. Berlin: Springer; 1993. [Google Scholar]
- Nielson AJ, Griffith WP. Tissue fixation by osmium tetroxide: a possible role for proteins. J Histochem Cytochem. 1979;27:997–999. doi: 10.1177/27.5.479559. [DOI] [PubMed] [Google Scholar]
- Oberti D, Kirschmann MA, Hahnloser RH. Projection neuron circuits resolved using correlative array tomography. Front Neurosci. 2011;5:50. doi: 10.3389/fnins.2011.00050. [DOI] [PMC free article] [PubMed] [Google Scholar]
- Oprins A, Geuze HJ, Slot JW. Cryosubstitution dehydration of aldehyde-fixed tissue: a favorable approach to quantitative immunocytochemistry. J Histochem Cytochem. 1994;42:497–503. doi: 10.1177/42.4.8126376. [DOI] [PubMed] [Google Scholar]
- O'Rourke NA, Weiler NC, Micheva KD, Smith SJ. Deep molecular diversity of mammalian synapses: why it matters and how to measure it. Nat Rev Neurosci. 2012;13:365–379. doi: 10.1038/nrn3170. [DOI] [PMC free article] [PubMed] [Google Scholar]
- Ottersen OP, Storm-Mathisen J. Glutamate- and GABA-containing neurons in the mouse and rat brain, as demonstrated with a new immunocytochemical technique. J Comp Neurol. 1984;229:374–392. doi: 10.1002/cne.902290308. [DOI] [PubMed] [Google Scholar]
- Phend KD, Rustioni A, Weinberg RJ. An osmium-free method of epon embedment that preserves both ultrastructure and antigenicity for post-embedding immunocytochemistry. J Histochem Cytochem. 1995;43:283–292. doi: 10.1177/43.3.7532656. [DOI] [PubMed] [Google Scholar]
- Polishchuk RS, Mironov AA. Correlative video light/electron microscopy. Curr Protoc Cell Biol. 2001;4 doi: 10.1002/0471143030.cb0408s11. Unit 4.8. [DOI] [PubMed] [Google Scholar]
- Rah JC, Bas E, Colonell J, Mishchenko Y, Karsh B, Fetter RD, Myers EW, Chklovskii DB, Svoboda K, Harris TD, Isaac JT. Thalamocortical input onto layer 5 pyramidal neurons measured using quantitative large-scale array tomography. Front Neural Circuits. 2013;7:177. doi: 10.3389/fncir.2013.00177. [DOI] [PMC free article] [PubMed] [Google Scholar]
- Reichelt M, Joubert L, Perrino J, Koh AL, Phanwar I, Arvin AM. 3D reconstruction of VZV infected cell nuclei and PML nuclear cages by serial section array scanning electron microscopy and electron tomography. PLoS Pathog. 2012;8:e1002740. doi: 10.1371/journal.ppat.1002740. [DOI] [PMC free article] [PubMed] [Google Scholar]
- Rostaing P, Weimer RM, Jorgensen EM, Triller A, Bessereau JL. Preservation of immunoreactivity and fine structure of adult C. elegans tissues using high-pressure freezing. J Histochem Cytochem. 2004;52:1–12. doi: 10.1177/002215540405200101. [DOI] [PubMed] [Google Scholar]
- Saalfeld S, Cardona A, Hartenstein V, Tomančák P. As-rigid-as-possible mosaicking and serial section registration of large ssTEM datasets. Bioinformatics. 2010;26:i57–i63. doi: 10.1093/bioinformatics/btq219. [DOI] [PMC free article] [PubMed] [Google Scholar]
- Saalfeld S, Fetter R, Cardona A, Tomancak P. Elastic volume reconstruction from series of ultra-thin microscopy sections. Nat Methods. 2012;9:717–720. doi: 10.1038/nmeth.2072. [DOI] [PubMed] [Google Scholar]
- Schindelin J, Arganda-Carreras I, Frise E, Kaynig V, Longair M, Pietzsch T, Preibisch S, Rueden C, Saalfeld S, Schmid B, Tinevez JY, White DJ, Hartenstein V, Eliceiri K, Tomancak P, Cardona A. Fiji: an open-source platform for biological-image analysis. Nat Methods. 2012;9:676–682. doi: 10.1038/nmeth.2019. [DOI] [PMC free article] [PubMed] [Google Scholar]
- Seligman AM, Wasserkrug HL, Hanker JS. A new staining method (OTO) for enhancing contrast of lipid-containing membranes and droplets in osmium tetroxide-fixed tissue with osmiophilic thiocarbohydrazide(TCH) J Cell Biol. 1966;30:424–432. doi: 10.1083/jcb.30.2.424. [DOI] [PMC free article] [PubMed] [Google Scholar]
- Shu X, Lev-Ram V, Deerinck TJ, Qi Y, Ramko EB, Davidson MW, Jin Y, Ellisman MH, Tsien RY. A genetically encoded tag for correlated light and electron microscopy of intact cells, tissues, and organisms. PLoS Biol. 2011;9:e1001041. doi: 10.1371/journal.pbio.1001041. [DOI] [PMC free article] [PubMed] [Google Scholar]
- Sobkowicz HM, Rose JE, Scott GL, Levenick CV. Distribution of synaptic ribbons in the developing organ of corti. J Neurocytol. 1986;15:693–714. doi: 10.1007/BF01625188. [DOI] [PubMed] [Google Scholar]
- Somogyi P, Hodgson AJ. Antisera to gamma-aminobutyric acid: III. demonstration of GABA in golgi-impregnated neurons and in conventional electron microscopic sections of cat striate cortex. J Histochem Cytochem. 1985;33:249–257. doi: 10.1177/33.3.2579124. [DOI] [PubMed] [Google Scholar]
- Tapia JC, Kasthuri N, Hayworth KJ, Schalek R, Lichtman JW, Smith SJ, Buchanan J. High-contrast en bloc staining of neuronal tissue for field emission scanning electron microscopy. Nat Protoc. 2012;7:193–206. doi: 10.1038/nprot.2011.439. [DOI] [PMC free article] [PubMed] [Google Scholar]
- Terzakis JA. Uranyl acetate, a stain and a fixative. J Ultrastruct Res. 1968;22:168–184. doi: 10.1016/S0022-5320(68)90055-5. [DOI] [PubMed] [Google Scholar]
- van Lookeren Campagne M, Oestreicher AB, van der Krift TP, Gispen WH, Verkleij AJ. Freeze-substitution and lowicryl HM20 embedding of fixed rat brain: suitability for immunogold ultrastructural localization of neural antigens. J Histochem Cytochem. 1991;39:1267–1279. doi: 10.1177/39.9.1833448. [DOI] [PubMed] [Google Scholar]
- van Rijnsoever C, Oorschot V, Klumperman J. Correlative light-electron microscopy (CLEM) combining live-cell imaging and immunolabeling of ultrathin cryosections. Nat Methods. 2008;5:973–980. doi: 10.1038/nmeth.1263. [DOI] [PubMed] [Google Scholar]
- Viltono L, Patrizi A, Fritschy JM, Sassoè-Pognetto M. Synaptogenesis in the cerebellar cortex: differential regulation of gephyrin and GABAA receptors at somatic and dendritic synapses of purkinje cells. J Comp Neurol. 2008;508:579–591. doi: 10.1002/cne.21713. [DOI] [PubMed] [Google Scholar]
- Wang G, Smith SJ. Sub-diffraction limit localization of proteins in volumetric space using Bayesian restoration of fluorescence images from ultrathin specimens. PLoS Comput Biol. 2012;8:e1002671. doi: 10.1371/journal.pcbi.1002671. [DOI] [PMC free article] [PubMed] [Google Scholar]
- Watanabe S, Punge A, Hollopeter G, Willig KI, Hobson RJ, Davis MW, Hell SW, Jorgensen EM. Protein localization in electron micrographs using fluorescence nanoscopy. Nat Methods. 2011;8:80–84. doi: 10.1038/nmeth.1537. [DOI] [PMC free article] [PubMed] [Google Scholar]
- Yamagata M, Sanes JR. Expanding the ig superfamily code for laminar specificity in retina: expression and role of contactins. J Neurosci. 2012;32:14402–14414. doi: 10.1523/JNEUROSCI.3193-12.2012. [DOI] [PMC free article] [PubMed] [Google Scholar]
- Zhang W, Vazquez L, Apperson M, Kennedy MB. Citron binds to PSD-95 at glutamatergic synapses on inhibitory neurons in the hippocampus. J Neurosci. 1999;19:96–108. doi: 10.1523/JNEUROSCI.19-01-00096.1999. [DOI] [PMC free article] [PubMed] [Google Scholar]
Associated Data
This section collects any data citations, data availability statements, or supplementary materials included in this article.
Supplementary Materials
Serial SEM sections with color overlay. Very high-resolution SEM images from consecutive sections, overlaid with two sets of molecular markers. As the movie progresses, first it zooms in on a region of the first section, then proceeds to display that region from each section in the series in order. For each section, first the EM alone is displayed, then the first set of IF signals is overlaid [GABA (blue), GAD (purple), gephyrin (yellow)], then the second set of molecular markers is overlaid [PSD-95 (red), synapsin-1 (green), glutamine synthase (orange), VGluT1 (light blue)], and then it progresses to the next section. The movie goes through all 27 sections, then repeats the series of images in the reverse order. The section number is displayed in the lower right corner. Download and play in external Quicktime player to advance frame by frame.