

Abstract
Substantia nigra dopamine neurons fire tonically resulting in action potential backpropagation and dendritic Ca2+ influx. Using Ca2+ imaging in acute mouse brain slices, we find a surprisingly steep relationship between tonic firing rate and dendritic Ca2+. Increasing the tonic rate from 1 to 6 Hz generated Ca2+ signals up to fivefold greater than predicted by linear summation of single spike-evoked Ca2+-transients. This “Ca2+ supralinearity” was produced largely by depolarization of the interspike voltage leading to activation of subthreshold Ca2+ channels and was present throughout the proximal and distal dendrites. Two-photon glutamate uncaging experiments show somatic depolarization enhances NMDA receptor-mediated Ca2+ signals >400 μm distal to the soma, due to unusually tight electrotonic coupling of the soma to distal dendrites. Consequently, we find that fast tonic firing intensifies synaptically driven burst firing output in dopamine neurons. These results show that modulation of background firing rate precisely tunes dendritic Ca2+ signaling and provides a simple yet powerful mechanism to dynamically regulate the gain of synaptic input.
Keywords: action potential, backpropagation, calcium imaging, dendrite, dopamine, substantia nigra
Introduction
Dopaminergic neurons of the substantia nigra pars compacta (SNc) play a key role in movement and reward-based learning (Wise, 2004; Schultz, 2007). Critical to their function in vivo, dopamine neurons exhibit steady, tonic firing within a narrow range of 1–6 Hz (Grace and Bunney, 1984b; Hyland et al., 2002). During goal-directed behaviors, tonic firing is interrupted by brief, high-frequency bursts of action potentials (APs; Schultz et al., 1997; Schultz, 2006; Cohen et al., 2012) that at the cellular level are driven largely by excitatory synaptic inputs with a key role for NMDA receptors (NMDARs; Overton and Clark, 1992; Kuznetsov et al., 2006; Deister et al., 2009; Zweifel et al., 2009). More sustained increases in tonic firing occur in response to neuromodulators such as nicotine (Zhang et al., 2009; Li et al., 2011) or cannabinoids (French et al., 1997). It is believed that the tonic firing of dopamine neurons controls the resting concentration of dopamine in target areas (e.g., striatum) within a narrow range relative to the large, phasic dopamine signals associated with burst firing (Gonon, 1988). However, it is unknown whether the rate of tonic firing influences synaptically driven burst firing and how synaptic and intrinsic conductances respond to sustained increases in background tonic firing.
Action potential backpropagation provides a mechanism for ongoing somatic activity to influence dendritically located conductances (Stuart et al., 1997; Waters et al., 2005). Direct dendritic recordings in SNc neurons have shown that backpropagating APs (bAPs) are supported by a high-density of Na+ channels and reliably invade the dendrites with little attenuation in amplitude (Häusser et al., 1995; Gentet and Williams, 2007). Successful backpropagation leads to dendritic Ca2+ influx which may trigger plasticity (Harnett et al., 2009) and the dendritic release of dopamine (Beckstead et al., 2004; Ford et al., 2010). Interestingly, carbon fiber experiments show that the somatodendritic release of dopamine occurs in a steeply frequency-dependent manner when evoked by trains of tonic stimuli between 1 and 10 Hz (Rice et al., 1997). Therefore, it is possible that dendritic Ca2+ influx may exhibit a similar sensitivity to small changes in the tonic firing rate, however, this issue has not been examined.
Here we test the influence of tonic firing rate on dendritic Ca2+ signaling and synaptically driven burst firing in dopamine neurons using two-photon Ca2+ imaging. Increasing the tonic firing rate resulted in an unexpected supralinear increase in the dendritic Ca2+ signal. In addition, we find that burst firing in response to local stimulation of excitatory synapses is enhanced at elevated rates of tonic firing in an NMDAR-dependent manner. Therefore, these results reveal a previously unrecognized role of background firing rate in tuning the excitability of dendrites, dendritic Ca2+ signaling, and synaptic gain in dopamine neurons.
Materials and Methods
Slice preparation.
Sagittal brain slices containing SNc were prepared from postnatal day 14–21 Swiss Webster mice of either sex. Animals were anesthetized with isoflurane and swiftly decapitated. Brains were quickly removed and placed in ice-cold slicing solution containing the following (in mm): 250 glycerol, 2.5 KCl, 2 MgCl2, 2 CaCl2, 1.2 NaH2PO4, 10 HEPES, 21 NaHCO3, 5 glucose, bubbled with 95/5% O2/CO2. Slices were cut (300 μm thick) and incubated for 30 min at 34°C in artificial CSF (ACSF) containing the following (in mm): 125 NaCl, 25 NaHCO3, 1.25 NaH2PO4, 3.5 KCl, 1 MgCl2, 2 CaCl2, and 10 glucose, bubbled with 95/5% O2/CO2. Slices were then stored at room temperature until time of use.
Electrophysiological recording.
Slices were placed into a recording chamber and perfused continuously with warm ACSF (32−34°C). Dopamine neurons were targeted primarily by their location within the SNc. Other criteria included the presence of slow pacemaking (<5 Hz) during cell-attached or whole-cell recordings, broad APs (halfwidth >1.35 ms) and prominent voltage sag in response to negative current injection, associated with hyperpolarization-activated cation current (IH). Current-clamp and voltage-clamp recordings were made with a Multiclamp 700B amplifier and digitized with a Digidata 1440A (Molecular Devices). Low-resistance patch electrodes (2–4 MΩ) were pulled from filamented borosilicate glass. In voltage-clamp recordings, pipette series resistance was compensated by 70–80% and was monitored throughout the experiment. Recordings were terminated if series resistance changed by >20%. Current-clamp recordings were bridge balanced and monitored frequently throughout the experiment. Accurate bridge balance was achieved by adjusting the resistance of the Multiclamp 700B bridge circuit to minimize the instantaneous voltage change in response to a negative current injection. Internal recording solution contained the following (in mm): 122 K methanesulfonate, 9 NaCl, 1.8 MgCl2, 4 Mg-ATP, 0.3 Na-GTP, 14 phosphocreatine, 10 HEPES, 0.3 Fluo-5F (KD = ∼ 2.3 μm) and 0.05 AlexaFluor 594 hydrazide adjusted to a pH value of 7.35 with NaOH.
Two-photon laser scanning microscopy and glutamate uncaging.
Imaging experiments were performed using a custom two-photon microscope from Prairie Technologies along with a Mai Tai ultrafast Ti:Sapphire laser (Spectra-Physics) tuned to 810 nm. Cells were imaged using a 40×, 0.8 NA objective (Olympus). Fluorescence was split into red and green channels using a 575 nm dichroic longpass mirror and passed through 607/45 nm and 525/70 nm barrier filters before being detected by multi-alkali photomultiplier tubes (Hamamatsu). Ca2+ imaging was initiated 15–20 min after whole-cell break in. Linescan imaging of dendritic Ca2+ was performed at 30 s intervals. Ca2+ imaging data are presented as G/GS and were quantified as changes in green fluorescence divided by red fluorescence (G/R), normalized to GS/R × 100%. GS/R was measured by imaging a pipette filled with internal recording solution plus saturating Ca2+ (2 mm CaCl2) placed directly above the slice at the end of experiment (Yasuda et al., 2004).
Simultaneous glutamate uncaging experiments were performed using a second Mai Tai laser tuned to 725 nm with an uncaging pulse width of 500 μs. External solutions for glutamate uncaging experiments contained 3 mm 4-methoxy-7-nitroindolinyl-caged-l-glutamate (MNI-glutamate; Tocris Bioscience), 500 nm TTX, 10 μm nifedipine and 10 μm d-serine to prevent NMDAR rundown. Solutions were recirculated to conserve MNI-glutamate (volume = 10 ml).
Local extracellular stimulation.
Local stimulation of dendritically located synapses was performed using bipolar electrodes placed in theta glass pipettes filled with ACSF (tip diameter ∼ 5 μm). Electrodes were placed within 10 μm of an AlexaFluor 594-labeled dendrite. To increase the tonic firing rate, stimulation was performed at 20 Hz for 6 s and dendritic Ca2+ was imaged during the final 3 s of stimulation. To evoke bursts of action potentials, stimulation was performed at 100 Hz for 200 ms. Stimulus intensity was set to 15–45 V with 0.5 ms pulse duration using an Iso-Flex stimulus isolator (AMPI). Picrotoxin (50 μm), CGP 55845 hydrochloride (1 μm), sulpiride (1 μm), SCH 39166 hydrobromide (1 μm), and LY 341495 (1 μm) were added to ACSF to block activity of GABAA, GABAB, D2 dopamine, D1 dopamine, and group II metabotropic glutamate receptors.
Data analysis.
Ca2+ imaging data were quantified using ImageJ to measure fluorescence intensities and further analyzed using custom routines written in Igor Pro (Wavemetrics). The maximal amplitude of AP-evoked Ca2+ transients was measured as the average value in a 5 ms window around the peak Ca2+ signal. AP-evoked Ca2+ transients were fit by the equation:
 |
The amplitude of Ca2+ signals evoked by a burst of APs was measured as the average signal intensity during the last 100 ms of a 300 ms current injection. Z-stacks of the cell were acquired at the end of each experiment. A maximum intensity projection was used to measure the distances of dendritic Ca2+ imaging from the soma.
Nonspike voltage was taken as an average of the middle 60% of the interspike interval. All statistics are given as mean ± SEM. The liquid junction potential between the internal solution and bath solution measured −8 mV. The reported voltages have not been junction potential corrected.
Results
Reliable backpropagation into dendrites during pacemaking in dopaminergic neurons
SNc neurons recorded in brain slices fire spontaneously at low rates of 1–4 Hz, called “pacemaking,” resulting in rhythmic backpropagation of APs throughout the dendrites. We tested the effect of bAPs during pacemaking on dendritic Ca2+ signaling in SNc neurons. Previous work in CA1 pyramidal neurons indicates that dendritic Ca2+ transients mostly reflect the height of bAPs rather than changes in spike width (Magee and Johnston, 1997; Gasparini et al., 2007). Using two-photon laser scanning microscopy, we imaged dendritic Ca2+ influx by filling SNc neurons with a Ca2+-sensitive dye, Fluo 5F, loaded into the patch pipette. In proximal dendrites (<100 μm), a clearly definable peak in the dendritic Ca2+ signal accompanied each somatic AP (Fig. 1A,B). The one-to-one correlation between somatic APs and dendritic Ca2+ transients was observed throughout every recording during pacemaking. A similar observation was made in more distal dendritic regions (Fig. 1A,C). Measuring dendritic Ca2+ transients in a population of cells (31 dendrites, 20 cells), the average AP-evoked Ca2+ signal attenuated little with distance, even beyond 400 μm away from the soma (Fig. 1D). Therefore, together with previous work using direct dendritic recordings (Häusser et al., 1995; Gentet and Williams, 2007), our results show that APs backpropagate reliably throughout the distal dendrites during low-frequency tonic firing in SNc neurons.
Figure 1.
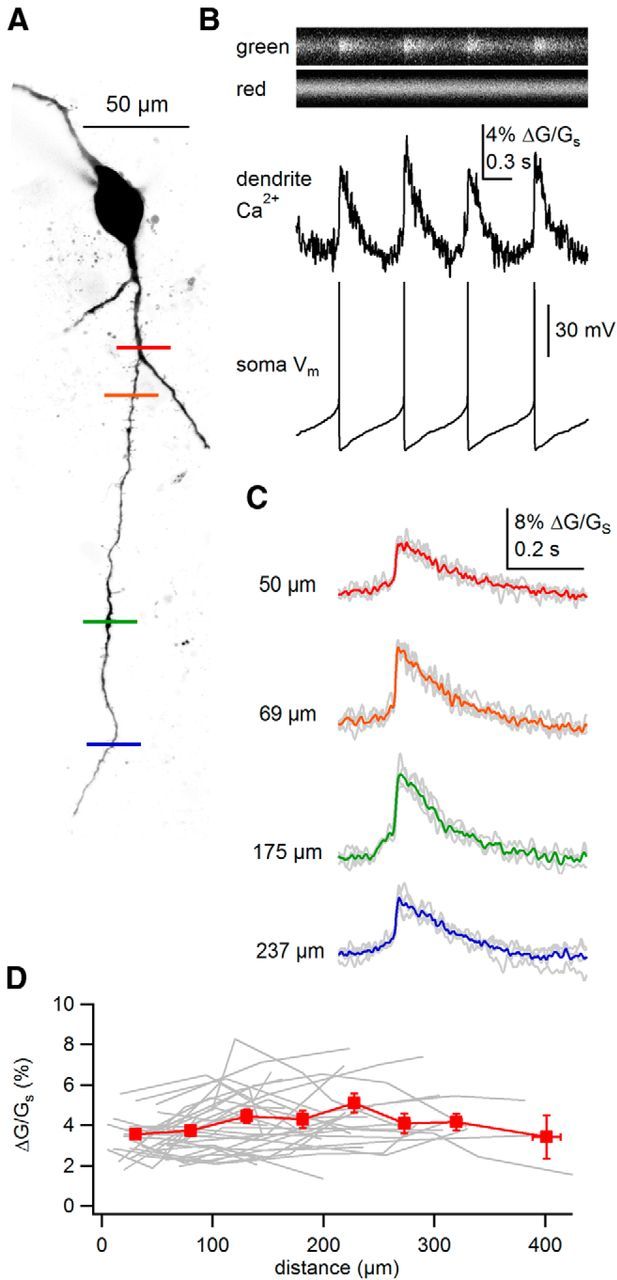
Backpropagating action potentials evoke Ca2+ signals throughout the dendrites of SNc dopamine neurons during pacemaking. A, Maximum intensity projection of a typical SNc dopamine neuron visualized using AlexaFluor 594. Sites of linescans are indicated by colored bars across the dendrite. B, Example linescan and dendritic Ca2+ signal measured at location of the red bar in A and simultaneously recorded somatic voltage. C, AP-evoked dendritic Ca2+ transients measured at multiple distances from the soma. Single Ca2+ transients are shown in gray. The average AP-evoked Ca2+ signals are colored according to bars shown in A. D, Plot of amplitudes of AP-evoked Ca2+ transients against distances from the soma. Data for individual dendrites are plotted in gray. Binned averages and SEM are plotted in red.
Supralinear dendritic Ca2+-influx during synaptically driven increases in firing rate
Backpropagating action potentials increase dendritic Ca2+ in a rate-dependent manner that may be critical for Ca2+-dependent processes, such as the somatodendritic release of dopamine (Rice et al., 1997; Beckstead et al., 2004). We measured backpropagation-evoked dendritic Ca2+ signals over a range of firing rates (0.6–6.2 Hz), using local stimulation of excitatory synaptic inputs to increase the rate of tonic firing. A potential confounding factor in this approach is that stimulation of excitatory synaptic inputs will result in NMDA receptor-mediated Ca2+ influx which may complicate the interpretation of dendritically recorded Ca2+ signals. Therefore, to examine the influence of firing rate on intrinsic conductances alone, we recorded Ca2+ signals in a dendrite contralateral to the site of stimulation where the contribution from synaptic Ca2+ sources is likely to be small (Fig. 2A). Excitatory synaptic inputs were stimulated for 6 s at 20 Hz and the contralateral dendrite was imaged during the final 3 s of the stimulus train when firing had settled to a relatively constant rate. We then tested firing at higher rates in interleaved trials by adjusting the voltage of pulses delivered through our local stimulation electrode.
Figure 2.

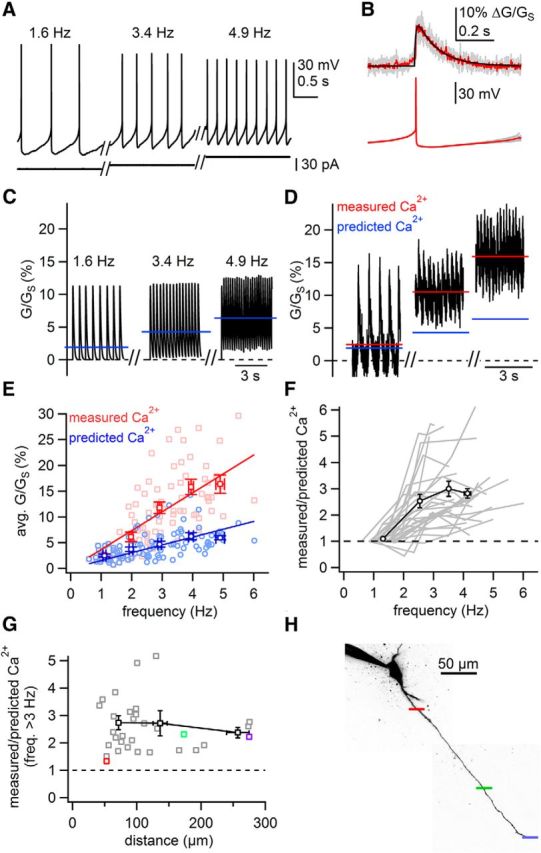
Fast tonic firing evoked by synaptic stimulation results in a supralinear increase in dendritic Ca2+ signals. A, Example neuron imaged by AlexaFluor 594 (red) overlaid with Dodt contrast image to visualize placement of stimulation electrode. B, Somatically recorded firing during pacemaking, and after low and high intensity stimulation at 20 Hz for 6 s. Stimulus artifacts have been digitally removed for clarity. C, Predicted linear Ca2+ signals for firing patterns shown in B. Inset, Average spontaneous AP-evoked Ca2+ transient and fit (black trace) used to generate linear predictions. Blue lines indicate the average values for predicted waveforms. D, “Measured” dendritic Ca2+ signals imaged during firing shown in B. Red lines indicate the average value of measured Ca2+ signal. E, Summary plot of measured (red) and predicted (blue) Ca2+ signals against the frequency of tonic firing. Light symbols are individual points; dark symbols are averages and SEM binned according to frequency. The slope of the line of best fit for measured Ca2+ versus frequency (red line) was 6.2% G/GS per Hz. The slope of the line for predicted Ca2+ versus frequency (blue line) was 1.8% G/GS per Hz. F, Plot of the ratio of measured Ca2+ to predicted Ca2+ against firing rate. Gray lines represent data from individual dendrites. Black symbols represent averaged data for all dendrites binned according to frequency. G, Synaptic Ca2+ influx recorded near the site of stimulation (green) and on a contralateral dendrite (purple) in response to synaptic stimulation of a voltage-clamped cell (−50 mV). Average synaptic currents are shown as black traces. H, Plot of amplitude of synaptic Ca2+ influx versus distance from the stimulation electrode for both ipsilateral (green) and contralateral (purple) dendrites. Gray lines connect points from same cell. Black line is exponential fit for all points; length constant = 20.1 μm.
Figure 2D shows examples of dendritic Ca2+ signals recorded both during spontaneous firing, and after low and high-frequency stimulation. In this cell, we found that a relatively small increase of the firing rate from 2 to 4.1 Hz led to an unexpectedly large increase in the average the dendritic Ca2+ signal. A moderate increase in the recorded Ca2+ signal is to be expected due to temporal summation of Ca2+ at higher firing rates. To estimate the amount of cytoplasmic calcium that is expected to accumulate during high-frequency tonic firing (Helmchen et al., 1996; Scheuss et al., 2006), we constructed linear predictions of the Ca2+ signals at low and high tonic frequencies.
To generate the predicted Ca2+ signals, we fit AP-evoked Ca2+ signals imaged during spontaneous firing (0.7–2.4 Hz), both rising and decay phases, with bi-exponential functions (Fig. 2C, inset). Next, we constructed predicted Ca2+ signals based on linear summation of the fit, where the placement of fits matched the timing of somatic APs (Fig. 2C, black traces). Using this method, the predicted Ca2+ signal represents the signal expected in the absence of backpropagation failures (Koester and Sakmann, 2000; Brenowitz and Regehr, 2007).
Surprisingly, at elevated tonic firing rates, dendritic Ca2+ signals were substantially larger than predicted signals. In the example cell shown in Figure 2, raising the firing rate just slightly from 2.0 to 4.1 Hz, the measured Ca2+ signal increased to values >2.5 times larger than the predicted Ca2+ signal (Fig. 2C,D). Across a population of cells, dendritic Ca2+ signals during tonic firing >3 Hz (3–6.2 Hz) were 3.90 ± 0.51-fold greater than predicted based on linear predictions (Fig. 2E,F; paired t test, measured vs predicted 2.5–3.5 Hz, p < 1e − 5; 3.5–4.5 Hz, p < 1e − 5; 4.5–6.2 Hz, p < 1e − 5; n = 10–18 measurements, 17 dendrites). Therefore, Ca2+ influx during tonic firing at elevated rates exceeded linear predictions, and thus increases “supralinearly.”
To test our assumption that synaptic Ca2+ influx contributed minimally to signals recorded in the contralateral dendrites, we measured Ca2+ influx in response to synaptic stimulation in cells voltage-clamped at −50 mV. Synaptic stimulation evoked substantial Ca2+ influx into the region of the ipsilateral dendrite nearest the stimulating electrode (Fig. 2G, green trace), whereas there was no detectable Ca2+ influx into the contralateral dendrite (Fig. 2G, purple trace). Summary data (Fig. 2H) show that the magnitude synaptic Ca2+ influx falls off rapidly with distance from the stimulating electrode. Therefore, these data suggest that Ca2+ supralinearity we observe is likely due to intrinsic rather than synaptic conductances.
Supralinear dendritic Ca2+-influx arises from intrinsic conductances throughout the dendrite
As an alternative approach to test whether fast tonic firing results in supralinear Ca2+ influx originating from intrinsic conductances, we altered the tonic firing rate by adjustment of holding current injected via the somatic patch pipette (Fig. 3A). We fit AP-evoked Ca2+ signals imaged during slow tonic firing (<2.0 Hz) as before (Fig. 3B), and constructed predicted Ca2+ signals by linear summation of the fit according the timing of APs (Fig. 3C). During low-frequency tonic firing (<2.0 Hz), there was excellent agreement between the values from measured and predicted signals averaged over 3 s (paired t test, p = 0.11, n = 32), indicating that the predicted values based on fits were accurate.
Figure 3.
Fast tonic firing evoked by somatic current injection results in a supralinear increase in dendritic Ca2+ signals. A, Example traces of tonic firing. Rates were adjusted with holding current. B, AP-evoked Ca2+ signals (93 μm from soma) during 1.6 Hz tonic firing were averaged and fit with 2 rising and 2 falling exponentials (individual and averaged traces shown in gray and red, fit shown in black). Somatic APs are shown below. C, Predicted Ca2+ signals (black) were generated for the firing rates displayed in A. Blue lines represent the average values of the predicted Ca2+ signals. D, Dendritic Ca2+ signals (black) recorded at the firing rates displayed in A. Red lines indicate the average Ca2+ signal over the course of the scan. E, Summary plot of measured (red) and predicted (blue) Ca2+ signals against the frequency of tonic firing. Light symbols are individual points; dark symbols are averages and SEM binned according to frequency. Lines are lines of best fit to each dataset. The slope of the line of best fit for measured Ca2+ versus frequency was 3.7% G/GS per Hz. The slope of the line for predicted Ca2+ versus frequency was 1.5% G/GS per Hz. Predicted data varies from the line of best fit due to variability in the size and kinetics of the AP-evoked Ca2+ transients between cells. F, Plot of the ratio of measured Ca2+ to predicted Ca2+ against firing rate. Gray lines represent data from individual dendrites. Black line and symbols represent averages and SEM for all dendrites binned according to frequency. G, Plot of the average ratio of measured Ca2+ to predicted Ca2+ for rates >3 Hz against the distance from the soma at which dendritic Ca2+ was measured. Gray points represent individual recordings; black symbols represent averages binned according to distance. H, Example of a cell in which supralinear dendritic Ca2+ signaling was measured at multiple distances from the soma. Colored bars represent sites of linescans and correspond to points plotted in G.
As with synaptic stimulation, dendritic Ca2+ signals were substantially larger than predicted signals at elevated tonic firing rates. In the example cell shown in Figure 3, the measured Ca2+ signal during 1.6 Hz firing was almost identical to the predicted signal. However, raising the firing rate just slightly to 3.4 Hz, the measured Ca2+ signal increased to a value >2.5 times larger than the predicted Ca2+ signal (Fig. 3C,D). Across a population of cells, dendritic Ca2+ signals during tonic firing >3 Hz (3–6.0 Hz) were 2.86 ± 0.19-fold greater than linear predictions (Fig. 2E,F; paired t test, measured vs predicted, 2.5–3.5 Hz, p < 1e − 5; 3.5–4.5 Hz, p < 1e − 5; 4.5–6 Hz, p = 0.00014; n = 10–24 measurements, 28 dendrites). Therefore, supralinear Ca2+ influx during tonic firing at elevated rates does not require synaptic stimulation and results from the intrinsic conductances of SNc dopamine neurons.
To ensure that this result was not biased by the injection of somatic current, we tested for the presence of the Ca2+ supralinearity in cells that fired spontaneously at high rates. We found a moderate positive correlation between the ratio of measured/predicted Ca2+ and spontaneous firing rate (Pearson's r = 0.53418; p = 0.0034; n = 28). We also found a significant difference between measured and predicted values for cells that fire spontaneously >2.5 Hz (G/GS, measured vs predicted, 10.6 ± 2.7% vs 3.8 ± 0.6%, n = 6, p = 0.041 paired t test).
Last, we tested for the presence of the Ca2+ supralinearity at distances throughout the dendrites (42–275 μm from the soma). Interestingly, we found robust Ca2+ supralinearity during fast tonic firing throughout the entire dendritic tree (Fig. 3G,H). The ratio of measured/predicted Ca2+ was 2.75 ± 0.25 (n = 21) in the proximal dendrites (<100 μm one sample t test vs 1, p < 1e − 5), 2.71 ± 0.46 (n = 9) in the intermediate (100–200 μm; p < 1e − 5) and 2.37 ± 0.19 (n = 4) in the distal dendrites (200–275 μm; p = 0.0054). Therefore, these data demonstrate that Ca2+ influx increases supralinearly with changes in firing rate, and that the Ca2+ supralinearity is present throughout the dendrites of SNc dopamine neurons.
Supralinear Ca2+ signaling requires subthreshold depolarization
Two major sources of Ca2+ entering SNc neurons are AP-evoked Ca2+ and Ca2+ entering at subthreshold voltages. Studies in dissociated neurons show that ∼80% of the Ca2+ influx during pacemaking occurs during APs (Puopolo et al., 2007). Therefore, we tested the possibility that AP-evoked Ca2+ contributes to the frequency-dependent Ca2+ supralinearity. We held neurons steadily at −65 mV with negative current to prevent activation of low-threshold Ca2+ channels (Fig. 4). We then delivered short current steps to evoke APs over a range of frequencies (2–10 Hz) while recording dendritic Ca2+.
Figure 4.

Linear dendritic Ca2+ signaling when APs are evoked from a fixed membrane potential. A, Example of measured (red) and predicted (black) dendritic Ca2+ signals (top), somatic voltages (middle), and current injections (bottom) to elicit spiking at 2, 4, and 6 Hz from a fixed membrane potential (−65 mV). Dashed line in Ca2+ recordings indicates baseline Ca2+ level. Dashed line in somatic voltage recordings indicates −60 mV. B, Plot of measured and predicted Ca2+ signals against firing rate. Points represent average and SEM, and lines are of best fit to all individual data points (individual data points not shown for clarity). Black symbols represent average Ca2+ signals measured during tonic firing (replotted from Fig. 3E). Red and blue symbols represent measured and predicted Ca2+ signals when APs were evoked from a fixed membrane potential predictions. The slopes of lines of best fit are as follows: control, 3.7% G/Gs per Hz; fixed Vm measured, 1.4% G/Gs per Hz; fixed Vm predicted, 1.6% G/Gs per Hz. C, Plot of the ratio of measured Ca2+ signals to predicted Ca2+ signals against firing rate. Black points represent averages and SEM for Ca2+ signals measured during tonic firing (replotted from Fig. 3F). Pink lines represent data for individual dendrites when firing was evoked from a fixed membrane voltage. Red points represent averages and SEM at each frequency. D, Plot of the average ratio of measured and predicted Ca2+ signals at firing rates >3 Hz measured in proximal and distal dendrites during tonic firing (gray) or when APs were evoked from fixed voltages (pink). Error bars are SEM.
Interestingly, we found little difference between measured and predicted signals when APs were evoked from fixed potentials (Fig. 4A). Across cells, we averaged Ca2+ signals near steady-state (last 0.3 s of train) then plotted these values against the firing rate (Fig. 4B). There was close agreement between measured and predicted Ca2+ signals when APs were evoked from fixed voltages (student's paired t test: 4 Hz, p = 0.39; 5 Hz, p = 0.48; 6 Hz, p = 0.88; 8 Hz, p = 0.55; 10 Hz, p = 0.88, n = 3–10 for each frequency, 11 dendrites, 8 cells). The ratio of these values remained near 1 across all frequencies tested (one sample t test, ratio of measured/predicted Ca, 4 Hz, p = 0.45; 5 Hz, p = 0.48; 6 Hz, p = 0.67; 8 Hz, p = 0.61; 10 Hz, p = 0.82, n = 3–10, 11 dendrites, 8 cells; Fig. 4C). Ca2+ signaling was linear during evoked spiking in both proximal and distal dendrites (Fig. 4D). Therefore, the frequency-dependent Ca2+ supralinearity was completely abolished when APs were evoked from fixed membrane potentials and was unlikely due to AP-evoked Ca2+.
Response of dendritic Ca2+ to subthreshold depolarization of the soma
Because the Ca2+ supralinearity was abolished when APs were evoked from a fixed membrane voltage, we predicted that activation of low-threshold Ca2+ channels is critical to the Ca2+ supralinearity. We hypothesized that increases in firing rate are accompanied by membrane depolarization and activation of subthreshold Ca2+ channels. Consistent with this idea, increasing the firing rate from 1 to 5 Hz led to depolarization of the nonspike membrane voltage by 8.0 ± 1.7 mV (average voltage at 0.5–1.5 Hz, −59.4 ± 0.8 mV; 4.5–5.5 Hz, −51.4 ± 0.9 mV; p = 8.3e − 8, n = 14 neurons, unpaired t test (Fig. 5A,B). We observe a similar depolarization when comparing the average nonspike voltage at the lowest and highest frequencies measured for each cell (−60.4 ± 1.0 mV at 0.97 ± 0.1 Hz vs −52.1 ± 0.7 mV at 4.6 ± 0.2 Hz, p = 4.5e − 9, n = 14, paired t test).
Figure 5.
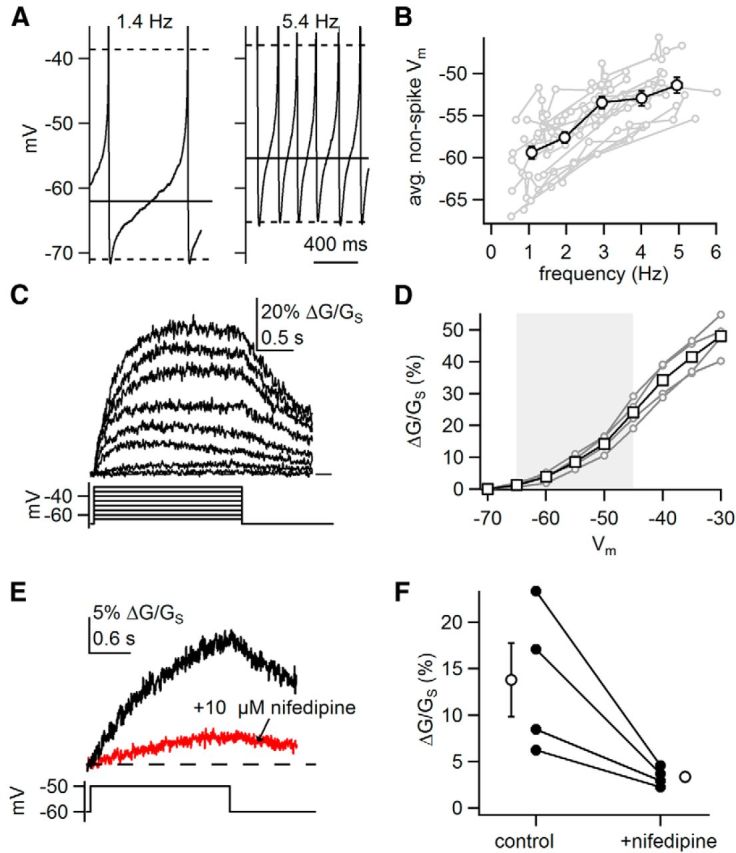
Subthreshold depolarization of somatic Vm increases dendritic Ca2+. A, Example of somatic voltage recordings at a low (1.4 Hz) and high (5.4 Hz) rates of firing. Dashed lines represent average threshold of AP generation and average trough. Solid lines indicate average nonspike membrane voltage. B, Plot of the average nonspike membrane voltage against tonic firing rate for individual cells (gray) and average values ± SEM for all cells binned according to frequency (black). C, Example of dendritic Ca2+ signals (top) recorded in response to somatic voltage steps from −70 mV (bottom). D, Plot of dendritic Ca2+ influx versus voltage for four dendrites (gray) and average signals ± SEM (black). Gray box represents subthreshold voltage range. E, Example of Ca2+ signals recorded in response to a voltage step from −60 to −50 mV before and after application of nifedipine. F, Amplitudes of sustained dendritic Ca2+ signals evoked by a voltage step from −60 to −50 mV before and after application of nifedipine.
The depolarization observed at high rates occurs in the subthreshold voltage range, where Ca2+ conductances are small in amplitude (Durante et al., 2004; Puopolo et al., 2007). Therefore, we asked whether these relatively modest subthreshold depolarizations produce substantial Ca2+ influx. We blocked spiking with application of 500 nm TTX and delivered a family of somatic voltage steps covering the subthreshold voltage range (from −70 mV). Comparing voltages that roughly correspond to the depolarization observed between low- and high-frequency firing, we observed significantly more Ca2+ influx during a step to −50 mV than to −60 mV (ΔG/GS, 14.2 ± 1.44% at −50 mV vs 3.81 ± 0.721% at −60 mV, n = 4, p = 0.002, paired t test; Fig. 5C,D). This demonstrates that substantial Ca2+ influx results from subthreshold depolarization, even in the absence of APs.
This observation is in accord with the known expression of CaV1.3 L-type Ca2+ channels, which display an atypically hyperpolarized voltage dependence of activation and are steeply voltage-dependent within the subthreshold voltage range (Xu and Lipscombe, 2001). Accordingly, the L-type Ca2+ channel antagonist nifedipine (10 μm) dramatically decreased the amplitude of dendritic Ca2+ signals, resulting in a 72.1 ± 4.3% block of signals evoked by voltage steps from −60 to −50 mV (n = 4; Fig. 5E,F). These results show that in SNc dopamine neurons, relatively modest depolarizations of the soma lead to substantial dendritic Ca2+ influx through activation of L-type Ca2+ channels.
Ca2+ supralinearity is due to L-type Ca2+ channels
Based on our results, it is likely that L-type Ca2+ channels contribute to the Ca2+ supralinearity observed during fast tonic firing in SNc dopamine neurons. To test this, we pretreated slices with 10 μm nifedipine for 10–20 min (n = 5) or acutely applied 1 μm nifedipine (n = 5) and recorded dendritic Ca2+ signals during tonic firing across a range of frequencies (Fig. 6). Focusing first on the somatic membrane potential, depolarization of the nonspike voltage was similar in magnitude to control cells (−57.0 ± 0.75 mV at 0.5–1.5 Hz vs 49.7 ± 1.0 mV at 4.5–5.5 Hz; p = 8.0e-5, n = 5; Fig. 6A). Across all cells, we found a modest reduction (29.7% decrease) in AP-evoked Ca2+ signals in the presence of nifedipine (5.8 ± 0.5% vs 4.1 ± 0.7%, control vs nifedipine, p = 0.044, unpaired t test). By contrast, in the presence of nifedipine total Ca2+ signals at elevated firing rates (3.5–4.5 Hz) were less than half the size of corresponding control Ca2+ signals (15.8 ± 1.5% vs 7.7 ± 1.7%, p = 0.00015, unpaired t test; Fig. 6E). Furthermore, Ca2+ signals measured in the presence of nifedipine more closely resembled linear predictions (Fig. 6C–F). The ratio of the measured/predicted Ca2+ signals was significantly reduced in the presence of nifedipine (control = 2.86 ± 0.19, n = 34; nifedipine = 1.88 ± 0.18, n = 10; p = 0.011, unpaired t test. For acute application experiments, the ratio of measured/predicted Ca2+ was reduced by 44.6 ± 3.3% (measured/predicted ratio at >3 Hz, control, 4.1 ± 0.5 vs nifedipine, 2.2 ± 0.2, n = 5; p = 0.0069; Fig. 6C–G). Altogether, these results suggest that L-type channels are a primary source of the Ca2+ supralinearity.
Figure 6.

L-type Ca2+ channels contribute to supralinear dendritic Ca2+ signals. A, The firing rate of dopamine neurons was altered by injection of holding current in the presence of nifedipine. B, AP-evoked Ca2+ signals during 1.3 Hz firing were averaged and fit as in Figure 3B. C, Predicted Ca2+ signals (black) were generated for the firing rates displayed in A. Blue lines represent the average values of the predicted Ca2+ signals. D, Dendritic Ca2+ signals (black) recorded at the firing rates displayed in A. Red lines indicate the average Ca2+ signal over the course of the scan. E, Summary plot of measured (red) and predicted (blue) Ca2+ signals plotted against the rate of tonic firing in the presence of nifedipine, and measured Ca2+ signals in control conditions (black). Light symbols are individual points; dark symbols are binned averages and SEM for all dendrites. Lines are lines of best fit to each dataset. The slopes of the lines of best fit were as follows: control measured data = 3.7% G/Gs per Hz; nifedipine-treated measured data = 2.2% G/Gs per Hz; nifedipine-treated predicted data = 1.3% G/Gs per Hz. Predicted data varies from the line of best fit due to variability in the size and kinetics of the AP-evoked Ca2+ transients between cells. F, Plot of the ratio of measured/predicted Ca2+ signals against firing rate. Pink lines represent data from individual nifedipine-treated dendrites. Red line represents binned averages and SEM for nifedipine data. Black line represents data for control neurons (replotted from Fig. 3F). G, Average ratio of measured/predicted Ca2+ signals for trials during which the frequency of tonic firing >3 Hz. Error bars are SEM. Individual points shown in white. Lines between control and nifedipine points represent paired data. H, Average ratio of measured/predicted Ca2+ signals before and after application CPA. Open symbols represent mean and SEM.
It is possible that AP broadening contributes to additional dendritic Ca2+ influx as was shown in cortical pyramidal neurons (Kampa and Stuart, 2006). Indeed, we observe a small increase in AP width at elevated tonic firing rates. However, the extent of AP broadening was comparable in control (AP width at half-max, 1.7 ± 0.05 ms at <1.5 Hz vs 2.2 ± 0.1 ms at >4 Hz, n = 14; p = 0.001) and nifedipine-treated cells (1.8 ± 0.07 ms at <1.5 Hz vs 2.4 ± 0.2 ms at >4 Hz, n = 5; p = 0.012). Because nifedipine treatment did not completely abolish the Ca2+ supralinearity, it is possible that spike broadening may partially contribute. However, these results are consistent with the idea that AP broadening is not the primary mechanism of supralinear dendritic Ca2+ signaling in SNc dopamine neurons.
Dopamine neurons of the ventral tegmental area (VTA) display pacemaking similar to dopamine neurons in the SNc. However, in VTA dopamine neurons, the subthreshold currents that drive spontaneous activity are mediated primarily by Na+ conductances rather than Ca2+ conductances (Khaliq and Bean, 2010). Therefore, we predicted that Ca2+ signaling in dopamine neurons of the VTA would display a more linear relationship with firing rate than those of the SNc. In the VTA, measured Ca2+ signals closely resembled linear, predicted signals (paired t test of measured vs predicted Ca2+ signals: 1–2 Hz, p = 0.32; 2–3 Hz, p = 0.88; 3–4 Hz, p = 0.63; >4 Hz, p = 0.10; n = 3–9 for each frequency, 8 dendrites). Furthermore, the ratio between measured and predicted signals at elevated rates (>3 Hz) was significantly smaller in dopamine neurons of the VTA compared with those of the SNc (Fig. 6H) (ratio for SNc, 2.86 ± 0.19, n = 28; VTA, 1.53 ± 0.25, n = 8; p = 0.0025, unpaired t test). These data further suggest that supralinear Ca2+ signaling in the SNc is due to activation of low-threshold Ca2+ channels as tonic firing rate increases.
Past work in dopamine neurons has shown that bAPs lead to Ca2+-induced Ca2+ release from internal stores (Cui et al., 2007), which raises the question of whether Ca2+ stores contribute to the supralinearity shown here. To test this, we measured changes in dendritic Ca2+ signaling with increases in tonic firing rate following application of cyclopiazonic acid (CPA) to inhibit the sarcoendoplasmic reticulum Ca2+-ATPase (SERCA). Consistent with past studies (Cui et al., 2007), we observed a reduction in AP-evoked Ca2+ influx at low rates of tonic firing (<2 Hz) following application of CPA (35 ± 7.3% reduction in peak, n = 7). However, at elevated firing rates, we still observed dramatic, supralinear increases in total dendritic Ca2+ signals, comparable to control conditions. As a result, we observed an increase in the ratio of measured/predicted Ca2+ influx following application of CPA (Fig. 6H) (2.84 ± 0.43 to 4.54 ± 0.44, p = 0.038, paired t test). This is possibly because in addition to blocking Ca2+-induced Ca2+ release, inhibition of SERCA pumps impairs buffering of cytosolic Ca2+ during ongoing neuronal activity. Regardless, the presence of the Ca2+ supralinearity following antagonism of SERCA pumps demonstrates that Ca2+-induced Ca2+-release is not required for frequency-dependent Ca2+ supralinearity.
Supralinear dendritic Ca2+ signaling during burst firing
Dopamine neurons fire phasic high-frequency bursts of APs (>10 Hz) in response to reward-relevant stimuli (Grace and Bunney, 1984a; Overton and Clark, 1997; Schultz et al., 1997). We next asked whether SNc neurons display supralinear dendritic Ca2+ signaling during burst firing (Fig. 7). Bursts were evoked by current injections (100–200 pA) on a background of tonic firing (average burst rate, 21.3 ± 1.2 Hz, n = 8). Ca2+ signals recorded during the tonic firing preceding the burst were used to generate linear predictions of dendritic Ca2+ signals (Fig. 7A). Burst-evoked Ca2+ signals were similar in amplitude throughout the dendrite (Fig. 7B). Furthermore, Ca2+ influx evoked by burst firing was consistently supralinear at all distances tested (Fig. 7C,F; ratio of measured/predicted signals = 1.41 ± 0.08, n = 8).
Figure 7.
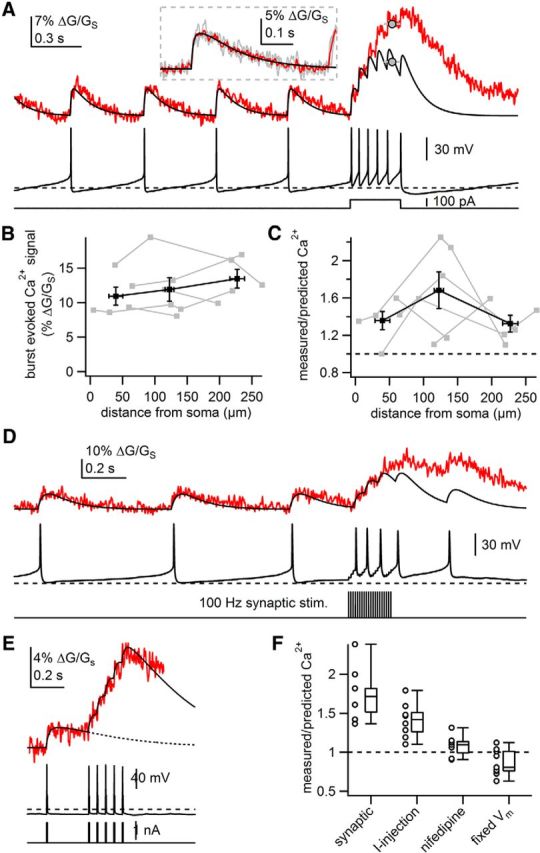
Bursts of APs generate supralinear dendritic Ca2+ signals. A, Example of measured dendritic Ca2+ (red) and linear predictions (black) during a burst of APs evoked by a 300 ms, 100 pA current injection into the soma. Dashed line in somatic voltage recording represents −60 mV. The amplitude of the dendritic Ca2+ influx in response to burst firing was measured as the average value between 200 and 300 ms of the somatic current injection, indicated by gray circles. Inset, AP-evoked Ca2+ transients during tonic firing (gray), average AP-evoked Ca2+ transient (red), and line of best fit to the average (black). B, Plot of amplitude of dendritic Ca2+ evoked by a burst of APs against the distance from the soma at which the Ca2+ signal was measured. Individual dendrites displayed in gray; binned averages and SEM displayed in black. C, Plot of the ratio of measured dendritic Ca2+ signal to predicted dendritic Ca2+ signal evoked by a burst against distance from the soma at which the Ca2+ signal was measured. Individual dendrites displayed in gray; binned averages and SEM displayed in black. D, Example of measured (red) and predicted (black) dendritic Ca2+ signals (top) during a burst of action potentials (middle), evoked by synaptic stimulation of a contralateral dendrite (bottom). E, Example of measured and predicted dendritic Ca2+ signals (top) in response to a burst of APs evoked from a fixed voltage (−65 mV, middle) by brief current injections (bottom). Dashed line in the top represents line of best fit to a single AP-evoked Ca2+ transient. F, Box plots of the ratio of measured/predicted Ca2+ signal in response to a burst of APs in indicated conditions. Middle lines represent median value, boxes indicate middle 50% of data, and whiskers indicate maximum and minimum values. Circles represent average ratio calculated for individual dendrites.
Generation of bursts in vivo takes place in response to excitatory synaptic input and may involve ionic mechanisms distinct from those mediating bursts evoked by somatic current injection (Paladini and Roeper, 2014). Therefore, we imaged dendritic Ca2+ signals during stimulation-evoked burst firing. Stimulation of excitatory synaptic inputs at 100 Hz for 200 ms on a background of tonic firing generated transient, high-frequency burst firing (average burst rate, 15.4 ± 0.6 Hz, n = 6) and concurrent subthreshold depolarization (Fig. 7D). Measurement of Ca2+ influx in the contralateral dendrites revealed that backpropagation of synaptically evoked bursts produces supralinear Ca2+ influx (ratio of measured/predicted signals = 1.77 ± 0.16; n = 6; Fig. 7D,F).
As with tonic firing, the Ca2+ supralinearity during burst firing may result from subthreshold depolarization and activation of L-type channels. Consistent with this hypothesis, bursts evoked from a fixed potential (−65 mV; 20 or 25 Hz) generated Ca2+ signals that were not supralinear (ratio of measured/predicted Ca2+ = 0.87 ± 0.06, n = 9, p = 8.5e − 5, unpaired t test vs control; Fig. 7E,F). Interestingly, Ca2+ signals in six of nine cells were sublinear, indicating that bAP failures may occur during high-frequency bursting. bAPs during high-frequency burst firing in CA1 pyramidal cells have been shown to fail due to accumulated Na+ channel inactivation (Jung et al., 1997). Last, nifedipine significantly reduced the supralinearity observed during current-evoked bursts (Fig. 7F; ratio of measured/predicted signals: 1.08 ± 0.05, n = 7; p = 0.0052, unpaired t test vs step current-evoked bursts). Therefore, much like fast tonic firing, phasic bursts lead to supralinear Ca2+ influx in the dendrites by activation of low-threshold L-type Ca2+ channels.
Strong electrotonic coupling of soma and dendrites
Motivated by the observation that small somatic depolarizations evoke significant dendritic Ca2+ influx (Fig. 4), we next tested the strength and reach of somatodendritic coupling in dopamine neurons. Past experiments using direct dendritic recordings (Häusser et al., 1995) suggest that tight electrotonic coupling exists between soma and dendrites of SNc neurons. As an alternative approach, we assayed the effect of the somatic membrane potential on synaptic conductances located along the dendrite using simultaneous two-photon glutamate uncaging and Ca2+ imaging. Slices were bathed in ACSF containing 3 mm MNI-glutamate. We blocked Na+-dependent APs and Ca2+-dependent subthreshold membrane oscillations by application of 500 nm TTX and 10 μm nifedipine. We could more reliably measure increases in dendritic Ca2+ and somatic EPSPs by uncaging at four spots along a ∼10 μm stretch of dendrite (0.5 ms pulse width, 1 ms interpulse interval; Fig. 8A,B). This paradigm was repeated during interleaved trials in which the somatic membrane potential was adjusted to −67, −57, or −47 mV with holding current (Fig. 8B).
Figure 8.
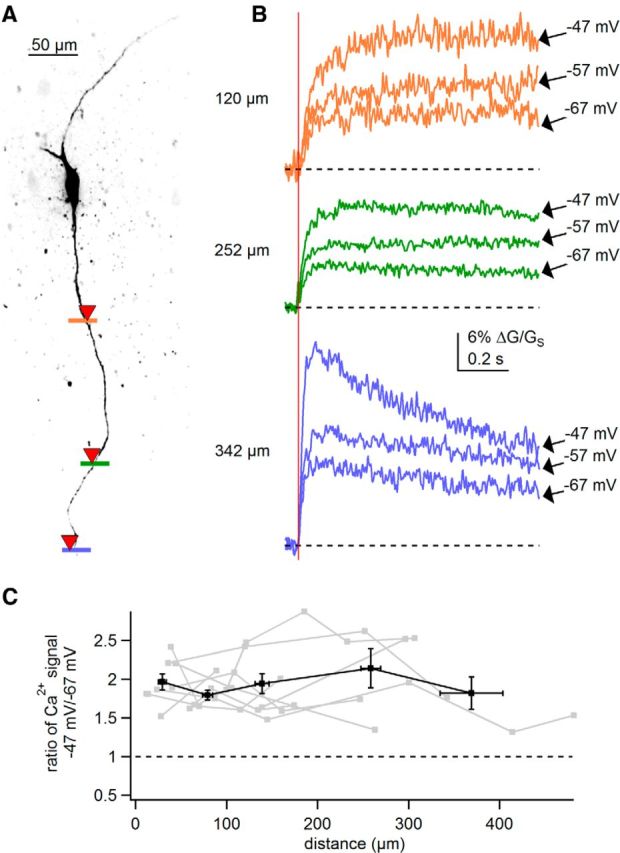
Depolarization of the soma enhances synaptic strength throughout the dendrites of SNc dopamine neurons. A, Maximum intensity projection of the recorded neuron. Colored bars represent sites of linescan Ca2+ imaging and glutamate uncaging (indicated by red inverted triangles). B, Dendritic Ca2+ signals evoked by two-photon glutamate uncaging (timing of uncaging indicated by red vertical line) at specified somatic voltages. Color of traces corresponds to sites of scans shown in A. Dashed lines represent baseline Ca2+ levels. C, Plot of the ratio of the uncaging-evoked dendritic Ca2+ signal at −47 mV to Ca2+ signal evoked at −67 mV against the distance from the soma. Gray plots represent individual dendrites; black plot represents averages and SEM binned according to distance.
An example experiment (Fig. 8B) shows Ca2+ signals evoked by glutamate uncaging at three different locations along the dendrite of a dopamine neuron. At a distance of 120 μm from the soma, we found that holding the soma at −47 mV dramatically increased in the amplitude of the uncaging-evoked dendritic Ca2+ signals relative to signals recorded at −67 mV. Remarkably, somatic depolarization enhanced uncaging-evoked Ca2+ signals in even more distal regions of the dendrite. At 252 or 342 μm away from the soma, somatic depolarization from −67 to −47 mV resulted in a more than twofold increase in uncaging-evoked Ca2+ signal. Because TTX and nifedipine were included in the external solution, enhancement of the uncaging-evoked Ca2+ signals at depolarized potentials is likely due solely to passive signal propagation and voltage-dependent Mg2+ unblock of NMDARs at the dendritic site of uncaging.
Plotting the ratio of the peak uncaging-evoked Ca2+ signals recorded at different somatic holding potentials in nine dendrites from six cells, we found that dendritic Ca2+ influx was between 1.3 and 2.9-fold greater when the soma was held at −47 mV than when held at −67 mV (Fig. 8C). This enhancement of glutamate-evoked dendritic Ca2+ influx by depolarization of the soma was observed throughout the distal dendrites, up to 480 μm from the soma (Fig. 8C). Ratios of Ca2+ signals are significantly >1 as determined by one-sample t test (0–50 μm, p = 2.9e − 5; 50–100 μm, p = 1.9e − 5; 100–200 μm, p = 1.3e − 5; 200–300 μm, p = 0.011; 300–480 μm, p = 0.017). This demonstrates that dendritic synaptic receptors are exquisitely sensitive to steady-state changes in the somatic membrane potential.
In a separate set of experiments, we measured dendritic Ca2+ influx in response to somatic step depolarizations and found that amplitude of dendritic Ca2+ signals was preserved with distance throughout the distal dendrites (Fig. 9A,B). Together, these results further emphasize the robust electrotonic coupling of the soma and dendrites of SNc dopaminergic neurons.
Figure 9.

Electrotonic coupling of soma and dendrites. A, Examples of dendritic Ca2+ signals (top) in response to somatic voltage steps (bottom) measured 76 and 235 μm from the soma. B, Plot of the amplitude of dendritic Ca2+ signal in response to a voltage step from −60 to −50 mV against the distance from the soma at which dendritic Ca2+ was measured. Individual dendrites plotted in gray. Averages and SEM for six cells binned according to distance plotted in black.
Tonic firing rate tunes the rate of NMDA receptor-mediated burst output
Dopamine neurons fire synaptically driven bursts on a background of tonic firing. Our results show that fast tonic firing in dopamine neurons is accompanied by steady depolarization of the nonspike voltage (Fig. 5A,B). Furthermore, subthreshold depolarization of the soma enhances NMDAR-mediated Ca2+ signals throughout the dendrite (Fig. 8). Combining these observations, we hypothesized that the tonic firing rate of dopamine neurons will influence the strength of synaptic inputs throughout the proximal and distal dendrites.
To test the interaction between tonic and burst firing, synaptic inputs were activated using small diameter theta-glass stimulation electrodes (∼5 μm tip diameter) placed within 10 μm of a dendrite, at distances between 57 and 194 μm from the soma (mean = 105 ± 16 μm from soma). Stimulating local inputs at 100 Hz for 200 ms routinely evoked bursts (>13 Hz) from tonically active neurons (Fig. 10A). We then tested the effect of background firing rate (from 0 to 6.5 Hz) on the strength of synaptically evoked burst responses.
Figure 10.
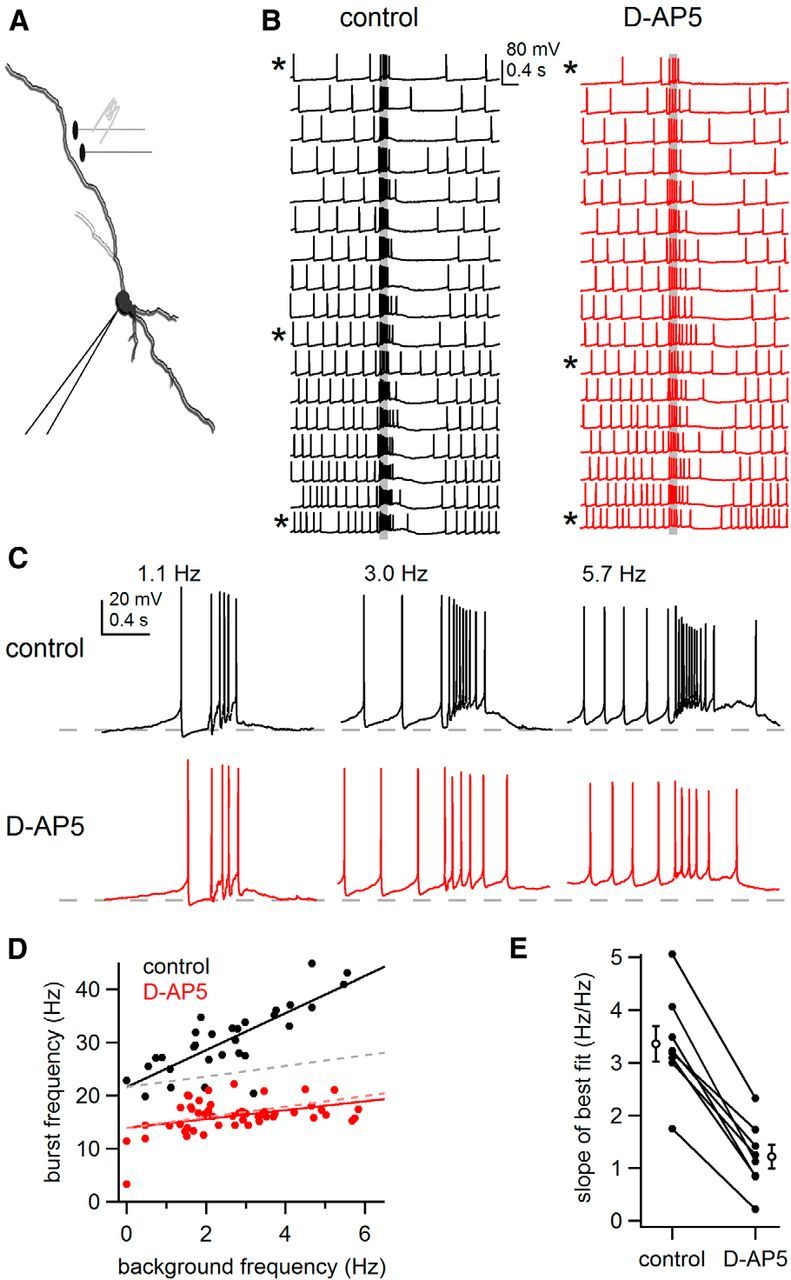
Elevation of background firing rate enhances synaptically evoked bursts. A, Schematic of experiment in which background firing rate was altered by tonic current injection at the soma while presynaptic inputs were stimulated (100 Hz, 200 ms) using a bipolar theta glass electrode. B, Example of somatic recordings of burst firing in response to local synaptic stimulation (indicated by gray bars) in control conditions (black traces, left) and after blockade of NMDA receptors (red traces, right). Traces are arranged by increasing background firing rate. Asterisks indicated traces examined in C. C, Examples of burst firing from B at indicated frequencies in control conditions and in the presence of D-AP5. Dashed lines indicate −60 mV. D, Plot of burst frequency versus background frequency in control conditions (black) and in the presence of D-AP5 (red) for the cell in B. Solid lines are lines of best fit to each condition. Dashed lines are theoretical plots in which every 1 Hz increase in background firing rate leads to a 1 Hz increase in burst firing rate. E, Summary plot of the slopes of the lines of best fit as in D for eight neurons, in control conditions and after application of D-AP5. Empty circles are mean ± SEM.
Figure 10B shows somatic voltage recordings from an example neuron arranged according the rate of background tonic firing. The rate of the synaptically driven burst responses dramatically increased when the rate of background firing was elevated (Fig. 10B,C). Specifically, synaptic stimulation during 1.1 Hz tonic firing resulted in a 21.5 Hz burst (Fig. 10C, left). However, the same synaptic stimulus during faster tonic firing at 5.7 Hz resulted in a ∼100% increase in the burst firing response to 43.1 Hz (Fig. 10C, right). A plot of the rate of burst responses against the range of background firing rates tested for this cell is provided in Figure 10D. The slope of the best linear fit to the data show that the burst firing response increased by 3.5 Hz for every 1 Hz increase in background firing rate.
Strikingly, the influence of the background firing rate on the burst firing rate was substantially reduced following blockade of NMDARs (50 μm D-AP5; Fig. 10B,C, red traces). This reduction in the burst response was even more clear in the plot of the burst versus background rates (Fig. 10D, red symbols), which shows a dramatic reduction in the slope to 0.84 Hz/Hz. Interestingly, the remaining burst output in the presence of D-AP5, presumably due to AMPA receptor mediated conductances, was still enhanced during firing at elevated background rates. In eight neurons, the relationship between burst and background tonic firing in the presence of D-AP5 was 1.22 ± 0.22 Hz/Hz, a significant decrease from 3.35 ± 0.33 Hz/Hz measured under control conditions (p = 2.0e − 5, paired t test; Fig. 10E). Here, the slope of 1 Hz/Hz (Fig. 10D, dashed lines) would be predicted under conditions where a fixed stimulus leads to a set increase in firing rate that is independent of background rate.
Last, the relationship between burst and tonic firing was observed during local stimulation of synapses in the distal dendrites. Synaptic stimulation of the distal dendrites (>100 μm) tended to evoke weaker burst firing or require stronger stimulus intensities, consistent with results from past studies (Blythe et al., 2009). Despite the reduced strength of bursting in the most distally stimulated recording (194 μm), increases in the background firing rate still enhanced synaptically driven burst responses (slope of burst to tonic fit, 3.19 Hz/Hz). Coupled with the results in Figure 8, showing that somatic depolarization enhances NMDAR-mediated Ca2+ signals throughout the distal dendrites, these results demonstrate that strong electrotonic coupling of the dendrites equalizes somatic influence over proximally and distally located synaptic inputs in dopamine neurons.
In total, these results demonstrate that the gain of synaptically driven burst firing is remarkably sensitive to the rate of background firing, which tunes the strength of burst output in a manner that depends upon NMDAR activation.
Discussion
The bulk of studies examining dendritic integration have focused on pyramidal neurons in either hippocampus or cortex. However, firing in midbrain dopamine neurons differs significantly from pyramidal neurons in an important way. Unlike pyramidal neurons that require synaptic input to drive cells past AP threshold, dopamine neurons fire spontaneously as a result of intrinsic conductances located in and around the soma. For this reason, EPSPs occur on a background of ongoing firing, and thus are more frequently influenced by AP-evoked conductances. Despite the importance of this question, relatively little is known about the functional role of background tonic firing in influencing dendritic excitability and shaping synaptically evoked firing responses in spontaneously active neurons. Here, we demonstrate a previously unrecognized role of background firing rate in tuning dendritic excitability and modulating the gain of synaptic responses in SNc neurons.
Supralinear dendritic Ca2+ signaling in SNc dopamine neurons
Our findings show that approximately one-half of the dendritic Ca2+ influx during fast tonic firing (4–6 Hz) originates from activation of low-threshold Ca2+ channels. Three observations support this claim. First, evoking spikes from fixed membrane potentials results in a ∼50% reduction in averaged Ca2+ signals as compared with control values (control Ca2+ signals at 4.5–6 Hz = 16.4% vs fixed at 5 Hz = 8.1%). Second, in the absence of APs, voltage steps to subthreshold potentials (between −60 and −50 mV) evoke Ca2+ signals that are ∼50% of the amplitude of Ca2+ signals during fast tonic firing (Ca2+ signal evoked by voltage step from −70 to −55 mV = 8.5%, vs average Ca2+ signal during 4.5–6 Hz tonic firing = 16.4%). Third, the average Ca2+ signals recorded during 3.5–4.5 Hz tonic firing in nifedipine-treated cells is reduced by 51% compared with control cells (G/GS, control, 15.8 ± 1.5% vs nifedipine, 7.7 ± 1.7%, p = 0.00015, unpaired t test). By contrast, nifedipine showed a smaller effect (29.7% reduction) on the peak of AP-evoked Ca2+ signals. Therefore, these results show that a large fraction of the dendritic Ca2+ signal generated by fast tonic firing in SNc dopamine neurons originates from influx through low threshold L-type Ca2+ channels.
Recent work has identified Ca2+ influx, likely through CaV1.3 channels, as a potential source of vulnerability and selective death of SNc dopamine neurons in Parkinson's disease (Chan et al., 2007). Recordings in dissociated cells seem at odds with this view, however, showing that the bulk of Ca2+ entry (>80%) during low-frequency pacemaking occurs during their characteristically broad APs (halfwidth, 1.5–5 ms; Puopolo et al., 2007). During low tonic firing (<2 Hz), our results corroborate the findings in dissociated neurons. On the other hand, during fast tonic firing, at rates much more likely to be encountered in vivo (>3 Hz), we find that strong activation of L-type channels leads to a substantial increase in Ca2+ influx in SNc neurons. Notably, we did not observe supralinear Ca2+ influx at elevated firing rates (>3 Hz) in VTA dopamine neurons, which are mostly spared in Parkinson's disease. These findings are consistent with past work showing reduced involvement of subthreshold Ca2+ currents in VTA neurons (Khaliq and Bean, 2010). In the context of the Ca2+ hypothesis of Parkinson's disease, our results reveal that the role of low threshold L-type channels in Ca2+ signaling, and subsequent Ca2+ overload, may be even more prominent than has been appreciated in past studies of SNc dopamine neurons.
Strong electrotonic coupling of soma to distal dendrites
Our results demonstrate tight electrotonic coupling between the soma and dendrites of SNc dopamine neurons, similar to earlier work using direct dendritic recordings (Häusser et al., 1995; Gentet and Williams, 2007). However, the functional consequences of tight dendritic coupling had not been tested. Here, we use glutamate uncaging and Ca2+ imaging to gain access to small-caliber distal dendrites. We show that somatic depolarization from −67 mV to −47 mV leads to a ∼ 50–150% enhancement of NMDA receptor mediated Ca2+ signals, even at distances nearly 500 μm distal to the soma. Therefore, our findings demonstrate that the somatic voltage exerts a powerful influence over dendritic conductances due in large part to strong electrotonic coupling of the soma and dendrites.
Modeling studies show that strong electrotonic properties and simple geometry of the dendrites of SNc neurons, which exhibit little branching, favor reliable backpropagation (Vetter et al., 2001). Consistent with this, our results show little attenuation of bAP-evoked Ca2+ signals with distance, up to 450 μm from the soma. Olfactory bulb mitral cells are similar in form and function, with dendrites that branch minimally and show reliable backpropagation over long distances (Bischofberger and Jonas, 1997; Chen et al., 1997; Christie and Westbrook, 2003; Djurisic et al., 2004). In contrast, pyramidal neurons in the hippocampus and neocortex show significantly more branching and significant attenuation of spike-evoked Ca2+ signals at distances <200 μm from the soma (Waters et al., 2003; Gasparini et al., 2007, 2011). Dentate gyrus neurons branch closely to the soma and not much beyond, but exhibit strong attenuation of bAP-evoked Ca2+ signals likely due to only a modest expression of voltage-gated Na+ channels (Krueppel et al., 2011). Therefore, bAPs invade the distal dendrites of dopamine neurons more extensively than pyramidal neurons, likely due to their simple morphology.
The extent to which steady-state and slow voltage changes are passively propagated through the dendrites depends chiefly upon the specific membrane resistivity. For example, direct dendritic recordings from CA1 neurons show 50% attenuation of steady-state voltage deflections 238 μm from the soma (Golding et al., 2005). Correspondingly, the input resistances of CA1 neurons tend to be low at ∼50 MΩ on average. By contrast, our glutamate uncaging results suggest that SNc dopamine neurons are much more compact (Fig. 7), consistent with direct recordings that show little voltage attenuation up to 200 μm from the soma (Häusser et al., 1995). The tight coupling is likely explained by the unusually high membrane resistance of dopamine neurons that range in our recordings from 143 to 583 MΩ (mean = 302 MΩ, data not shown). We suggest that the strong electrotonic coupling of the dendrites to the soma may serve to equalize the soma's influence (particularly at subthreshold voltages, where membrane resistance is high) on synaptic inputs throughout the dendritic tree.
As an additional consequence of the tight coupling, neurotransmitters that alter the membrane conductance could dramatically influence the extent to which small changes in the somatic membrane potential are faithfully reported to the dendrites. For example, in SNc dopamine neurons, activation of D2-dopamine receptors or GABAB receptors increases the membrane conductance of dopamine neurons via activation of G-protein-coupled inward-rectifier K-channels (Lüscher and Slesinger, 2010; Ford, 2014). Similarly, previous work in pyramidal neurons shows that shunting inhibition resulting from activation of dendritic GABAA receptors can significantly influence dendritic excitability and also produce failures in bAPs (Zhou and Antic, 2012). In the case of SNc dopamine neurons, inhibitory inputs play a particular important physiological role as nearly 70% of synaptic inputs onto SNc neurons are GABAergic (Tepper and Lee, 2007; Lobb et al., 2010). In future experiments, it will be important to examine the effect of local dendritic shunting from GABAA receptors on propagation of steady-state somatic signals to the distal dendrites.
Influence of tonic firing on synaptically evoked bursts
Studies of DA neuron firing in vivo have observed a weak correlation between average firing rate and burst firing (quantified as the percentage of APs contained in bursts; Grace and Bunney, 1984a; Marinelli and McCutcheon, 2014). However, the consequences of changes in background firing rate on burst firing within a cell have not been fully examined. We have demonstrated that elevations in the rate of tonic firing increase synaptic gain due to subthreshold membrane depolarization and increased activation of NMDARs. These results are important because they suggest that relatively weak inputs which may not be sufficient to generate bursts themselves could promote burst firing by increasing the rate of tonic firing. The electrotonically compact nature of SNc dopamine neurons could allow such cooperativity to take place over large stretches of a dendrite or even between dendrites. Similarly, slow neuromodulators that alter the background activity of dopamine neurons, such as nicotine or cannabinoids (French et al., 1997; Zhang et al., 2009; Li et al., 2011), may change the propensity of dopamine neurons to generate bursts in response to synaptic inputs associated with rewarding stimuli.
Footnotes
This work was supported by the National Institute of Neurological Disorders and Stroke Intramural Research Program Grant NS003135 to Z.M.K. We thank Dr Chris McBain for helpful discussions, and Dr Jeffery Diamond and members of the Khaliq laboratory for helpful comments on the paper.
The authors declare no competing financial interests.
References
- Beckstead MJ, Grandy DK, Wickman K, Williams JT. Vesicular dopamine release elicits an inhibitory postsynaptic current in midbrain dopamine neurons. Neuron. 2004;42:939–946. doi: 10.1016/j.neuron.2004.05.019. [DOI] [PubMed] [Google Scholar]
- Bischofberger J, Jonas P. Action potential propagation into the presynaptic dendrites of rat mitral cells. J Physiol. 1997;504:359–365. doi: 10.1111/j.1469-7793.1997.359be.x. [DOI] [PMC free article] [PubMed] [Google Scholar]
- Blythe SN, Wokosin D, Atherton JF, Bevan MD. Cellular mechanisms underlying burst firing in substantia nigra dopamine neurons. J Neurosci. 2009;29:15531–15541. doi: 10.1523/JNEUROSCI.2961-09.2009. [DOI] [PMC free article] [PubMed] [Google Scholar]
- Brenowitz SD, Regehr WG. Reliability and heterogeneity of calcium signaling at single presynaptic boutons of cerebellar granule cells. J Neurosci. 2007;27:7888–7898. doi: 10.1523/JNEUROSCI.1064-07.2007. [DOI] [PMC free article] [PubMed] [Google Scholar]
- Chan CS, Guzman JN, Ilijic E, Mercer JN, Rick C, Tkatch T, Meredith GE, Surmeier DJ. “Rejuvenation” protects neurons in mouse models of Parkinson's disease. Nature. 2007;447:1081–1086. doi: 10.1038/nature05865. [DOI] [PubMed] [Google Scholar]
- Chen WR, Midtgaard J, Shepherd GM. Forward and backward propagation of dendritic impulses and their synaptic control in mitral cells. Science. 1997;278:463–467. doi: 10.1126/science.278.5337.463. [DOI] [PubMed] [Google Scholar]
- Christie JM, Westbrook GL. Regulation of backpropagating action potentials in mitral cell lateral dendrites by A-type potassium currents. J Neurophysiol. 2003;89:2466–2472. doi: 10.1152/jn.00997.2002. [DOI] [PubMed] [Google Scholar]
- Cohen JY, Haesler S, Vong L, Lowell BB, Uchida N. Neuron-type-specific signals for reward and punishment in the ventral tegmental area. Nature. 2012;482:85–88. doi: 10.1038/nature10754. [DOI] [PMC free article] [PubMed] [Google Scholar]
- Cui G, Bernier BE, Harnett MT, Morikawa H. Differential regulation of action potential- and metabotropic glutamate receptor-induced Ca2+ signals by inositol 1,4,5-trisphosphate in dopaminergic neurons. J Neurosci. 2007;27:4776–4785. doi: 10.1523/JNEUROSCI.0139-07.2007. [DOI] [PMC free article] [PubMed] [Google Scholar]
- Deister CA, Teagarden MA, Wilson CJ, Paladini CA. An intrinsic neuronal oscillator underlies dopaminergic neuron bursting. J Neurosci. 2009;29:15888–15897. doi: 10.1523/JNEUROSCI.4053-09.2009. [DOI] [PMC free article] [PubMed] [Google Scholar]
- Djurisic M, Antic S, Chen WR, Zecevic D. Voltage imaging from dendrites of mitral cells: EPSP attenuation and spike trigger zones. J Neurosci. 2004;24:6703–6714. doi: 10.1523/JNEUROSCI.0307-04.2004. [DOI] [PMC free article] [PubMed] [Google Scholar]
- Durante P, Cardenas CG, Whittaker JA, Kitai ST, Scroggs RS. Low-threshold L-type calcium channels in rat dopamine neurons. J Neurophysiol. 2004;91:1450–1454. doi: 10.1152/jn.01015.2003. [DOI] [PubMed] [Google Scholar]
- Ford CP. The role of D2-autoreceptors in regulating dopamine neuron activity and transmission. Neuroscience. 2014;282C:13–22. doi: 10.1016/j.neuroscience.2014.01.025. [DOI] [PMC free article] [PubMed] [Google Scholar]
- Ford CP, Gantz SC, Phillips PE, Williams JT. Control of extracellular dopamine at dendrite and axon terminals. J Neurosci. 2010;30:6975–6983. doi: 10.1523/JNEUROSCI.1020-10.2010. [DOI] [PMC free article] [PubMed] [Google Scholar]
- French ED, Dillon K, Wu X. Cannabinoids excite dopamine neurons in the ventral tegmentum and substantia nigra. Neuroreport. 1997;8:649–652. doi: 10.1097/00001756-199702100-00014. [DOI] [PubMed] [Google Scholar]
- Gasparini S. Distance- and activity-dependent modulation of spike back-propagation in layer V pyramidal neurons of the medial entorhinal cortex. J Neurophysiol. 2011;105:1372–1379. doi: 10.1152/jn.00014.2010. [DOI] [PMC free article] [PubMed] [Google Scholar]
- Gasparini S, Losonczy A, Chen X, Johnston D, Magee JC. Associative pairing enhances action potential back-propagation in radial oblique branches of CA1 pyramidal neurons. J Physiol. 2007;580:787–800. doi: 10.1113/jphysiol.2006.121343. [DOI] [PMC free article] [PubMed] [Google Scholar]
- Gentet LJ, Williams SR. Dopamine gates action potential backpropagation in midbrain dopaminergic neurons. J Neurosci. 2007;27:1892–1901. doi: 10.1523/JNEUROSCI.5234-06.2007. [DOI] [PMC free article] [PubMed] [Google Scholar]
- Golding NL, Mickus TJ, Katz Y, Kath WL, Spruston N. Factors mediating powerful voltage attenuation along CA1 pyramidal neuron dendrites. J Physiol. 2005;568:69–82. doi: 10.1113/jphysiol.2005.086793. [DOI] [PMC free article] [PubMed] [Google Scholar]
- Gonon FG. Nonlinear relationship between impulse flow and dopamine released by rat midbrain dopaminergic neurons as studied by in vivo electrochemistry. Neuroscience. 1988;24:19–28. doi: 10.1016/0306-4522(88)90307-7. [DOI] [PubMed] [Google Scholar]
- Grace AA, Bunney BS. The control of firing pattern in nigral dopamine neurons: burst firing. J Neurosci. 1984a;4:2877–2890. doi: 10.1523/JNEUROSCI.04-11-02877.1984. [DOI] [PMC free article] [PubMed] [Google Scholar]
- Grace AA, Bunney BS. The control of firing pattern in nigral dopamine neurons: single spike firing. J Neurosci. 1984b;4:2866–2876. doi: 10.1523/JNEUROSCI.04-11-02866.1984. [DOI] [PMC free article] [PubMed] [Google Scholar]
- Guzman JN, Sánchez-Padilla J, Chan CS, Surmeier DJ. Robust pacemaking in substantia nigra dopaminergic neurons. J Neurosci. 2009;29:11011–11019. doi: 10.1523/JNEUROSCI.2519-09.2009. [DOI] [PMC free article] [PubMed] [Google Scholar]
- Harnett MT, Bernier BE, Ahn KC, Morikawa H. Burst-timing-dependent plasticity of NMDA receptor-mediated transmission in midbrain dopamine neurons. Neuron. 2009;62:826–838. doi: 10.1016/j.neuron.2009.05.011. [DOI] [PMC free article] [PubMed] [Google Scholar]
- Häusser M, Stuart G, Racca C, Sakmann B. Axonal initiation and active dendritic propagation of action potentials in substantia nigra neurons. Neuron. 1995;15:637–647. doi: 10.1016/0896-6273(95)90152-3. [DOI] [PubMed] [Google Scholar]
- Helmchen F, Imoto K, Sakmann B. Ca2+ buffering and action potential-evoked Ca2+ signaling in dendrites of pyramidal neurons. Biophys J. 1996;70:1069–1081. doi: 10.1016/S0006-3495(96)79653-4. [DOI] [PMC free article] [PubMed] [Google Scholar]
- Hyland BI, Reynolds JN, Hay J, Perk CG, Miller R. Firing modes of midbrain dopamine cells in the freely moving rat. Neuroscience. 2002;114:475–492. doi: 10.1016/S0306-4522(02)00267-1. [DOI] [PubMed] [Google Scholar]
- Jung HY, Mickus T, Spruston N. Prolonged sodium channel inactivation contributes to dendritic action potential attenuation in hippocampal pyramidal neurons. J Neurosci. 1997;17:6639–6646. doi: 10.1523/JNEUROSCI.17-17-06639.1997. [DOI] [PMC free article] [PubMed] [Google Scholar]
- Kampa BM, Stuart GJ. Calcium spikes in basal dendrites of layer 5 pyramidal neurons during action potential bursts. J Neurosci. 2006;26:7424–7432. doi: 10.1523/JNEUROSCI.3062-05.2006. [DOI] [PMC free article] [PubMed] [Google Scholar]
- Khaliq ZM, Bean BP. Pacemaking in dopaminergic ventral tegmental area neurons: depolarizing drive from background and voltage-dependent sodium conductances. J Neurosci. 2010;30:7401–7413. doi: 10.1523/JNEUROSCI.0143-10.2010. [DOI] [PMC free article] [PubMed] [Google Scholar]
- Koester HJ, Sakmann B. Calcium dynamics associated with action potentials in single nerve terminals of pyramidal cells in layer 2/3 of the young rat neocortex. J Physiol. 2000;529:625–646. doi: 10.1111/j.1469-7793.2000.00625.x. [DOI] [PMC free article] [PubMed] [Google Scholar]
- Krueppel R, Remy S, Beck H. Dendritic integration in hippocampal dentate granule cells. Neuron. 2011;71:512–528. doi: 10.1016/j.neuron.2011.05.043. [DOI] [PubMed] [Google Scholar]
- Kuznetsov AS, Kopell NJ, Wilson CJ. Transient high-frequency firing in a coupled-oscillator model of the mesencephalic dopaminergic neuron. J Neurophysiol. 2006;95:932–947. doi: 10.1152/jn.00691.2004. [DOI] [PubMed] [Google Scholar]
- Li W, Doyon WM, Dani JA. Acute in vivo nicotine administration enhances synchrony among dopamine neurons. Biochem Pharmacol. 2011;82:977–983. doi: 10.1016/j.bcp.2011.06.006. [DOI] [PMC free article] [PubMed] [Google Scholar]
- Lobb CJ, Wilson CJ, Paladini CA. A dynamic role for GABA receptors on the firing pattern of midbrain dopaminergic neurons. J Neurophysiol. 2010;104:403–413. doi: 10.1152/jn.00204.2010. [DOI] [PMC free article] [PubMed] [Google Scholar]
- Lüscher C, Slesinger PA. Emerging roles for G-protein-gated inwardly rectifying potassium (GIRK) channels in health and disease. Nat Rev Neurosci. 2010;11:301–315. doi: 10.1038/nrn2834. [DOI] [PMC free article] [PubMed] [Google Scholar]
- Magee JC, Johnston D. A synaptically controlled, associative signal for Hebbian plasticity in hippocampal neurons. Science. 1997;275:209–213. doi: 10.1126/science.275.5297.209. [DOI] [PubMed] [Google Scholar]
- Marinelli M, McCutcheon JE. Heterogeneity of dopamine neuron activity across traits and states. Neuroscience. 2014;282C:176–197. doi: 10.1016/j.neuroscience.2014.07.034. [DOI] [PMC free article] [PubMed] [Google Scholar]
- Overton P, Clark D. Iontophoretically administered drugs acting at the N-methyl-d-aspartate receptor modulate burst firing in A9 dopamine neurons in the rat. Synapse. 1992;10:131–140. doi: 10.1002/syn.890100208. [DOI] [PubMed] [Google Scholar]
- Overton PG, Clark D. Burst firing in midbrain dopaminergic neurons. Brain Res Brain Res Rev. 1997;25:312–334. doi: 10.1016/S0165-0173(97)00039-8. [DOI] [PubMed] [Google Scholar]
- Paladini CA, Roeper J. Generating bursts (and pauses) in the dopamine midbrain neurons. Neuroscience. 2014;282C:109–121. doi: 10.1016/j.neuroscience.2014.07.032. [DOI] [PubMed] [Google Scholar]
- Puopolo M, Raviola E, Bean BP. Roles of subthreshold calcium current and sodium current in spontaneous firing of mouse midbrain dopamine neurons. J Neurosci. 2007;27:645–656. doi: 10.1523/JNEUROSCI.4341-06.2007. [DOI] [PMC free article] [PubMed] [Google Scholar]
- Rice ME, Cragg SJ, Greenfield SA. Characteristics of electrically evoked somatodendritic dopamine release in substantia nigra and ventral tegmental area in vitro. J Neurophysiol. 1997;77:853–862. doi: 10.1152/jn.1997.77.2.853. [DOI] [PubMed] [Google Scholar]
- Scheuss V, Yasuda R, Sobczyk A, Svoboda K. Nonlinear [Ca2+] signaling in dendrites and spines caused by activity-dependent depression of Ca2+ extrusion. J Neurosci. 2006;26:8183–8194. doi: 10.1523/JNEUROSCI.1962-06.2006. [DOI] [PMC free article] [PubMed] [Google Scholar]
- Schultz W. Behavioral theories and the neurophysiology of reward. Annu Rev Psychol. 2006;57:87–115. doi: 10.1146/annurev.psych.56.091103.070229. [DOI] [PubMed] [Google Scholar]
- Schultz W. Multiple dopamine functions at different time courses. Annu Rev Neurosci. 2007;30:259–288. doi: 10.1146/annurev.neuro.28.061604.135722. [DOI] [PubMed] [Google Scholar]
- Schultz W, Dayan P, Montague PR. A neural substrate of prediction and reward. Science. 1997;275:1593–1599. doi: 10.1126/science.275.5306.1593. [DOI] [PubMed] [Google Scholar]
- Stuart G, Spruston N, Sakmann B, Häusser M. Action potential initiation and backpropagation in neurons of the mammalian CNS. Trends Neurosci. 1997;20:125–131. doi: 10.1016/S0166-2236(96)10075-8. [DOI] [PubMed] [Google Scholar]
- Tepper JM, Lee CR. GABAergic control of substantia nigra dopaminergic neurons. Prog Brain Res. 2007;160:189–208. doi: 10.1016/S0079-6123(06)60011-3. [DOI] [PubMed] [Google Scholar]
- Vetter P, Roth A, Häusser M. Propagation of action potentials in dendrites depends on dendritic morphology. J Neurophysiol. 2001;85:926–937. doi: 10.1152/jn.2001.85.2.926. [DOI] [PubMed] [Google Scholar]
- Waters J, Larkum M, Sakmann B, Helmchen F. Supralinear Ca2+ influx into dendritic tufts of layer 2/3 neocortical pyramidal neurons in vitro and in vivo. J Neurosci. 2003;23:8558–8567. doi: 10.1523/JNEUROSCI.23-24-08558.2003. [DOI] [PMC free article] [PubMed] [Google Scholar]
- Waters J, Schaefer A, Sakmann B. Backpropagating action potentials in neurones: measurement, mechanisms and potential functions. Prog Biophys Mol Biol. 2005;87:145–170. doi: 10.1016/j.pbiomolbio.2004.06.009. [DOI] [PubMed] [Google Scholar]
- Wise RA. Dopamine, learning and motivation. Nat Rev Neurosci. 2004;5:483–494. doi: 10.1038/nrn1406. [DOI] [PubMed] [Google Scholar]
- Xu W, Lipscombe D. Neuronal CaV1.3α1 L-type channels activate at relatively hyperpolarized membrane potentials and are incompletely inhibited by dihydropyridines. J Neurosci. 2001;21:5944–5951. doi: 10.1523/JNEUROSCI.21-16-05944.2001. [DOI] [PMC free article] [PubMed] [Google Scholar]
- Yasuda R, Nimchinsky EA, Scheuss V, Pologruto TA, Oertner TG, Sabatini BL, Svoboda K. Imaging calcium concentration dynamics in small neuronal compartments. Sci STKE. 2004;2004:p15. doi: 10.1126/stke.2192004pl5. [DOI] [PubMed] [Google Scholar]
- Zhang T, Zhang L, Liang Y, Siapas AG, Zhou FM, Dani JA. Dopamine signaling differences in the nucleus accumbens and dorsal striatum exploited by nicotine. J Neurosci. 2009;29:4035–4043. doi: 10.1523/JNEUROSCI.0261-09.2009. [DOI] [PMC free article] [PubMed] [Google Scholar]
- Zhou WL, Antic SD. Rapid dopaminergic and GABAergic modulation of calcium and voltage transients in dendrites of prefrontal cortex pyramidal neurons. J Physiol. 2012;590:3891–3911. doi: 10.1113/jphysiol.2011.227157. [DOI] [PMC free article] [PubMed] [Google Scholar]
- Zweifel LS, Parker JG, Lobb CJ, Rainwater A, Wall VZ, Fadok JP, Darvas M, Kim MJ, Mizumori SJ, Paladini CA, Phillips PE, Palmiter RD. Disruption of NMDAR-dependent burst firing by dopamine neurons provides selective assessment of phasic dopamine-dependent behavior. Proc Natl Acad Sci U S A. 2009;106:7281–7288. doi: 10.1073/pnas.0813415106. [DOI] [PMC free article] [PubMed] [Google Scholar]