Abstract
BACKGROUND/OBJECTIVES
The relationship between food intake and nutritional status has been clearly established. Yet, there are only limited studies on food intake among family members and their nutritional status. The study examined the relationship between intra-household food distribution and coexistence of dual forms of malnutrition (DFM) in the same household.
SUBJECTS/METHODS
Households with a malnourished child and overweight mother were categorized as DFM. Intra-household food distribution among family members was reported using ratios, which are a measure of individual intakes as compared to all household member intakes adjusted to RDA.
RESULTS
A 1,899 families were included in the study. The prevalence of DFM was 29.8% (95%CI 26.5-31.2). Children consumed lower amounts of energy (OR 1.34; 95%CI 1.06-1.69, P = 0.011), carbohydrates (OR 1.2; 95%CI1.03-1.61, P = 0.022), protein (OR 1.3; 95%CI 1.03-1.64, P = 0.026), and fat (OR 1.3; 95%CI 1.05-1.66, P = 0.016) than their mothers and other family members. In contrast, mothers consumed more carbohydrates than children and other family members (OR1.24; 95%CI 1.02-1.51, P = 0.03).
CONCLUSIONS
This study is the first to report on the food distribution among family members and its relationship with occurrence of DFM in Indonesia. The results confirm the occurrence of an unequal food distribution between children and mothers, which increases risk of DFM in the household. The results also demonstrate that nutritional education at the household level is important to increase awareness of the impact of DFM.
Keywords: Food distribution, malnutrition, Indonesia
INTRODUCTION
Child malnutrition is still considered the greatest health concern in many developing countries such as Indonesia. A recent survey conducted by the Indonesian National Health (Riskesdas) showed that the prevalence of malnutrition remains stable while that of being overweight has increased over the past few years. This result suggests that both undernutrition and overnutrition are now emerging problems that require equal attention.
DFM (Dual forms of malnutrition) is defined as a household in which one person is overweight while another is underweight, which reflects the dual burden of overnutrition and undernutrition within a single household [1]. Prior studies have documented DFM at the household level [1,2,3,4,5,6,7,8,9,10,11,12,13]. Demographic Health Surveys from eight Latin American, 23 African and five Asian countries from 1991-1998 showed that DFM stunted children aged 0-60 months, and the percentage of overweight mothers ranged from 0-15%.
Other previous studies focused on different age-classified pairs of subjects as stated in each DFM group, including child-mother [13] and adolescent-mother pairs [14]. However, most DFM studies have used child-mother pairs as both populations are considered to be vulnerable and are targets for MDG (Millennium development goal) achievements.
Consequences of malnutrition have been previously reported. Malnutrition affects child development, cognition, longevity, and morbidity due to lower immunity. On the other hand, overweight adults have a higher rate of mortality as well as greater incidence of chronic deseases [15,16]. In addition, DFM creates higher economic burden for families.
In an epidemiological sense, DFM impacts nutritional and epidemiological transitions [17], familial socio-economic status, food availability, and lifestyle [15]. Nutritional and epidemiological transitions are defined as a series of collective changes in diet, physical activity, health, and nutrition [18]. Food distribution may be unequal among family members in terms of quality and quantity, which affects prevalence of DFM. A recent study conducted in Indonesia found that some children consumed lower energy and protein contents compared to their mothers and other family members [19]. Since there are limited studies on food distribution within families, this study investigated the relationship between food distribution among children and mothers and DFM in the household.
SUBJECTS AND METHODS
Study on population
The study used national data from the 2010 Indonesian Health Survey, which represented 33 provinces along with 440 districts/cities. Multistage cluster sampling was applied for selection of subjects. Questionnaires and measurement instruments used for the survey conformed to the World Health Survey, which has been widely used by more than 61 countries.
In total, 69,300 households were sampled for the survey. These households were further selected in accordance with the objective of the study by applying inclusion and exclusion criteria for selected households. In addition, double-checking and screening for data completeness were conducted to ensure data accuracy. Finally, 1,899 households were included in the current study.
Methods
The study focused on households with child-mother pairs with either DFM or normal nutritional status. The inclusion criteria were applied to household child-mother pairs, with mothers aged between 18 and 40 years and children aged between 2 and 5 years. The exclusion criteria were applied to pregnant mothers and breastfeeding children. The collected main data were anthropometric and included food intake levels, which were taken from all household members. Anthropometric data contained information about the weight and height of children and their mothers, whereas food consumption data focused on macronutrient intake levels of all household members by 24-hour food recall. Both variables were applied to identify dual forms of malnutrition (dependent variable) and intra-household food distribution (main independent variable).
For this study, dual forms of malnutrition was defined as a household with an overweight mother and malnourished child. Body Mass Index >= 25 kg/m2 was used as the cut-off for overweight mothers, whereas a z-score < -2 from composite indicators of WAZ, HAZ, and WHZ (Composite index of anthropometric failure/CIAF) was used as the cut-off for malnourished children. There are seven different classifications of child nutritional status in the CIAF. In this study, children with nutritional failure as well as those classified as wasting only, wasting and underweight, wasting stunting and underweight, stunting and underweight, stunting only, and underweight only were categorized into one group (malnourished group), whereas those with no nutritional failure were considered as normal. This seven-level index provides an accurate rate of malnutrition among children in a population based on detailed nutritional status [20,21,22].
Intra-household food distribution (IHFD) calculation was applied to all households along with household members, particularly the intended target mother and child. IHFD scores results were reported as a ratio. The ratio was calculated based on child/mother calorie intakes over their RDA (Recommended dietary allowances) divided by the family's total intake over their RDA [23]. An IHFD ratio ≥ 1 means that either the child or mother received equal or larger food allocation than other family members (considered as equal), whereas an IHFD ratio < 1 means that the child or mother received lower food allocation than others (considered as Unequal).
To ensure data accuracy, this survey was verified by a third independent party. The validation showed a Kappa value of 76.3%, which means good consistency between the survey responses and the validation study. Analysis was conducted using the statistical package of SPSS version 17. Analysis used an independent T test (parametric and non parametric tests), ANOVA test, and chi square test for categorical data.
RESULTS
Characteristic of subjects
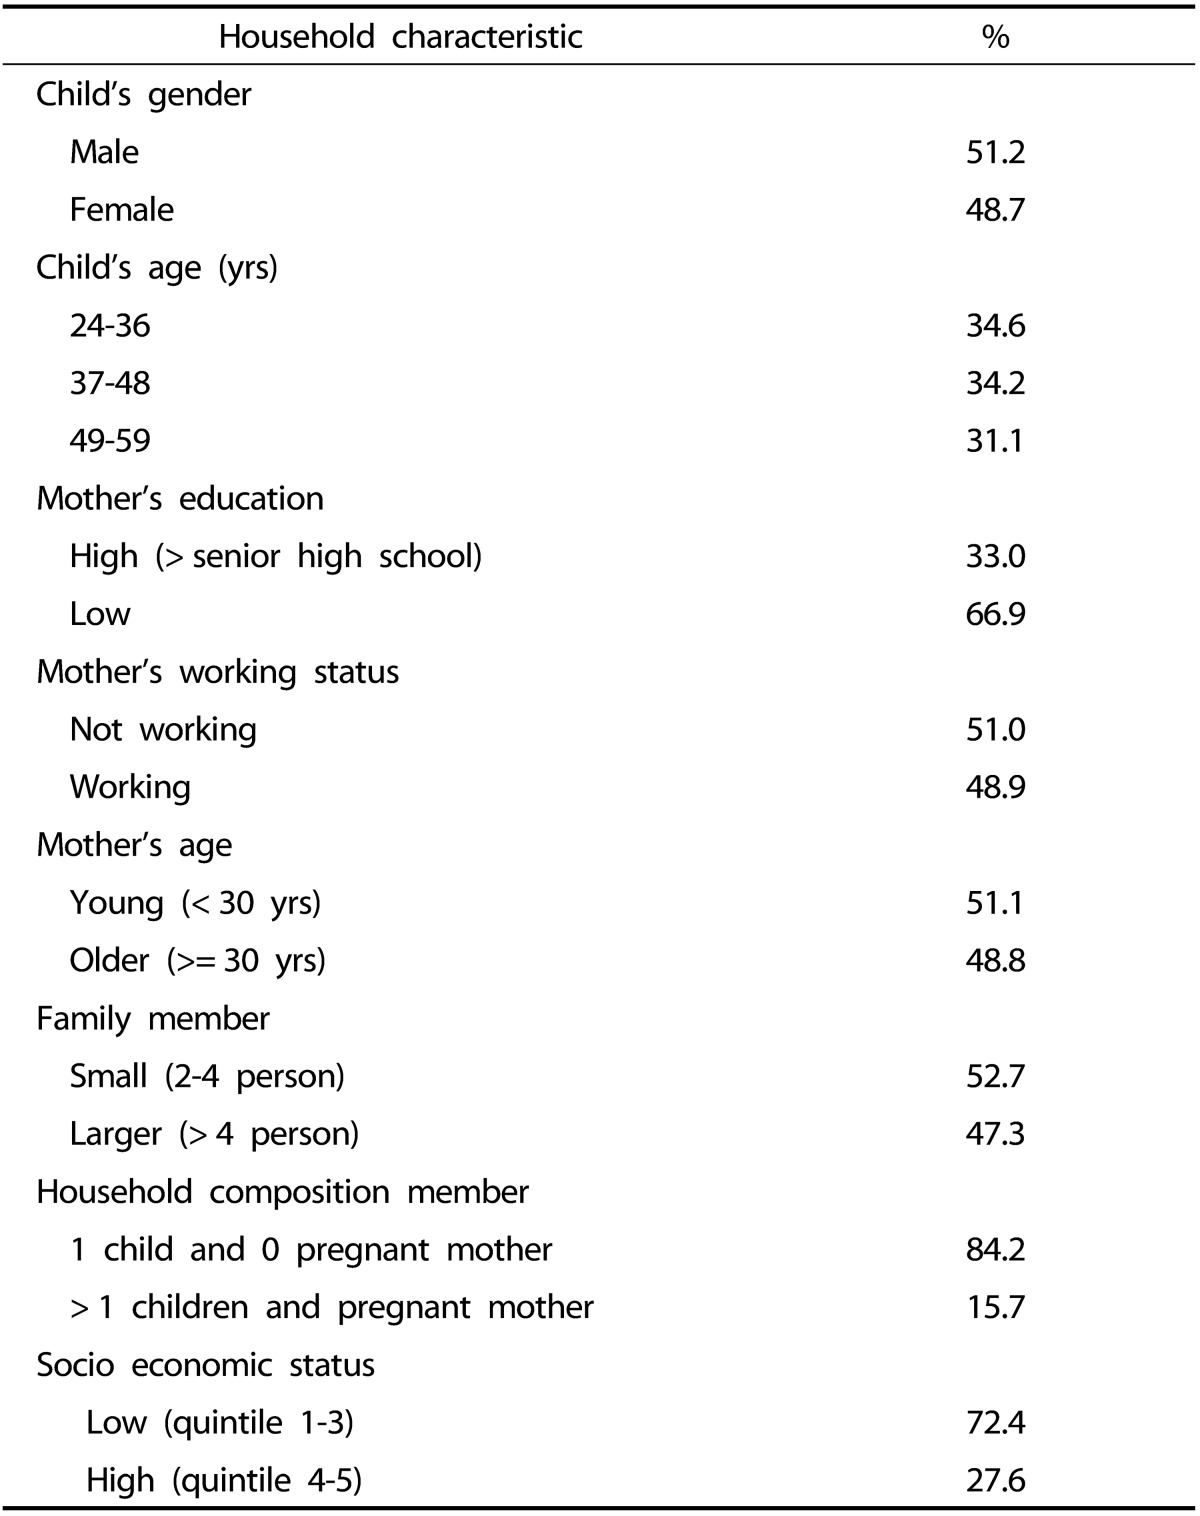
Characteristics of subjects were comparable among the different groups. The ratio of males (51.2%) was proportional to that of females (48.7%). Age distribution among children remained steady. Most mothers (66.9%) had a low education level (< senior high school), and occupational status was equally distributed among working and non-working mothers. Age distribution among mothers was almost proportional between 1 young mothers ≤ 30 years (51.1%) and older mothers > 30 years. The proportion of small families (with 2-4 members) was comparable to that of larger families (> 4 members), and most families were at a low socioeconomic level (72.4%)(Table 1).
Table 1.
Characteristics of subjects in the household (n = 1,899)
Food consumption
Table 2 describes food consumption of both children and mothers. Children with normal nutritional status consumed more macronutrients (energy, carbohydrates, protein, and fat) than malnourished children (P < 0.05), whereas no difference was observed between normal and overweight mothers. In fact, overweight mothers consumed lower amounts of fat than normal weight mothers (P < 0.05).
Table 2.
Macronutrient intakes of mother and child in the household1)
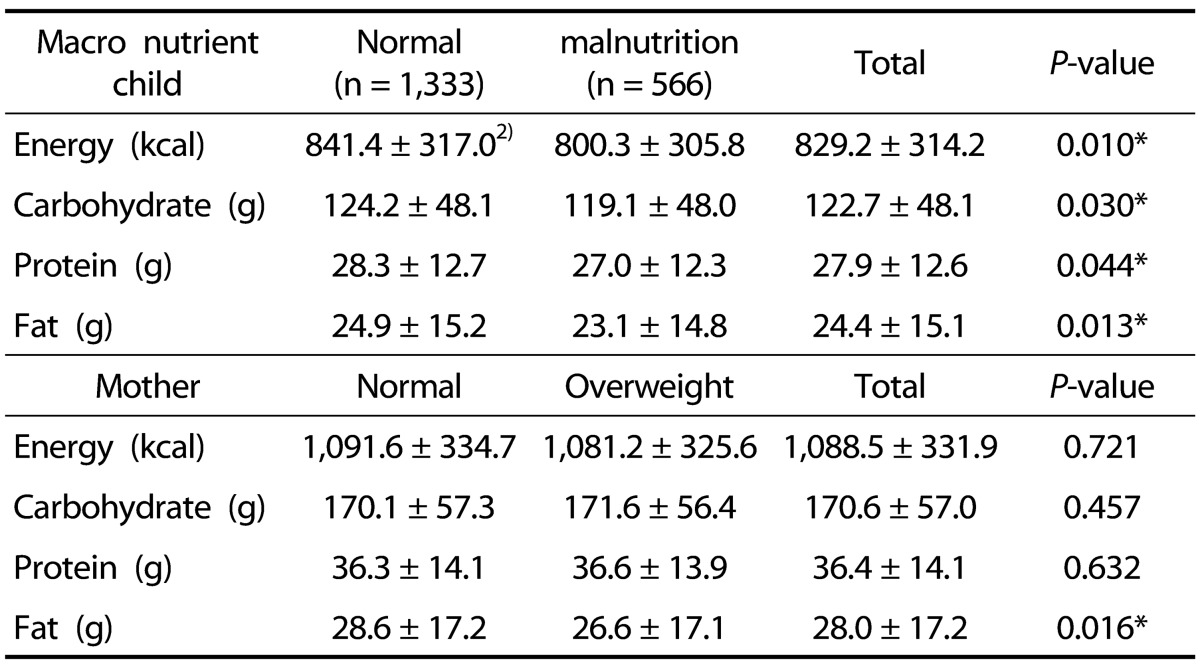
1) Non parametric test; Independent t-test
2) Mean ± SD.
*P < 0.05
Relationships in the Intra-household food distribution (IHFD) were stratified in terms of characteristics of the children and mothers (Tables 3 and 4). Compared to normal status, malnourishment was more common among children with lower intakes of energy (P = 0.03), carbohydrates (P = 0.03), and protein (P = 0.05) compared to their family members. Girls showed lower intake of carbohydrates than boys (P = 0.045). Older children showed lower intakes of energy (P = 0.000), carbohydrates (P = 0.000), protein (P =0.000), and fat (P = 0.000) than their family members. Children showing lower intakes of energy (P = 0.000), carbohydrates (P = 0.000), protein (P = 0.002), and fat (P = 0.004) were at lower socioeconomic levels. Children living in rural areas showed lower intakes of energy (P = 0.000), carbohydrates (P = 0.000), protein (P =0.000), and fat (P = 0.006) than their family members compared to children living in urban areas (Table 3).
Table 3.
Intra-household food distribution of child by characteristics
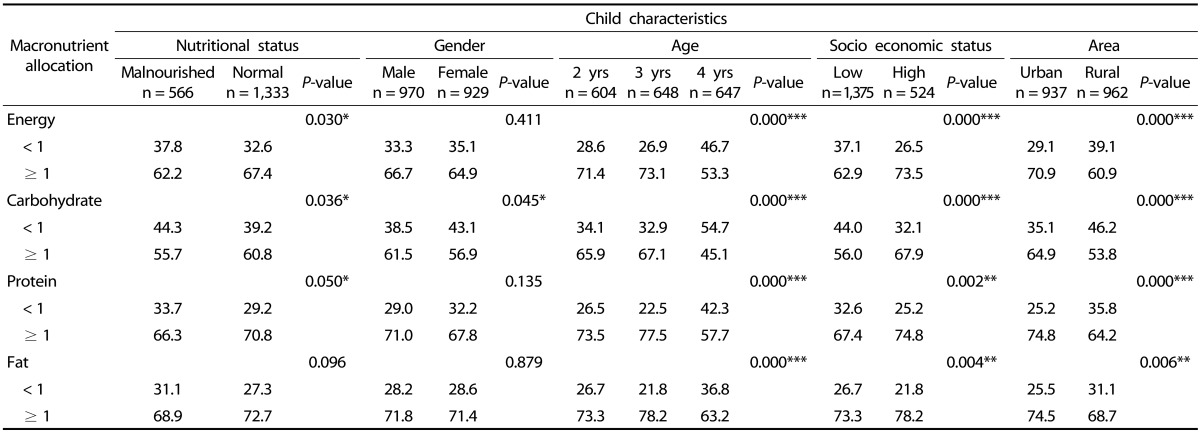
IHFD < 1: Child received lower food intake than other family members; IHFD ≥ 1: Child received similar or higher food intake than other family members
Chi square test
*P < 0.05, **P < 0.01, ***P < 0.001
Table 4.
Intra-household food distribution of mother by characteristics
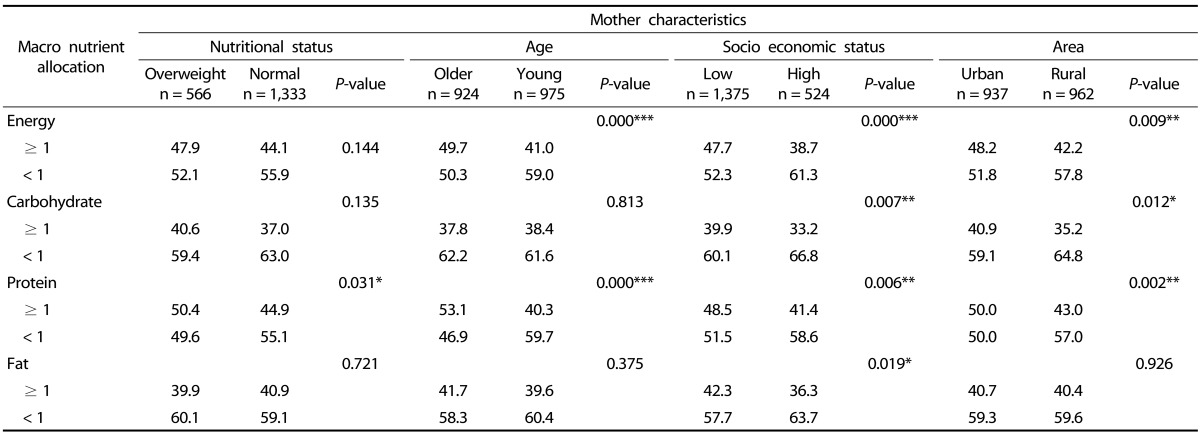
IHFD < 1 : Mother received lower food intake than other family members; IHFD ≥ 1: Mother received similar or higher food intake than other family members
Chi square test
*P < 0.05, **P < 0.01, ***P < 0.001
The proportion of overweight mothers who consumed more protein (P = 0.031) than other family members was greater than that of normal weight mothers. Further, older mothers showed higher proportions of both energy (P = 0.000) and protein (P = 0.000) consumption than normal weight mothers, whereas fat content was not significantly different. Mothers at low socioeconomic levels consumed more energy (P = 0.000), carbohydrates (P = 0.000), protein (P = 0.006), and fat (P = 0.019) than other family members. Mothers living in urban areas consumed more energy (P = 0.009), carbohydrates (P = 0.012), and protein (0.002) than their family members compared to those in rural areas.
Table 5 explains the relationship between Intra-household food distribution and occurrence of DFM. DFM was significantly higher among mothers who ate more carbohydrates than their family members compared to those who ate less carbohydrates (OR = 1.24 95%CI (1.02-1.51), P < 0.05). Although the difference was not significant, DFM was higher among mothers showing higher energy (OR = 1.16 95%CI (0.95-1.41) and protein intakes (OR = 0.85 95%CI (0.70-1.04) than their family members. Regarding children, DFM was higher among children showing less intakes of energy (OR = 1.34 95%CI (1.06-1.69), P = 0.011), carbohydrates (OR = 1.2 95%CI (1.03-1.61), P = 0.022), protein (OR = 1.3 95%CI (1.03-1.64), P = 0.026), and fat (OR = 1.3 95%CI (1.05-1.66), P = 0.016) than their family members.
Table 5.
Relationship of intra-household food distribution and dual forms of Malnutrition
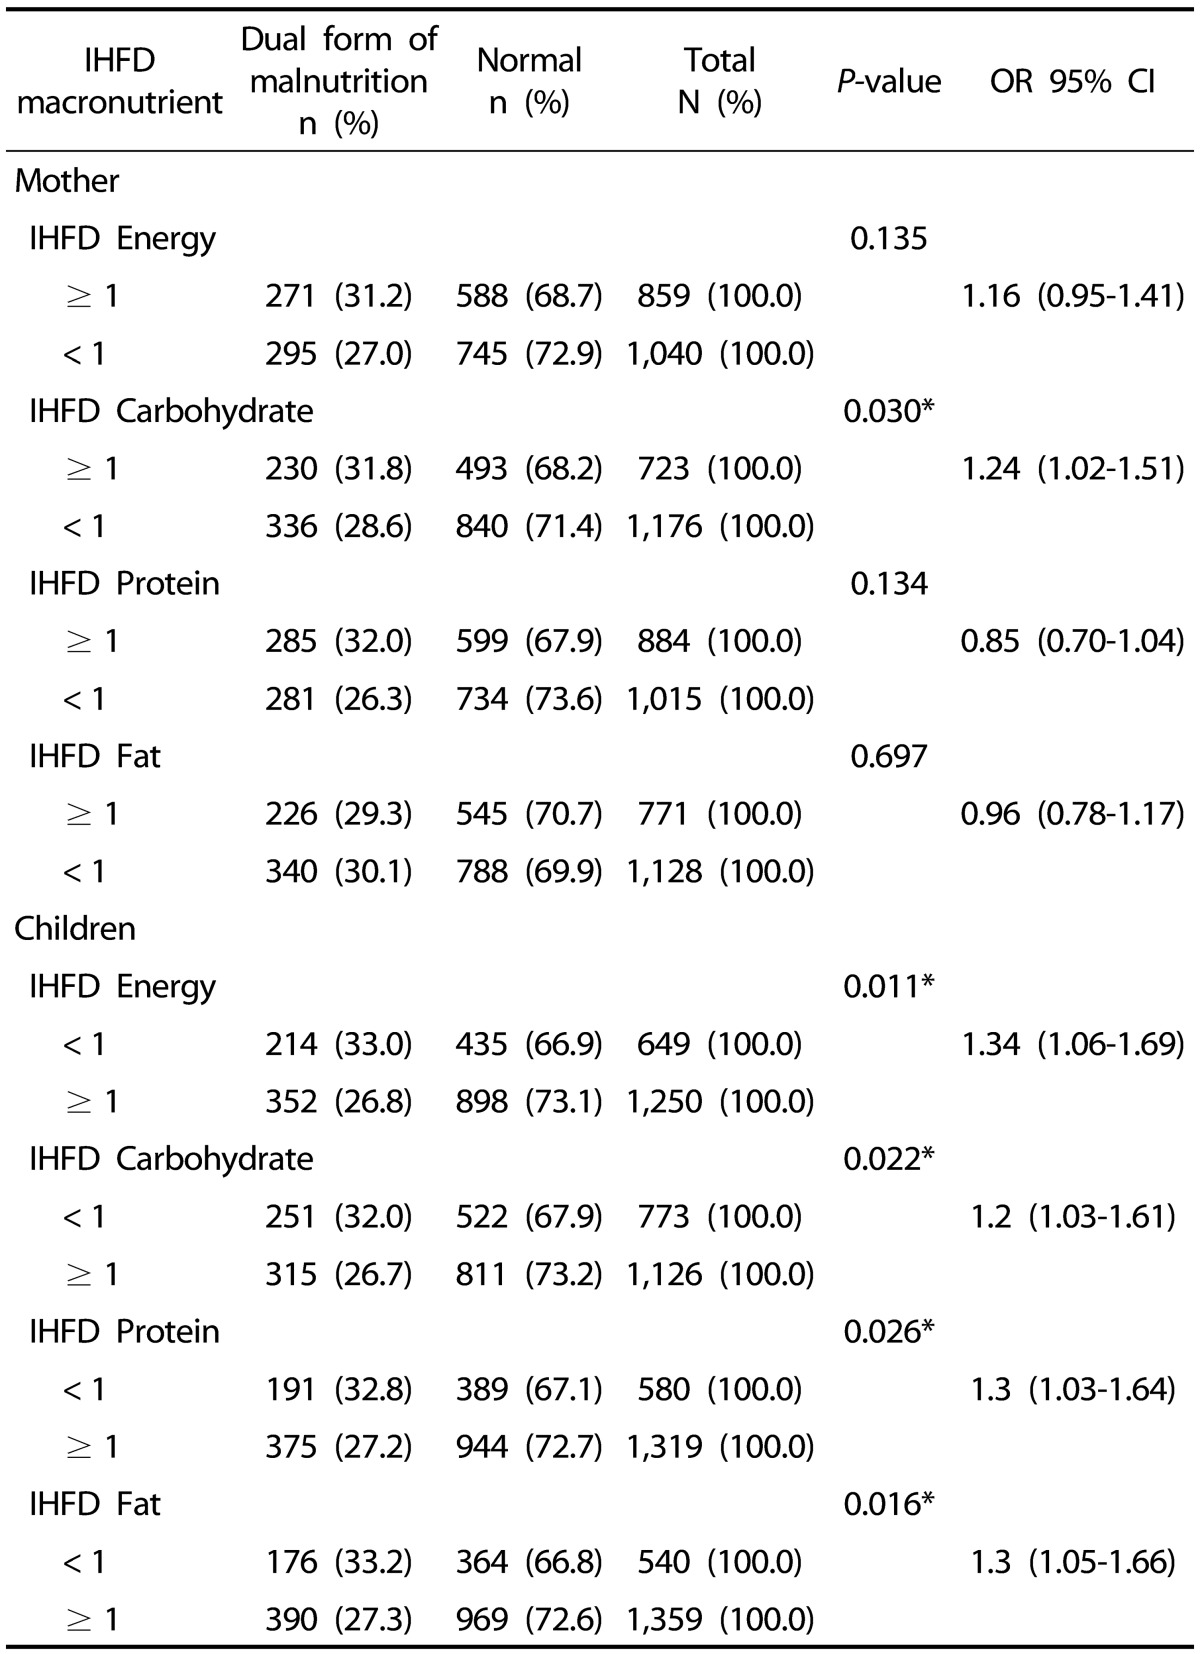
*P < 0.05; IHFD < 1: Someone received lower food intake than other family members; IHFD ≥ 1: Someone received similar or higher food intake than other family members
DISCUSSION
The objective of this study was to examine the relationship between child-mother food distribution and DFM occurrence. It appears that children received less macronutrients while mothers received higher food allocation, leading to DFM in households.
Nutrition problems among mother and child pairs are usually higher than among other age groups (e.g. teenagers, male adults). Preliminary analysis was carried out by the author to determine the magnitude of malnutrition among all family members. Results show that the prevalence of malnutrition in child and mother pairs was higher compared to other family members (prevalence of overweight fathers (11.3%), underweight fathers (11.0%), overweight teenagers (2.5%), underweight teenagers (7.4%), overweight adolescents (1.4%), and underweight adolescents (7.1%)). Furthermore, both mothers and children aged under 5 years were found to be vulnerable groups, as these populations are targets of health indicators for MDG achievement.
Prevalence of malnutrition in 36 countries (Latin America, Africa, and Asia) is known to range from 0-15% [5]. However, a study in Malaysia reported a 25.8% DFM rate [4], and another study in Manila reported a 59% DFM rate in mother and child pairs of which 8.2% were overweight mother-underweight child pairs [7]. This study observed a 29.8% DFM rate. Comparison of DFM rates should consider the target group and age for categorization of DFM.
Food consumption significantly differed between malnourished and normal children. Whereas normal children ate more than malnourished ones, no significant difference in macronutrient intake was observed between overweight and normal mothers. Flegal [24] reported that overweight people sometimes underreport their food intakes, a phenomenon known as flat slope syndrome. A previous study conducted in Michigan, U.S. found that 40% of white women, 32% of white men, 47% of black men, and 52% of black women misreported their fat intakes by about 20% higher or lower than true values compared to protein or carbohydrate intake. Willet [25] defined flat slope syndrome as overestimation of portion size in those who eat smaller portions and underestimation of portion size by those who eat larger portions. IHFD is defined as inappropriate allocation of food within the household, leading to effects on certain family members. Thus, some individuals may suffer from malnutrition due to the pattern of food distribution within the household [23]. Our results show that children consumed significantly less macronutrients (P < 0.05) while mothers ate more macronutrients, especially carbohydrates (P < 0.05), energy, and protein compared to other family members. Thus, children who ate less and mothers who ate more macronutrients were more prone to DFM (Table 5).
In addition, certain family characteristics affected unequal food distribution amongst children. As shown in Table 3, girls more often received less macronutrients than boys, especially energy, carbohydrates, and protein. This result is similar to a study conducted in Matlab Bangladesh in which food allocation (especially energy and protein) differed between boys and girls at all age groups (0-4 years). Intake ratios of calories and protein were 1.16 and 1.14 times higher in boys compared to girls, respectively. These figures were possibly due to the fact that most boys have a higher body weight and thus higher basal metabolism than girls [26].
There are still some areas where cultural differences, parental care, intra-family food distribution, feeding practices, utilization of health services, and behavioral mechanisms are still very much influenced by sex-bias attitudes. Socioeconomic conditions might also contribute to food allocation among family members. In Tables 3 and 4, children of lower socioeconomic status were more likely to consume less macronutrients than those of higher status. On the contrary, mothers of lower socioeconomic status consumed more macronutrients than those of higher status. This particular situation may explain the higher proportion of DFM among low status families.
One of the determinants determining child food patterns [27] is family income. Income is one of the determining factors for establishing healthy food patterns. Families of low socioeconomic status eat less fruits and vegetables as well as more fat and snacks. Families of low socioeconomic status also consume more main staples and side dishes than vegetables and fruits, which cost more and are less filling. Khor [10] mentioned that low status families have limited access to fiber-rich sources such as cereal, vegetables, and fruits and instead consume food types high in fat, instant foods, fast foods, and high in salt.
We acknowledge strong limitations of the current study. Conditions of the subjects that might have influenced their intakes have been considered in the current study, such as whether or not subjects were on a diet as well as whether or not their patterns represent their usual intakes. Further, there is no information on mothers who had given birth in the last 3 months, which could have influenced their relevant intakes or body weight.
This study found that there are unequal food distributions among family members, especially children and mothers. Most children receive lower macronutrient intakes, whereas mothers receive greater macronutrient intakes. This situation leads to higher risk of DFM. Moreover, unequal food distributions exist more among families of low socioeconomic status, who have access to less resources. The results demonstrate that nutritional education is very important to increase awareness of the impact of DFM. Further studies should explore micronutrient allocation among family members, particularly at certain ages.
Footnotes
Author thanks the National Institute of Health Research and Development, Ministry of Health Indonesia for permission to use data of the National Health Survey (RISKESDAS 2010).
References
- 1.Doak CM, Adair LS, Bentley M, Monteiro C, Popkin BM. The dual burden household and the nutrition transition paradox. Int J Obes (Lond) 2005;29:129–136. doi: 10.1038/sj.ijo.0802824. [DOI] [PubMed] [Google Scholar]
- 2.Doak CM, Adair LS, Monteiro C, Popkin BM. Overweight and underweight coexist within households in Brazil, China and Russia. J Nutr. 2000;130:2965–2971. doi: 10.1093/jn/130.12.2965. [DOI] [PubMed] [Google Scholar]
- 3.Doak C, Adair L, Bentley M, Fengying Z, Popkin B. The underweight/overweight household: an exploration of household sociodemographic and dietary factors in China. Public Health Nutr. 2002;5:215–221. doi: 10.1079/PHN2001296. [DOI] [PubMed] [Google Scholar]
- 4.Saibul N, Shariff ZM, Lin KG, Kandiah M, Ghani NA, Rahman HA. Food variety score is associated with dual burden of malnutrition in Orang Asli (Malaysian indigenous peoples) households: implications for health promotion. Asia Pac J Clin Nutr. 2009;18:412–422. [PubMed] [Google Scholar]
- 5.Garrett J, Ruel M. Stunted child-overweight mother pairs: an emerging policy concern? 17th International Congress of Nutrition. Ann Nutr Metab. 2001;45:404. [Google Scholar]
- 6.Gillespie S, Haddad I. Attacking the double burden of malnutrition in Asia and the Pacific. Washington, D.C.: International Food Policy Research Institute; 2001. [Google Scholar]
- 7.Angeles-Agdeppa I, Lana RD, Barba CV. A case study on dual forms of malnutrition among selected households in District 1, Tondo, Manila. Asia Pac J Clin Nutr. 2003;12:438–446. [PubMed] [Google Scholar]
- 8.Yamborisut U, Kosulwat V, Chittchang U, Wimonpeerapattana W, Suthutvoravut U. Factors associated with dual form of malnutrition in school children in Nakhon Pathom and Bangkok. J Med Assoc Thai. 2006;89:1012–1023. [PubMed] [Google Scholar]
- 9.Oddo VM, Rah JH, Semba RD, Sun K, Akhter N, Sari M, de Pee S, Moench-Pfanner R, Bloem M, Kraemer K. Predictors of maternal and child double burden of malnutrition in rural Indonesia and Bangladesh. Am J Clin Nutr. 2012;95:951–958. doi: 10.3945/ajcn.111.026070. [DOI] [PubMed] [Google Scholar]
- 10.Khor GL, Sharif ZM. Dual forms of malnutrition in the same households in Malaysia--a case study among Malay rural households. Asia Pac J Clin Nutr. 2003;12:427–437. [PubMed] [Google Scholar]
- 11.Khan NC, Khoi HH. Double burden of malnutrition: the Vietnamese perspective. Asia Pac J Clin Nutr. 2008;17(Suppl 1):116–118. [PubMed] [Google Scholar]
- 12.Khor GL. Food-based approaches to combat the double burden among the poor: challenges in the Asian context. Asia Pac J Clin Nutr. 2008;17(Suppl 1):111–115. [PubMed] [Google Scholar]
- 13.Lee J. Nutritional factors and household characteristics in relation to the familial coexistence of child stunting and maternal overweight in Guatemala [doctor's thesis] Medford (MA): Tuft University; 2009. [Google Scholar]
- 14.Jennings AR. Identifying the determinants of coexisting over and undernutrition in Cebu, Philippines [doctor's thesis] Chapel Hill (NC): University of North Carolina; 2007. [Google Scholar]
- 15.Caballero B. A nutrition paradox--underweight and obesity in developing countries. N Engl J Med. 2005;352:1514–1516. doi: 10.1056/NEJMp048310. [DOI] [PubMed] [Google Scholar]
- 16.Kapoor SK, Anand K. Nutritional transition: a public health challenge in developing countries. J Epidemiol Community Health. 2002;56:804–805. doi: 10.1136/jech.56.11.804. [DOI] [PMC free article] [PubMed] [Google Scholar]
- 17.Hawks SR, Merrill RM, Madanat HN, Miyagawa T, Suwanteerangkul J, Guarin CM, Shaofang C. Intuitive eating and the nutrition transition in Asia. Asia Pac J Clin Nutr. 2004;13:194–203. [PubMed] [Google Scholar]
- 18.Popkin BM. Will China's nutrition transition overwhelm its health care system and slow economic growth? Health Aff (Millwood) 2008;27:1064–1076. doi: 10.1377/hlthaff.27.4.1064. [DOI] [PMC free article] [PubMed] [Google Scholar]
- 19.Pagaspas RM. Influence of intra-household food distribution practices on the nutritional status of individual members among urban poor households in East Jakarta [master's thesis] Depok: University of Indonesia; 1994. [Google Scholar]
- 20.Nandy S, Miranda JJ. Overlooking undernutrition? Using a composite index of anthropometric failure to assess how underweight misses and misleads the assessment of undernutrition in young children. Soc Sci Med. 2008;66:1963–1966. doi: 10.1016/j.socscimed.2008.01.021. [DOI] [PMC free article] [PubMed] [Google Scholar]
- 21.Bose K, Jr, Mandal GC. Proposed new anthropometric indices of childhood undernutrition. Malays J Nutr. 2010;16:131–136. [PubMed] [Google Scholar]
- 22.Mandal GC, Bose K. Assessment of overall prevalence of undernutrition using composite index of anthropometric failure (CIAF) among preschool children of West Bengal, India. Iran J Pediatr. 2009;19:237–243. [Google Scholar]
- 23.Senauer B, Garcia M, Jacinto E. Determinants of the intrahousehold allocation of food in the rural Philipines. Am J Agric Econ. 1988;70:170–180. [Google Scholar]
- 24.Flegal KM. Evaluating epidemiologic evidence of the effects of food and nutrient exposures. Am J Clin Nutr. 1999;69:1339S–1344S. doi: 10.1093/ajcn/69.6.1339S. [DOI] [PubMed] [Google Scholar]
- 25.Willett WC, Howe GR, Kushi LH. Adjustment for total energy intake in epidemiologic studies. Am J Clin Nutr. 1997;65:1220S–1228S. doi: 10.1093/ajcn/65.4.1220S. [DOI] [PubMed] [Google Scholar]
- 26.Chen LC, Huq E, D'Souza S. Sex bias in the family allocation of food and health care in rural Bangladesh. Popul Dev Rev. 1981;7:55–70. [Google Scholar]
- 27.Patrick H, Nicklas TA. A review of family and social determinants of children's eating patterns and diet quality. J Am Coll Nutr. 2005;24:83–92. doi: 10.1080/07315724.2005.10719448. [DOI] [PubMed] [Google Scholar]


