

Summary
Conventional microscopy techniques, namely the confocal microscope or deconvolution processes, are resolution limited, ~250 nm, by the diffraction properties of light as developed by Ernst Abbe in 1873. This diffraction limit is appreciably above the size of most multi-protein complexes, which are typically 20–50 nm in diameter. In the mid 2000s, biophysicists moved beyond the diffraction barrier by structuring the illumination pattern and then applying mathematical principles and algorithms to allow a resolution of approximately 100 nm, sufficient to address protein subcellular colocalization questions. This “breaking” of the diffraction barrier, affording resolution beyond 200 nm is termed super resolution microscopy. More recent approaches include single molecule localization (such as PhotoActivated Localization Microscopy (PALM)/STochastic Optical Reconstruction Microscopy (STORM)) and point spread function engineering (such as STimulated Emission Depletion (STED) microscopy). In this review, we explain basic principles behind currently commercialized super resolution setups and address advantages and considerations in applying these techniques to protein colocalization in biological systems.
Keywords: super resolution microscopy, fluorescence microscopy, STORM, SIM, STED, confocal microscopy
1. Introduction
In practice, protein co-localization within cells is most commonly done by fluorescence microscopy, a technique in which the planar distribution of light emitted by protein-specific fluors is compared (for a previous review, see Storrie, Starr and Forsten, 20088). Until recently, this approach had a resolution of no better than 200 nm due to the diffraction properties of light. As stated by Ernst Abbe in 1873, diffraction prevents resolution of two objects if their distance apart is less than half of the full width half maximum (FWHM) generated by their point spread function [1]. Fluorescence microscopy cannot alter physics. However, when combined with the cleverness of the human mind, the diffraction limit can be overcome. Here, we consider any technique that provides a resolving power beyond that of the diffraction limit to be super resolution microscopy.
In reality, the development of fluorescence microscopy can be compared to the process of peeling an onion in which one layer after another is revealed. In practice, the first limit was not diffraction but brightness. In the early 1970s, the introduction of epifluorescence microscopy revolutionized the field by overcoming much of the brightness limitations at high magnifications (40–100x), making possible localization studies at the full diffraction limited resolution of the light microscope. In this configuration, the objective serves both as the condenser and objective and the light source was placed 90 degrees to the objective. Light was reflected onto the specimen using a dichroic mirror. This arrangement minimized background contributions from the excitation light and more importantly, the intensity of the collected fluorescence light now increased with the objective’s numerical aperture. In contrast, for previous optical configurations in which the condenser and objective were separate optical elements, fluorescence intensity failed to increase with numerical aperture and brightness decreased with magnification [2]. With these advances, routine studies of protein co-localization became possible with a resolution approaching 200 nm in nearly flat, two-dimensional space, conditions found most commonly at the periphery of well-spread tissue culture cells.
Cells, though, are not two-dimensional objects. Even tissue culture fibroblasts are thicker towards the cell center where the nucleus is located. Cell types such as epithelial cells lining an organ (e.g., the intestine) are columnar in three-dimensional space. The overall planar resolution of the epifluorescence microscope, often simply referred to as the wide-field microscope, is limited in practice by sample thickness. Light from both above and below the plane of focus is collected. As shown in Figure 1A, this affects image acuity even for small cells such as human platelets that are discoid in shape with a thickness of about 1.5 μm and a diameter of about 3 μm. Hence an image co-localizing 2 different α-granule proteins, von Willebrand factor and fibrinogen, in an isolated platelet appears hazy making he extent of co-localization difficult to assess. Deconvolution algorithms in which the light distribution is corrected on the basis of the point spread functions allow for contrast improvement as shown in Figure 1B, but not a gain in resolution [3].
Figure 1. SIM technology increases resolution in the XY dimension and increases contrast over conventional techniques.
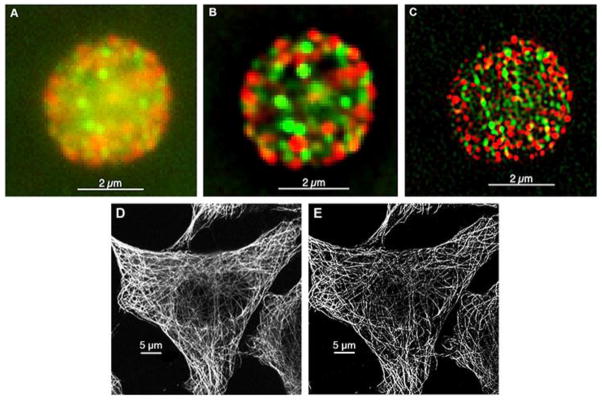
A single image plane from a human platelet viewed by wide field microscopy (A), after deconvolution (B), and by 3D-SIM microscopy (C). As a resolution example, we scanned microtubules in cells by either confocal microscopy (D) or 3D-SIM (E). These 24 nm objects imaged by Cy3 emission (red) had an apparent XY width (diameter) of 250 nm by confocal microscopy and 100 nm resolution by 3D-SIM demonstrating approximately 2-fold better XY resolution than that achieved by confocal microscopy.
In this review, we compare developing super resolution techniques including structured illumination microscopy (SIM), stimulated emission depletion microscopy (STED) and photoactivation localization microscopy/stochastic optical reconstruction microscopy (PALM/STORM) with conventional wide field and confocal microscopy. We briefly explain the basic principles of each technique and consider advantages and challenges in confronting these new possibilities in microscopy. Microscope setup and probe use are illustrated by examples from our own work in cellular membrane trafficking and platelet biology. Biological applications to the problem of protein co-localization in cells are highlighted. We close our review with a brief commentary on additional tools needed to make super resolution techniques truly accessible to the general life science community.
2. Conventional light microscopy: wide field + deconvolution and confocal microscopy
Current microscopy techniques take advantage of high numerical aperture objectives, refractive index-matched mounting media, and immersion oils to approach the diffraction barrier of approximately 200 nm [1]. In practice, obtaining resolution is easier at shorter wavelengths of light as predicted quantitatively by Abbe’s equation for diffraction limited resolution. Unfortunately, dyes that fluoresce at shorter wavelengths have lower quantum yield and often have poor photostability that negates increases in exposure time. As proteins and nucleic acids absorb in the UV range, the use of ever shorter wavelengths of light is not possible. Collectively, this limits resolution in the XY dimension. Resolution in the Z dimension is distinctly worse, approaching only 500–700 nm [4]. The optical system of the laser scanning confocal microscope in which pinholes are used to eliminate out-of-focus light when combined with the algorithms of deconvolution software is presently the workhorse of conventional techniques. Pinpoint apertures are used to exclude background light emitted from fields below and above the point of interest [2, 5]. A three dimensional image set is obtained by moving the focal plane up and down through the specimen in the Z dimension, giving a stack of images. In brief, these techniques provide gains in signal to noise ratio and a reduction of background signal. Image stacks of 10–50 μm thickness can be obtained and three dimensional images generated by rendering techniques. Deconvolution is sufficiently powerful such that wide field images can be mathematically ‘haze-busted’ as shown in Figure 1B [3]. In general, these techniques lend themselves to answering general questions about localization of proteins to membranes or organelles as well as three-dimensional structure of a whole sample. As discussed previously, algorithms can then be used to quantitatively compare protein distributions at the individual pixal or voxel level of the images (earlier review).
However, conventional fluorescence microscopy cannot address questions regarding protein complex dynamics as molecular machines. The average molecule is approximately 2 nm in the XY dimension. If we consider an assembly of proteins resulting in a 50 nm complex, the diffraction limit of 200 nm results in a point spread function nearly four times larger than the average molecule. One can easily see the impossibility of resolving individual complexes in the three dimensional space of a cell under these limitations. The objective, then, of super resolution microscopy is to bring these resolution parameters to a level approaching the underlying protein complexes being studied. With small fluorescent probes, recent work suggests that the resolution of fluorescence microscopy, nearing approximately 10 or 20 nm, can approach that of electron microscopy. In localizing near the cell molecule level, fluorescense microscopy has the obvious benefit of being a non-destructive technique that can support live-cell imaging.
3. Super Resolution Microscopy Approaches
There are three emerging approaches to super resolution microscopy: structured illumination microscopy (SIM), localization-based using either photoactivated localization microscopy (PALM) or stochastic optical reconstruction microscopy (STORM), and point spread function engineering (stimulated emission depletion microscopy, or STED). These three approaches are all currently being commercialized for use in biological sciences. Most of these use mathematical approaches to extend resolution beyond the diffraction limit. SIM improves resolution to 100 nm in the XY direction and 250 nm in the Z direction [6], whereas PALM/STORM techniques improve resolution to 20 nm in the XY direction and 50 nm in the Z dimension [7, 8]. As a comparison, STED improves resolution to less than 50 nm in the XY direction under optimal conditions [9]. We highlight basic concepts underlying super resolution techniques in this section.
3.1 Structured Illumination Microscopy (SIM)
SIM techniques take advantage of the physical observation of Moiré fringes made by Lukosz and Marchand in 1963 [10] and apply those observations to calculate light distribution. The general principle is that a grid pattern can be superimposed upon another grid pattern at different angles to yield a third pattern containing Moiré fringes. These three patterns are mathematically related such that if the spatial frequencies of two of the three patterns are known, the frequency of the third can be back calculated. Thus, in SIM, light is structured upon a sample (pattern 1) in a grid pattern (pattern 2), and the resulting Moiré fringe (pattern 3) is collected via the objective in different planes [6]. An associated advanced workstation and software package calculates the three-dimensional structure of the sample based on the presented Moiré fringes and imposed light grid. The sample is examined from multiple angles to improve resolution in the XY and Z direction. SIM is limited primarily by the illumination pattern, which is deliberately chosen to be close to the diffraction limit, resulting in a finer pattern and a higher gain in resolution. Illumination patterns are introduced in the focal plane by one of several methods. Gustafsson’s method is to project a diffraction grating with multiple rotations on the rear aperture of the objective [11], while other variations take advantage of spatial light modulators to move the pattern [12]. Using spatial modulators is advantageous so that samples and microscope components need not be rotated, but may in practice be limited by pixel density and the flatness of the spatial light modulator. The last method that has been employed is to introduce the illumination pattern into the focal plane using total internal reflection fluorescence (TIRF) microscopy [13]. The spatial frequency of the imposed pattern can be increased by a factor of two, and therefore a corresponding increase in resolution results in the XY and Z dimensions would give a total of 8-fold increase in resolution [14]. Thus, SIM increases resolution in the XY dimension to 100 nm and the Z dimension to approximately 250 nm.
3.2 Super Resolution Techniques Based on Localization Mapping
First we must address the concept of reversible saturable optical fluorescence transitions (RESOLFT). Briefly, the principle is that fluorescent molecules can be turned reversibly “on” in an excited, fluorescent state and “off” in a ground, nonfluorescent state. Importantly, at high light excitation intensity, the probability of a molecule returning to the ground state is reduced [15]. Probes used for super resolution microscopy are chosen because these have the ability to switch repetitively between the “on” and “off” without being destroyed. These concepts are of utmost importance for techniques based in single-molecule localization microscopy.
3.2.1 PALM/STORM
PALM/STORM techniques have been compared to the pointillism techniques developed in the 1880s by the painters Georges Seurat and Paul Signac. If we consider Abbe’s law of diffraction, resolution is limited by how close together two molecules are. For example, consider a protein cluster of 5 fluorescent proteins as shown in Figure 2. The proteins in most organelles will be too close together to resolve effectively if the entire protein population is excited. Using the PALM technique, only a subset of proteins will be randomly excited at a time and recorded at that point in time and space. This subset is then turned off by a short-wavelength, high intensity laser and a second subset randomly activated. In this manner, it is possible to visualize disperse proteins one at a time, isolate the individual molecule’s point spread function, and then mathematically predict the XY center of that emission event [7, 8, 16]. The success of PALM/STORM depends on photoswitchable (PS) and photoactivatable (PA) proteins or dyes. A photoactivatable probe exists natively in the inactive and nonfluorescent state. Upon a brief laser excitation, the fluorophore becomes active and if irradiated sufficiently long, will be photobleached [16]. In contrast, a photoswitchable fluorophore starts in an active, fluorescent state (state A), and upon laser excitation, switches to a second active fluorescent state (state B) [17, 18]. The general principle is to use low powered lasers to stochastically, i.e., randomly, excite “blinking” fluorescent molecules in the sample. Only a random subset of the molecules will be active and fluoresce. The image is recorded and the molecules return to a ground, or “dark” state. The laser is again used to excite a new subset of molecules. The same field is imaged over thousands of frames, and an image is constructed based on the region of space molecules occupy relative to one another. In this way, coordinates of a few molecules are recorded at a time until all of the molecules are imaged to give a complete molecular map. Overall, PALM/STORM techniques could ideally bring resolution in the XY dimension to 20 nm [7, 8].
Figure 2. Diagram of RESOLFT and single molecule localization principles.

Five GFP proteins clustered together are shown in the first panel. The idea behind PALM/STORM technologies is that only a subset of proteins is turned “on” by a laser. This subset is imaged and recorded and is then turned “off.” The laser then activates a second random subset and an image is recorded. An off-line microscope workstation compiles the data to regenerate a full image.
3.2.2 Specific Considerations for Successful PALM/STORM
The success of PALM/STORM techniques depends on high molecular labeling density and low nonspecific sample background [19]. Additionally, the switching rate, switching contrast, and image buffer are important considerations when choosing probes for PALM/STORM. Photobleaching is prevented using an oxygen-scavenging buffer system. However, it should be noted that different probes demand different buffering conditions [20]. For example, rhodamine and oxazine dyes (most Alexa Fluor and ATTO dyes) blink very well under a cysteamine, glucose oxidase, catalase buffering system, whereas the carbocyanine dyes (Cy5, Cy5.5, Alexa Fluor 647) blink optimally when an alternate enzymatic oxygen scavenging system is employed [21, 22]. For two-color imaging, matching buffers is crucial for success. An explanation of photoswitching mechanisms and brief commentary of which buffer conditions are optimal for conveniently available dyes is provided in reference 20.
3.2.3 PALM vs. STORM
PALM differs from STORM primarily in probe choice. The original PALM method makes use of GFP variants including Dronpa fluorescent protein, photoactivatable GFP, photoswitchable cyan fluorescence, and photoactivatable mCherry1 [23–27]. Early applications of STORM made use of dye pairs, whereby the protein of interest is labeled with two dyes, typically Cy3 and Cy5. Cy5 emits fluorescence upon excitation with a red laser length, and is then switched off. Exposure to green laser light switches Cy5 back “on,” however, this depends on the proximity of the second dye, Cy3 [18]. They can be switched on and off hundreds of times before photobleaching occurs. Additional combinations of dyes include Alexa Fluor 405 and Alexa Fluor 647. Dye pairs have been largely replaced by direct STORM (dSTORM), a third mechanism of single molecule localization whereby single dyes (versus a dye pair) can be turned on and off, including Cy5, Alexa Fluor 647, and ATTO 488 [17, 28, 29]. Importantly, all of these systems benefit from the inclusion of a reducing agent and oxygen scavenger in the visualization media [20, 21].
3.2.4 STED
Stimulated emission depletion (STED) microscopy was developed by Stephan Hell in 1994 as a point spread function engineering strategy [9]. The principle takes advantage of photoswitchable probes and the concept that a second laser is used to reduce the size of the recorded point spread function of a fluorescent molecule. The first laser provides an excitation beam and excites RESOLFT-compatible fluorescent dye molecules or proteins. The first laser pulse is short, approximately 0.1 femtoseconds. Immediately after excitation, the second laser, or emission beam, irradiates the molecules before they re-emit photons at their emission spectrum. The shape of the second beam is in the shape of a ring or donut (also called the depletion or STED beam). This forces the molecules to remain in the excited state and are quenched, depleting their fluorescence. This allows shaping of a point spread function because while those molecules within the ring are not quenched, those that lie in the path of the STED beam are [9]. The benefit of using photoactivatable probes is that STED is a scanning technique not unlike confocal laser scanning microscopy, so that the laser path scans the specimen. Illumination of the next molecule subset depends on the ability of the first set to return to a ground state. Resolution depends on the intensity of the STED beam laser, and resolution directly increases with increase in laser intensity by allowing molecules at the outer ring of the STED beam to be switched off, decreasing the diameter of the PSF [9].
4. Advantages of Super Resolution
Improved ability to distinguish between two point objects is implied by the term “super resolution”. Indeed, SIM increases the lateral and axial resolutions twofold in each dimension using conventional excitation techniques. Collectively, this results in a total of an eight-fold increase in resolution over conventional confocal techniques. Other approaches using RESOLFT principles yield even further improvement. We highlight here the advantages of super resolution using our studies of platelet’s α-granule structure, a platelet organelle that is approximately 200 to 500 nm in diameter. As shown in Figure 1A versus B, wide field microscopy coupled with deconvolution cuts background haze significantly, but SIM methods result in clearer images with a high signal to noise ratio and substantial contrast improvement, as shown in Figure 1C. As an additional example, we scanned microtubules by both laser scanning confocal microscopy and SIM, and as shown in Figure 1D and 1E, it is clear that SIM technologies greatly enhance resolution and contrast. Additionally, it is important to note that while a combination of wide field microscopy and deconvolution software improves contrast, they do not increase resolution. PALM/STORM increases the lateral resolution to approximately 20 nm under ideal conditions. As an example, in Figure 3A–3B, we show the resolution of the demarcating membrane of alpha 1-antityprsin mutant inclusion bodies by 3D-SIM, a situation not resolvable by confocal microscopy. We also labeled platelet α-granules with P-selectin, a membrane marker. Distinguishing demarcating membranes of organelles has been impossible with conventional techniques, and as shown in Figure 3C, it is apparent that dSTORM techniques allow substantial improvement in resolving small granular and vesicular structures. Organelles the size of an α-granule are typically resolve merely as a diffraction-limited bright fluorescent spot. Here P-selectin partially surrounds what may be the non-fluorescent lumen of the granule; a half-moon pattern is observed. The result is encouraging and we speculate that antibody labeling density and steric hindrance likely prevent the generation of a full membrane structure.
Figure 3. Super resolution techniques resolve membrane versus organelle contents.

Alpha-1 antitrypsin-tagged GFP protein (ATZ-GFP) was transfected into HEK293 cells. An ER protein, BAP31, was labeled using antibodies, and cells were imaged using either (A) laser scanning confocal microscopy (LSM) or (B) SIM. Arrowheads point to the inclusion bodies of interest. Note that a clear membrane structure surrounding the inclusion body can be resolved by SIM, but not LSM. P-selectin, a platelet α-granule marker, was labeled using a P-selectin antibody and an anti-goat Alexa Fluor 647 secondary antibody and imaged using dSTORM (C). The white arrow in the inset (5x) points to a “cupped” outline of the α-granule, previously unresolved by wide field or confocal technologies. Note that the ability to develop a full circular outline of the granule membrane may be limited by density of the P-selectin molecules.
Because SIM and PALM/STORM techniques both report an intensity value at each pixel/voxel position, they immediately lend themselves to being useful for quantitative distribution and hence co-localization comparisons. As shown in Figure 4, Golgi structures from SIM images are easily converted to an XY intensity array in multiple colors using currently available dyes and proteins that work well in multichannel conventional imaging. Overall, it is evident that these approaches provide advantages that improve the precision of co-localization over the traditional wide field and confocal practice, particularly by improving contrast and resolution.
Figure 4. Super resolution techniques are inherently quantitative.

The resolution of 3D-SIM (B), but not confocal (A), is sufficient to separate cisternal Golgi Apparatus (green) and the trans Golgi network (blue): a quantitation of intensity and resolution in XY plane for laser scanning confocal versus 3D-SIM. HeLa cell Golgi apparatus are labeled by GalNAcT2-GFP (cisternal Golgi, green) and antibody against Rab6 (trans Golgi network, blue). Insets give quantitation of intensity versus distance.
5. Technical Considerations in Super Resolution Techniques
The spatial benefits of super resolution microscopy are evident. However, acquisition speed, camera selection, post-processing, and probe use must be considered when developing an application of these technologies to your research problem. To give just one very simple example, a dSTORM approach in which 40,000 frames are collected to give the final image is hardly appropriate for a research goal of resolving events occurring over time. Each aspect of the imaging system setup should be carefully planned and optimized to obtain the best possible data for the individual laboratory, and it is evident that one type of super resolution microscopy may be better suited for one’s experiment than another. We highlight important technical choices in this section and consider different applications in the next.
5.1 Probes and Dyes
For confocal systems, the issues of selective detection and photobleaching of dyes have been resolved in practice by using multiple lasers, optical filters and photobleach-resistant dyes including cyanine dyes or the Alexa Fluor dye line combined with anti-fade reagents such as N-propyl gallate [20]. Currently available antibodies, dyes, and fluorescent proteins provide useful data for up to 4 channels with most wide field and confocal systems, provided labeling conditions are optimized. By comparison, super resolution techniques that rely on RESOLFT dyes are complex, and good choices are not always available even when the goal is as basic as a 2 channel localization. Therefore, in considering a super resolution microscopy system, care must be taken to choose probes, proteins, and dyes that work optimally.
On the whole, SIM systems could optimally utilize currently available dyes, proteins, and antibodies. A brief compilation of available dyes for SIM and other super resolution techniques can be found in Table 1. Of all the super resolution techniques, SIM is least limited by dye and probe choice and in our experience, multichannel imaging of samples can be done easily. In contrast, such limitations make PALM/STORM and STED techniques a less robust choice for multi-channel co-localization work. Although Alexa Fluor 647 dye is well documented as a strong blinking photoactivatable fluorophore that has been very successful in localization mapping techniques [30], its use as a dye to give co-localization may be more difficult. Most biologists are interested in two-color fluorescence as a minimal requirement for investigating molecular co-localization. Other dyes, such as ATTO 488 and Cy3B, have been recommended as partners for Alexa Fluor 647 [18, 29, 31]. We show in Figure 5 one brilliantly successful example of two color dSTORM localization. In this case, clathrin (ATTO 488-conjugated second antibody, red channel) is localized by antibody staining versus TGN46 (Alexa Fluor 647-conjugated second antibody, green channel). This is our first success in showing coated vesicles or buds in selective association with the trans Golgi network by fluorescence microscopy. However, we must consider that clathrin is concentrated as a multicopy protein in Golgi associated budding structures and vesicles, which lends itself to success. In our more general experience, the photophysics of these dyes together can be less than optimal. Literature and resources from microscope companies suggest secondarily that these probes be used for direct immunofluorescence, in which the probe is conjugated to the first antibody, rather than for indirect immunofluorescence, wherein the conjugation is to the secondary antibody. For many laboratories, this would be an additional challenge. Few commercialized antibodies are directly conjugated to these dyes. Moreover, optimization of antibody labeling density is required to ensure high quantum yield without background [30]. Expression of photoactivatable or photoswitchable proteins (PA-GFP, PA-mCh, etc.) is an enticing option, however, not all biological systems can be optimized for expressing these proteins. For example, platelets lack a transcriptional system and hence cannot be productively transfected with DNA. Another specific example is overexpression of certain proteins within cells. Overexpression of certain proteins can lead to alteration of signaling pathways or induction of apoptosis. Indirect immunofluorescence is still the cornerstone of co-localization and imaging techniques. The microscopy field must still focus on ways to tag molecules that prevent potential steric hindrance and hence effective co-localization studies below 50 nm. Likely better chemistry will prevail and solve at least partially solve the problem of multi-channel co-localization. However, depending on how the labeling is done, steric issues may still remain.
Table 1.
Probes for super resolution use.
| SIM | PALM | STORM | STED | |
|---|---|---|---|---|
| Synthetic Dyes | ||||
| ATTO 425 | X | X | ||
| Alexa Fluor 488 | X | X | X | |
| ATTO 488 | X | X | ||
| ATTO 532 | X | X | ||
| Cy3B | X | X | ||
| ATTO 565 | X | X | ||
| Alexa Fluor 568 | X | X | ||
| Alexa Fluor 594 | X | X | ||
| Alexa Fluor 647 | X | X | ||
| Cy5 | X | X | ||
| ATTO 590 | X | X | ||
| ATTO 633 | X | X | ||
| Cy7 | X | X | ||
| DyLight 750 | X | X | ||
| C-Rhodamine | X | X | ||
| C-Fluorescein | X | X | ||
| Fluorescent Proteins | ||||
| EGFP | X | X | ||
| EYFP | X | X | ||
| Citrine | X | X | ||
| Photoactivatable fluorescent proteins | ||||
| PA-GFP | X | X | ||
| PS-CFP2 | X | X | ||
| PA-mCherry1 | X | X | ||
| Photoactivatable fluorescent proteins | ||||
| tdEos | X | X | ||
| mEos | X | X | ||
| PSmOrange | X | |||
| Photoswitchable fluorescent proteins | ||||
| Dronpa | X | X | ||
| rsFastLime | X | |||
| bsDronpa | X | |||
| rsCherry | X | |||
| rsCherryRev | X |
Note that not every dye and probe listed has been tested for every technique. Thus, while ATTO 488 has been tested as effective for SIM and STORM, this does not mean it will not work for STED, merely that it may not have been tested for this application.
Figure 5. Three dimensional views are helpful in interpreting STORM images.

Clathrin (green) and the trans golgi network (red) were labeled with antibodies and imaged by dSTORM. A region of interest was cropped and different angles manipulated to observe co-localization of molecules in the Z dimension. Viewing structures in three dimensions provides added information helpful for drawing co-localization conclusions from super resolution data.
Scientists interested in temporal evaluation of cellular processes require live cell techniques. The necessity of taking thousands of frames for PALM/STORM to produce one full image prevents the ability to conduct live cell imaging experiments, a distinct disadvantage. For such temporal studies today, SIM provides the best time resolution, ~1 to 2 images per sec. We provide a brief table of applicable dyes for SIM, PALM/STORM, and STED applications, and an extensive review of fluorescent probes and their application in answering biological questions is provided in reference 27.
5.2 Sample Preparation
Preparing samples for super resolution microscopy demands precision and cleanliness. Using very clean, very flat, high precision #1.5 coverslips is central to sample preparation. All reagents used for preparing SIM or PALM/STORM samples should be filtered to reduce possible background noise. Preparation of fixed samples for PALM/STORM should include an extra fixative step post-secondary antibody incubation. Mounting media is a growing area of development as soft mount medias are recommended for super resolution techniques to avoid sample compression and image distortion. Refractive mismatch should be considered when choosing mounting media [20]. Some commercial mounting media may be useful for both SIM and PALM/STORM [20].
5.3 Imaging System Considerations
There are certain requirements that all super resolution microscopes require for optimal image acquisition. A highly sensitive EMCCD or CMOS detector, laser modules with optimized filter and dichroic mirror sets, and especially stage stability and vibration reduction modifications are particularly important. Vibration system tables and very stable microscope stands are recommended for all systems, and as always, high numerical aperture objectives are recommended for best resolution. Most systems can also be optimized for wide field microscopy as well for general focusing. The most important microscope requirement for SIM is an illumination module with different grating frequencies to match the light illumination pattern to the laser wavelength and objective lens [19]. Pattern rotation is also required. PALM/STORM systems usually include a TIRF system for minimization of background fluorescence, allowing detection of faint emission from single molecules. A laser system with 50–200 mW is required to give appropriate energy for single-molecule switching and imaging [7, 8].
STED microscopes require two laser wavelengths. Resolution depends on the intensity of the STED beam laser, and resolution directly increases with increase in STED laser intensity by allowing even molecules at the outer ring of the STED beam to be switched off, decreasing the diameter of the PSF [9]. As such, these systems often have lasers that operate at approximately 700 mW of power [9]. Additional components required for multicolor and 3D imaging are considered below.
5.4 Reducing Background, Drift and Alignment Issues
A distinct concern with regard to all super resolution techniques is that alignment of fields must be precise. Given the nature of super-resolution microscopy, movement of field by just a few nanometers can deliver compromised results. There are a variety of fiducial and non-fiducial markers on the market to compensate for drift, and these ultimately need to be optimized for each scientist’s system. SIM specifically comes with additional problems because grid background remains unless software applications are designed to remove it. This is illustrated in comparison of a wide field and SIM image of the Golgi, as shown in Figure 5. Note the distinct grid appearance in Figure 6D. There is some concern that increased in resolution could reveal reduced organelle continuity. As shown in Figure 6, some loss in Golgi continuity is apparent in the image collected from dSTORM techniques. Whether this loss is due to the failure to collect enough image frames or the inherent clustering of the labeled protein requires further experimentation. It is therefore very important to use appropriate controls and optimize dye conditions for the imaging system.
Figure 6. 3D SIM can produce artifacts.

Clathrin (red) and the trans Golgi network (green) were labeled with antibodies and imaged by widefield microscopy (A), confocal microscopy (B), and 3D SIM (C). The blow up of a region of the image reconstruction (D) reveals a grid pattern which is an artifact.
5.5 Post-Processing
Because most super resolution techniques rely on mathematical algorithms to extract frequency data of fluorescence intensities, post-processing is extensive. As previously described, SIM records a series of images by rotating different light grid patterns on the sample. A Fourier transform-based algorithm transforms grid patterns into frequency space to generate a full, reconstructed image. Reconstructions from 2D SIM are acquired by rotating the light pattern grid in the XY plane by 3 to 5 rotations and up to 5 phase shifts for up to 25 images, and gaining resolution in the Z dimension requires image stacking. In our experience, the raw data files for a 3 color, 10 μm image stack result in approximately five to ten gigabytes per stack. Image reconstruction based on these stacks requires complementary alignment and grid background removal software. Collectively, this means that SIM requires a high-end off-microscope workstation with high computing power. Acquisition of thousands of image frames is required for generation of one full image in PALM/STORM techniques, and each of those frames must be aligned and corrected for drift. By necessity, processing of these images is time-consuming and again requires a high end workstation computer. In concept, STED is not a computationally dependent technique and hence holds an advantage over other super resolution techniques. Nevertheless, deconvolution softwares are available specifically to enhance final STED resolution (e.g., Scientific Volume Imaging, Hiversum, the Netherlands).
6. Application of Super Resolution Techniques: Specificity is Key
The resolution and contrast enhancing ability of super resolution microscopy approaches make them attractive solutions for life scientists. However one super resolution technique may be more appropriate than another depending on the application and experimental questions. Hence, specificity and knowledge of how to best answer one’s scientific question are key in selecting a super resolution system. We highlight three of the major applications in biology and address context specific application of super resolution techniques below. A brief summary is provided in Table 2.
Table 2.
| Technique | |||
|---|---|---|---|
| Application | SIM | PALM/STORM | STED |
| Typical Resolution (XY) | 100 nm | 20–50 nm | 25–80 nm |
| Typical Resolution (Z) | 250 nm | 20 nm | 150–600 nm |
| Conventional Probes Available | All | Some | Some |
| Multicolor Imaging | 4-color | 2-color ideally | 2-color ideally |
| Live cell imaging | X | Limited by sampling approach | Inherently difficult |
| 3D imaging | X | X | X |
6.1 Multicolor Imaging
In our experience, SIM lends itself most easily to multicolor imaging, as shown in Figure 4. Implementation of SIM is immediately accessible for most life scientists due to the conventional nature of dyes and fluorescent proteins. By comparison, PALM/STORM techniques are less easily optimized for more than two colors, and often work best under conditions of one color localization studies. It is possible to do two-color imaging, as shown by Figure 5. Although STED systems can be used for two-color imaging, they have been primarily used for studies utilizing just one photoactivatable or photoswitchable probe. Dye choice primarily limits multicolor imaging for PALM/STORM and STED techniques.
6.2 3D Imaging
Three-dimensional data are a distinct advantage at the super resolution level. We illustrate this with a dSTORM example. As show in Figure 7, the interpretation of two color STORM images is clearer in 3D as illustrated by two observational angles provided in Figure 7. We note here that both SIM and STED were designed from the beginning to be 3D techniques in which vertical stacks of images are taken. PALM/STORM can be a 3D approach as illustrated by implementations from various manufacturers such as Nikon, Vutara and Zeiss (listed in alphabetical order). The acquisition of 3D data is particularly essential to demonstrating Z-resolution and generally comes at the cost of increased image collection time and processing time. One striking example of successful 3D-STORM is provided by the mapping the mitochondrial network in whole cells using dye pairs by Zhuang laboratory in [32].
Figure 7. With super resolution, the structural continuity of an organelle can be less apparent.

The trans-Golgi network (TGN46) (green) and medial Golgi (NAGT-1) (red) were labeled with the respective antibodies. Alexa Fluor 647 (green) was used for the trans-Golgi network secondary antibody, and Cy3B was used for the medial-Golgi network secondary antibody, and samples were imaged via either wide field microscopy (top panel) or dSTORM (bottom panel). It is clear that is some structural continuity loss in the Golgi apparatus resulting from dSTORM, likely due to protein clustering or limitations in the efficiency of dye photophysics. Investigators will often superimpose a SIM or confocal image on the dSTORM outcome to reveal a better sense of organelle structure.
6.3 Live Cell Imaging
Live cell imaging primarily requires the ability to change focus and collect images at short exposures as quickly as possible without shifts in temperature or movement. By necessity, it requires as little photobleaching as possible and reduced background noise from outside light sources. As has been mentioned, super resolution techniques falter with live cell imaging primarily due to speed and the absolute requirement for stability. To date, variations on SIM have been most successful. Recent developments have shown vast improvements in utilizing super-resolution for three-dimensional microscopy of living Drosophila cells in TIRF mode in which samples were flattened against a pad of agarose gel [14]. Of particular significance in this application was the use of spatial light modulators to generate phase shifts without mechanical movement. Camera efficiency is important in any imaging application, but is particularly imperative under live cell imaging considerations. Increased sensitivity and speed, and reduced specimen damage could be gained by using either a high efficiency EMCCD camera or a scientific CMOS camera. For live cell, multi-channel 3D SIM approaches, the use of individual cameras for each channel increases collection speed with some cost in system complexity. STED as a laser scanning technique has most of the advantages and disadvantages of laser scanning confocal microscopy. STED has indeed been applied to live cell imaging, but is limited presently to the XY dimension and to small fields, for which this strategy is most efficient [33]. Perhaps parallel STED image collection as in the case of confocal microscopy where much live cell work is done with spinning disk systems in which light from many pinholes are collected in parallel can some day be implemented.
PALM/STORM systems present an inherent challenge in terms of acquisition speed. By their nature, these systems require 1000s of frames to produce a stochastic image. For now, it is our opinion that these techniques are unlikely to have general applicability in live cell imaging. That said, PALM has been used to study adhesion-complex dynamics [34]. In this case, the movement being studied was slower than most biological movements.
7. Conclusions and Comments
New techniques are developed in the hope of obtaining concrete answers to biological questions and to be able to ask better questions. Ideally, super resolution microscopy approaches provide both. However, at present, there is no single ideal approach to super resolution co-localization studies. The techniques differ significantly in resolution and in practicality in their application to individual research problems. In addition, convenience, time, and cost must also be considered in making any decision. For many uses, SIM provides advantages over PALM/STORM or STED. SIM is practical using conventionally available dyes, while PALM/STORM relies on a subset of blinking dyes that work well individually and less so for two color co-localization studies. Robust dye choices will need to be added to the repertoire for PALM/STORM techniques to be a truly valuable technique for a general cell biology community. One can imagine a repertoire of dyes that all switch under the same buffer conditions, allowing for easily obtained multicolor readouts. Additionally, SIM systems are being optimized and further developed for the important biological applications of live cell and multicolor imaging. SIM also lends itself easily to multicolor 3D imaging, whereas PALM/STORM techniques are less adept at multicolor 3D. The primary benefit of PALM/STORM and STED strategies is the further improvement in resolution. This gain is typically available only for fixed samples. A trend within the industry appears to be the implementation of a SIM and a 3D PALM/STORM system in the same microscope stand. For many, that choice may give the best of both worlds.
For our own study of platelets, SIM has been very helpful in addressing questions of platelet α-granule structure and protein packaging [35] and we look forward to implementing this method for live cell imaging. In part, this is because platelet granules are relatively large cylinders, about 250 nm in diameter and 500 nm in length. We consider 3D-SIM to be an easily applicable and quickly implementable technique to augment our current studies using electron microscopy. Likely, the use of a combined SIM and PALM/STORM system will further increase the range of questions that we can answer with light microscopy techniques. We look forward in the future to applying a combined system to more general problems in membrane trafficking and problems in diabetes and hunger signaling.
Super resolution techniques are still on the “rugged edge” of development and are sure to improve greatly over the next decade. It is likely that the repertoire of photoactivatable and photoswitchable proteins, dyes, and probes will continue to grow. New molecular tagging strategies (reviewed in reference 27) are in progress, which will likely lead to new gains in resolution. Overall, super resolution techniques will obsolete previous fluorescence approaches, particularly as fluor choices improve, instrument implementations improve, and algorithms advance.
Acknowledgments
We greatly appreciate the willingness of Applied Precision, Inc., a division of GE, Vutara, and Carl Zeiss to test samples on their instruments and discuss the implementation of technique. Work in the Storrie laboratory was supported by NIH grants, R01GM092960 and R01HL119393. Work in the Baldini laboratory is supported by NIH grant, R01DK080424.
References
- 1.Abbe E. Beitrage zur Theorie des Mikroskops und der mikroskopischen Wahrmehmung. Arc F Mikr Anat. 1873;9:413–420. [Google Scholar]
- 2.Murphy DB, Davidson MW. Fundamentals of Light Microscopy and Electronic Imaging. 2. Hoboken, New Jersey: Wiley and Sons, Inc; 2013. p. 538. [Google Scholar]
- 3.McNally JG, et al. Three-dimensional imaging by deconvolution microscopy. Methods. 1999;19(3):373–85. doi: 10.1006/meth.1999.0873. [DOI] [PubMed] [Google Scholar]
- 4.Hell SW, Dyba M, Jakobs S. Concepts for nanoscale resolution in fluorescence microscopy. Curr Opin Neurobiol. 2004;14(5):599–609. doi: 10.1016/j.conb.2004.08.015. [DOI] [PubMed] [Google Scholar]
- 5.Cavanagh HD, Petroll WM, Jester JV. The application of confocal microscopy to the study of living systems. Neurosci Biobehav Rev. 1993;17(4):483–98. doi: 10.1016/s0149-7634(05)80127-7. [DOI] [PubMed] [Google Scholar]
- 6.Gustafsson MG. Surpassing the lateral resolution limit by a factor of two using structured illumination microscopy. J Microsc. 2000;198(Pt 2):82–7. doi: 10.1046/j.1365-2818.2000.00710.x. [DOI] [PubMed] [Google Scholar]
- 7.Betzig E, et al. Imaging intracellular fluorescent proteins at nanometer resolution. Science. 2006;313(5793):1642–5. doi: 10.1126/science.1127344. [DOI] [PubMed] [Google Scholar]
- 8.Rust MJ, Bates M, Zhuang X. Sub-diffraction-limit imaging by stochastic optical reconstruction microscopy (STORM) Nat Methods. 2006;3(10):793–5. doi: 10.1038/nmeth929. [DOI] [PMC free article] [PubMed] [Google Scholar]
- 9.Hell SW, Wichmann J. Breaking the diffraction resolution limit by stimulated emission: stimulated-emission-depletion fluorescence microscopy. Opt Lett. 1994;19(11):780–2. doi: 10.1364/ol.19.000780. [DOI] [PubMed] [Google Scholar]
- 10.Lukosz WaMM. Optischen Abbildung Unter Unberschreitung der Beugungsbedingten Auflosungsgrenze. Journal of Modern Optics. 1963;10(3):241–255. [Google Scholar]
- 11.Schermelleh L, et al. Subdiffraction multicolor imaging of the nuclear periphery with 3D structured illumination microscopy. Science. 2008;320(5881):1332–6. doi: 10.1126/science.1156947. [DOI] [PMC free article] [PubMed] [Google Scholar]
- 12.Kner P, et al. Super-resolution video microscopy of live cells by structured illumination. Nat Methods. 2009;6(5):339–42. doi: 10.1038/nmeth.1324. [DOI] [PMC free article] [PubMed] [Google Scholar]
- 13.Chung E, et al. Two-dimensional standing wave total internal reflection fluorescence microscopy: superresolution imaging of single molecular and biological specimens. Biophys J. 2007;93(5):1747–57. doi: 10.1529/biophysj.106.097907. [DOI] [PMC free article] [PubMed] [Google Scholar]
- 14.Shao L, et al. Super-resolution 3D microscopy of live whole cells using structured illumination. Nat Methods. 2011;8(12):1044–6. doi: 10.1038/nmeth.1734. [DOI] [PubMed] [Google Scholar]
- 15.Hofmann M, et al. Breaking the diffraction barrier in fluorescence microscopy at low light intensities by using reversibly photoswitchable proteins. Proc Natl Acad Sci U S A. 2005;102(49):17565–9. doi: 10.1073/pnas.0506010102. [DOI] [PMC free article] [PubMed] [Google Scholar]
- 16.Hess ST, Girirajan TP, Mason MD. Ultra-high resolution imaging by fluorescence photoactivation localization microscopy. Biophys J. 2006;91(11):4258–72. doi: 10.1529/biophysj.106.091116. [DOI] [PMC free article] [PubMed] [Google Scholar]
- 17.Heilemann M, et al. Super-resolution imaging with small organic fluorophores. Angew Chem Int Ed Engl. 2009;48(37):6903–8. doi: 10.1002/anie.200902073. [DOI] [PubMed] [Google Scholar]
- 18.Bates M, et al. Multicolor super-resolution imaging with photo-switchable fluorescent probes. Science. 2007;317(5845):1749–53. doi: 10.1126/science.1146598. [DOI] [PMC free article] [PubMed] [Google Scholar]
- 19.Murphy DB, Davidson MW. Fundamentals of Light Microscopy and Imaging. John Wiley & Sons, Inc; Hoboken, New Jersey: 2013. Superresolution Imaging. [Google Scholar]
- 20.Olivier N, et al. Simple buffers for 3D STORM microscopy. Biomed Opt Express. 2013;4(6):885–99. doi: 10.1364/BOE.4.000885. [DOI] [PMC free article] [PubMed] [Google Scholar]
- 21.Endesfelder U, et al. Chemically induced photoswitching of fluorescent probes--a general concept for super-resolution microscopy. Molecules. 2011;16(4):3106–18. doi: 10.3390/molecules16043106. [DOI] [PMC free article] [PubMed] [Google Scholar]
- 22.Vogelsang J, et al. A reducing and oxidizing system minimizes photobleaching and blinking of fluorescent dyes. Angew Chem Int Ed Engl. 2008;47(29):5465–9. doi: 10.1002/anie.200801518. [DOI] [PubMed] [Google Scholar]
- 23.Andresen M, et al. Photoswitchable fluorescent proteins enable monochromatic multilabel imaging and dual color fluorescence nanoscopy. Nat Biotechnol. 2008;26(9):1035–40. doi: 10.1038/nbt.1493. [DOI] [PubMed] [Google Scholar]
- 24.Subach FV, et al. Photoactivatable mCherry for high-resolution two-color fluorescence microscopy. Nat Methods. 2009;6(2):153–9. doi: 10.1038/nmeth.1298. [DOI] [PMC free article] [PubMed] [Google Scholar]
- 25.Patterson GH, Lippincott-Schwartz J. A photoactivatable GFP for selective photolabeling of proteins and cells. Science. 2002;297(5588):1873–7. doi: 10.1126/science.1074952. [DOI] [PubMed] [Google Scholar]
- 26.Chudakov DM, et al. Photoswitchable cyan fluorescent protein for protein tracking. Nat Biotechnol. 2004;22(11):1435–9. doi: 10.1038/nbt1025. [DOI] [PubMed] [Google Scholar]
- 27.Fernandez-Suarez M, Ting AY. Fluorescent probes for super-resolution imaging in living cells. Nat Rev Mol Cell Biol. 2008;9(12):929–43. doi: 10.1038/nrm2531. [DOI] [PubMed] [Google Scholar]
- 28.Heilemann M, et al. Subdiffraction-resolution fluorescence imaging with conventional fluorescent probes. Angew Chem Int Ed Engl. 2008;47(33):6172–6. doi: 10.1002/anie.200802376. [DOI] [PubMed] [Google Scholar]
- 29.van de Linde S, et al. Direct stochastic optical reconstruction microscopy with standard fluorescent probes. Nat Protoc. 2011;6(7):991–1009. doi: 10.1038/nprot.2011.336. [DOI] [PubMed] [Google Scholar]
- 30.Dempsey GT, et al. Evaluation of fluorophores for optimal performance in localization-based super-resolution imaging. Nat Methods. 2011;8(12):1027–36. doi: 10.1038/nmeth.1768. [DOI] [PMC free article] [PubMed] [Google Scholar]
- 31.van de Linde S, et al. Multicolor photoswitching microscopy for subdiffraction-resolution fluorescence imaging. Photochem Photobiol Sci. 2009;8(4):465–9. doi: 10.1039/b822533h. [DOI] [PubMed] [Google Scholar]
- 32.Huang B, et al. Whole-cell 3D STORM reveals interactions between cellular structures with nanometer-scale resolution. Nat Methods. 2008;5(12):1047–52. doi: 10.1038/nmeth.1274. [DOI] [PMC free article] [PubMed] [Google Scholar]
- 33.Westphal V, et al. Video-rate far-field optical nanoscopy dissects synaptic vesicle movement. Science. 2008;320(5873):246–9. doi: 10.1126/science.1154228. [DOI] [PubMed] [Google Scholar]
- 34.Shroff H, et al. Live-cell photoactivated localization microscopy of nanoscale adhesion dynamics. Nat Methods. 2008;5(5):417–23. doi: 10.1038/nmeth.1202. [DOI] [PMC free article] [PubMed] [Google Scholar]
- 35.Kamykowski J, et al. Quantitative immunofluorescence mapping reveals little functional coclustering of proteins within platelet alpha-granules. Blood. 2011;118(5):1370–3. doi: 10.1182/blood-2011-01-330910. [DOI] [PubMed] [Google Scholar]