

Abstract
Theta sequences are circuit-level activity patterns produced when groups of hippocampal place cells fire in sequences that reflect a compressed behavioral order of place fields within each theta cycle. The high temporal coordination between place cells exhibited in theta sequences is compatible with the induction of synaptic plasticity and has been proposed as one of the mechanisms underlying the encoding of episodic memory of recently acquired experience. Yet how theta sequences develop with experience has not been directly addressed. Here we simultaneously recorded large numbers of cells in the dorsal hippocampal CA1 area from rats exploring on a novel linear track. Although place cell firing activities accurately represented the animal's current location, distinct theta sequences were absent on the first lap but emerged immediately thereafter and remained stable once established. The absence of theta sequences on the first lap was not due to place field instability, decreased overall excitability of place cells, behavior variables, or the absence of individual neuronal phase precession. We observed strong single-lap phase precession in a significant percentage of place fields on the first lap and throughout the recording. Individual neuronal phase precession was stable from the first lap to subsequent laps but, across neurons, phase precession became more synchronized after experience, suggesting a novel mechanism for the generation of theta sequences. These results suggest that experience-independent temporal coding in individual neurons is combined with rapid plasticity of hippocampal neural networks during experience to acquire predictive representations of the immediate future.
Keywords: hippocampus, phase precession, place cell, sequences
Introduction
The hippocampus is important for navigational learning (O'Keefe and Nadel, 1979; Morris et al., 1982) and episodic memory (Scoville and Milner, 1957; Olton and Samuelson, 1976; Gaffan, 1994; Steele and Morris, 1999), both of which require temporal encoding of relationships between events and/or locations. Temporal coordination between hippocampal neurons during theta oscillations, namely, theta sequences (Skaggs et al., 1996; Dragoi and Buzsáki, 2006; Foster and Wilson, 2007; Gupta et al., 2012), is thought to underlie this function via spike timing-dependent plasticity (Hebb et al., 1994; Jensen and Lisman, 1996; Skaggs et al., 1996). The “sweeping forward” structure of theta sequences also enables the retrieval of information about locations immediately ahead of the animal, which can be useful in guiding future behavior (Johnson and Redish, 2007; Gupta et al., 2012). However, little is known regarding the mechanisms underlying the development of hippocampal theta sequences with individual experiences, likely due to technical difficulties associated with simultaneously recording large cell ensembles. Because theta sequences generally recruit place cells only when the animal occupies their place fields, they are shorter and harder to detect than, for example, offline replay sequences that recruit cells with fields dispersed widely throughout the environment (Lee and Wilson, 2002; Pfeiffer and Foster, 2013). Here we address this technical difficulty by implanting micro-drives containing 40 adjustable tetrodes targeted to the hippocampus, yielding up to hundreds of simultaneously recorded place cells.
Theta sequences were originally predicted as a consequence of phase precession (O'Keefe and Recce, 1993; Skaggs et al., 1996), in which spikes fired by an individual place cell occur at progressively earlier theta phases during place field traversal. However, variability in place field sizes, instantaneous firing rates, phase precession offsets, phase precession slopes, and other properties between different cells complicate the relationship between phase precession and theta sequences (Dragoi and Buzsáki, 2006; Foster and Wilson, 2007; Schmidt et al., 2009). Theoretical models and experimental results also differ in how they view the dependence of phase precession and/or theta sequences on experience, with some regarding phase precession as intrinsic to individual place cells and independent of experience (O'Keefe and Recce, 1993; Rosenzweig et al., 2000; Harvey et al., 2009), whereas others regard phase precession as merely an experimental corollary of theta sequences, which may themselves exist before experience (Itskov et al., 2011) or result from it (Samsonovich and McNaughton, 1997; Tsodyks, 1999; Mehta et al., 2002). Nevertheless, despite different accounts, the common assumption in most previous work is that ensemble-level theta sequences and single neuronal phase precession are manifestations of the same underlying phenomenon.
In this study, we recorded up to hundreds of hippocampal place cells simultaneously in freely behaving rats, to examine directly theta sequence structure and single-trial phase precession during successive traversals along a novel track. We observed that theta sequence structure was absent on the first experience of a novel environment but emerged immediately thereafter, whereas the phase precession of individual hippocampal place cells was present from the first traversal and appeared to be an experience-independent phenomenon.
Materials and Methods
Subjects and experiment protocol.
All procedures were approved by the Johns Hopkins University Animal Care and Use Committee and followed National Institutes of Health animal use guidelines. Four adult male Long–Evans rats (4–6 months old) were food deprived and pretrained to repeatedly traverse a linear track to obtain liquid reward at both ends in a room different from the recording room before implantation. Seven recording sessions of animals running on novel linear tracks that have never been experienced before were included in this study (track length, 165 cm; minimum of 14 laps per session). Of the seven recording sessions, two animals contributed more than one session by being introduced to other physically distinct novel linear tracks on different recording days. We also rearrange the distal cues in the recording room between different recording days.
Surgery and data acquisition.
A microdrive array containing 40 independently adjustable, gold-plated tetrodes aimed at area CA1 of dorsal hippocampus (20 tetrodes per hemisphere; 4.00 mm posterior and 2.85 mm lateral to bregma) was implanted in animals after pretraining. Final tetrode placement, unit recording, and local field potential (LFP) recording were as previously described (Foster and Wilson, 2006; Pfeiffer and Foster, 2013). All data were collected using a Digital Lynx data acquisition system (Neuralynx). The animal's position was tracked via independently colored LEDs mounted on the microdrive array. Individual units were identified by manual clustering based on spike waveform peak amplitudes using custom software (xclust2, Matt A. Wilson). Only well-isolated units were included in the analysis. Clustered units identified as putative inhibitory neurons on the basis of spike width were excluded from further analysis.
Position reconstruction from neural activities.
Position was linearized and binned into 2.5 cm bins. Directional place fields were calculated as the smoothed histogram of firing activity normalized by the time spent per bin. Single-lap directional place fields were calculated using spikes only from the current lap and the current running direction (each lap is composed of two traverses along the track in opposite directions). Place cells with peak firing rates <1 Hz along the track were excluded. A memoryless probability-based decoding algorithm was used to estimate the animal's position based on the directional place fields and the spike trains (Davidson et al., 2009; Pfeiffer and Foster, 2013). Briefly, the posterior probability of the animal's position (pos) across M total position bins given a time window (τ) containing neural spiking (spikes) is as follows:
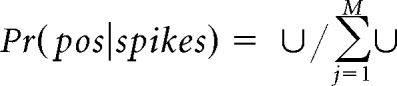 |
where
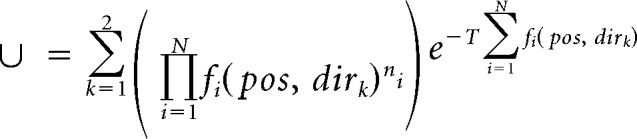 |
and fi (pos, dirk) is the place field of one running direction of the i-th unit, assuming independent rates and Poisson firing statistics for all N units and a uniform prior over position. A time window of 20 ms, moving with 5 ms steps, was used to examine theta sequence structure in a fine timescale. Decoded errors were calculated as the differences between the animal's current running position and the peak decoded position in each time window (see Fig. 1b, middle).
Figure 1.

Individual theta sequences and single-lap phase precession. a, Left, Concurrent LFP (top panel, raw LFP in gray, 4–12 Hz bandpass filtered theta rhythm in black), spikes from 107 CA1 pyramidal cells ordered by place cells' peak firing positions along the track (middle, black bars; magenta and green represent the spikes from the cells in right panel), and theta sequences constructed from raw spikes (bottom, probability estimates were color scaled) during 1.55 s of the animal's running. Overlay white line indicates the speed of each theta sequence. The running trajectory of the animal was indicated as overlay blue (middle) or black line (bottom). The beginning and end of theta sequences were indicated as white (bottom) or red bars (other panels). Right, Examples of single-lap phase precession. Top, Two overlapping place fields. Bottom, Phase-position relationship of emitted spikes during the running lap shown in the left panel. b, Spike density of neuronal population (top), decoded errors (middle), and theta sequences (bottom) were theta modulated. c, Histogram of theta sequence strength measured by probability differences (first panel), weighted correlation (second panel), slope (third panel), and spike train correlation (fourth panel). d, Histogram of phase-position correlation (first panel), slope (second panel), phase offset (third panel), and phase range (fourth panel) of single-lap phase precession.
Analysis of LFP.
LFP from the tetrode with either highest theta signal-to-noise ratio or largest number of simultaneously recorded pyramidal cells was filtered through 4–12 Hz bandpass filter. Global phase zero was defined as the theta phase (r) corresponding to maximal pyramidal cell activities (Skaggs et al., 1996). The theta phase of an emitted spike (∅) at time t was determined by linear interpolation of spike timing between the preceding theta trough at time t0 and the following theta trough at time t1, and referenced to global phase zero as the following:
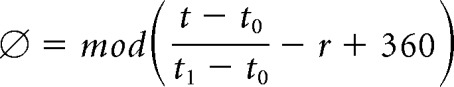 |
where mod indicates the remainder when divided by 360 because the phase is always a number between 0 and 359. The instantaneous theta frequency was determined as the reciprocal of duration of each theta cycle. To normalize across tetrodes with different impedances, z-scored theta peak amplitudes were calculated for each individual recording session when pooling data together.
Quantification methods for theta sequences.
Theta sequences were quantified only when the animal was in the middle of the track (one-sixth to five-sixths of the track length), running faster than 10 cm/s, and when the durations of the corresponding theta cycles ranged from 100 to 200 ms. To construct the averaged theta sequence on each lap (see Figs. 2a, 3c, 5a,c, and Fig. 7a), decoded probabilities over position during each theta cycle were aligned to the animal's current running position and direction before averaging. The mid-time point of theta sequences was defined as the theta phase where the center of the averaged theta sequence lies.
Figure 2.

Theta sequence structure emerged immediately after the first experience on the novel track using whole session decoding. a, Averaged decoded probabilities over 125 cm centered by the animal's current running position, aligned by the animal's current running direction during 325 ms centered by the mid-time point of theta sequence for each lap. Color scale is the same as in Figure 1a. b, Theta sequence strength changed significantly between the first lap and the following laps. First panel, Probability of (II + IV − I − III)/(I + II + III + IV) Quadrant in a 100 cm and ½ theta cycle window centered by the animal's current running position and the mid-time point of theta sequence on different laps. Second panel, Weighted correlations between time and decoded positions across laps. Third panel, Theta sequence slopes across laps. Fourth panel, Spike train correlations across laps. *Lap that was included in all significant pairs of laps at the 0.05 level.
Figure 3.

Single-lap decoding was more accurate than whole session decoding and preserved the rapid development of theta sequences. a, Examples of 300 ms spike train (black bars) and decoding using whole session decoding and single-lap decoding in lap 1 and lap 14. The spikes were ordered, respectively, by cells' peak firing position in whole session place field or single-lap place field. Blue line in spike train and black line in decoding indicate the animal's current running location. The beginning and end of theta sequences were indicated as white (in decoding) or red bars (in spike train). Magenta and green bars represent spikes from two cells. Color scale is the same as in Figure 1a. b, Averaged decoded probabilities (decoded window of 20 ms moving with 5 ms step) on the animal's current running locations between different laps. Black represents whole session decoding. Blue represents single-lap decoding. Green represents firing rate controlled data. c, d, Same as in Figure 2 using single-lap decoding. * and color scale as in Figure 2.
Figure 5.

Control of place cell firing rate and the animal's running speed for the development of theta sequences. a, b, Same as in Figure 2, firing rate control. c, d, Same as in Figure 2, data controlling for the animal's running speed. * and color scale as in Figure 2.
Figure 7.

The phase offset of phase precession became more synchronized among individual neurons after the first experience on novel track. a, b, Reconstructed theta sequences using the subset of place cells that possessed strong first-lap phase precession preserved the rapid development of theta sequences. Plots are the same as in Figures 2, 3, and 5. * c, Phase offset distribution of 139 place fields in lap 1 (first row, left), lap 2 (first row, middle), lap 6 (first row, right), lap 10 (second row, left), and lap 14 (second row, middle). Gray represents angles. Black represents scales of histogram. Red represents resultant vectors. Right (second row), Resultant vector length of phase offset of 139 stable place fields between different laps (red); firing rate control (green); place fields with strong phase precession (black). d, Left, Resultant vector length of phase offset of 531 place field pairs within recording sites (blue) and 2870 place field pairs between recording sites (black). Middle, Theta phase deviation from 89 recording sites (black) and the resultant vector length of the phase deviations (red) across laps. Right, Spike modulation depth of cells with stable place fields by theta oscillation. * and color scale as in Figure 2.
Method I: probability differences.
Decoded probabilities ±50 cm around the animal's location, and ±¼ theta cycle around the mid-time point of the theta sequence, were divided equally into four quadrants. The region both physically and temporally behind the animal is represented as Quadrant II, whereas Quadrant IV represents the region physically and temporally ahead of the animal (see Figs. 2a, 3c, 5a,c, and Fig. 7a, inset of the subplot for lap 14). The summed decoded probabilities opposite with the animal's current running direction (Quadrants I and III) were subtracted from the summed decoded probabilities along the animal's current running direction (Quadrants II and IV) and then normalized by the summed decoded probabilities in all four quadrants. Positive differences would imply theta sequences sweeping in the running direction of the animal, whereas differences close to zero would indicate a lack of sequential structure in the decoded probabilities.
Method II: weighted correlation.
Decoded probabilities (prob) were assigned as weights of position estimates to calculate the correlation coefficient between time (T) and decoded position (P) as follows:
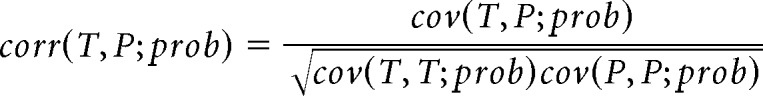 |
where weighted covariance between time and decoded position is as follows:
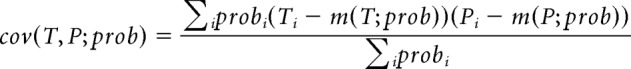 |
and weighted means of time and decoded position are as follows:
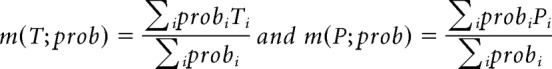 |
Weighted correlation of each reconstructed theta sequence was calculated from the decoded probabilities of positions 50 cm behind and ahead of the animal's current location, in a time window of ¼ theta cycle before and after the mid-time point of each theta sequence. A distinct sequential structure sweeping along the animal's running direction would yield a large positive correlation, whereas a lack of sequential structure would produce a correlation close to zero.
Method III: theta sequence slope.
The slope of each theta sequence was determined by the slope of a fitted line that yielded the maximum decoded probability in a 20 cm vicinity and within half a theta cycle centered by the mid-time point. To fit a line that best describes the series of position estimates during each theta cycle, we used a method similar to line finding in a 2-dimensional image, using a modified discrete approximation to the Radon transform (Toft, 1996; Davidson et al., 2009). The likelihood (R) that the decoded theta sequence (duration of n time bins) is along the fitted line with slope (V), and starting location (ρ) was calculated as the averaged decoded probability in a 20 cm vicinity along the fitted line as follows:
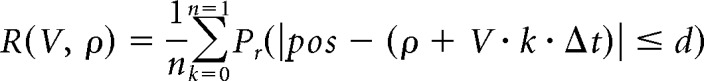 |
Where Δt is the moving step of the decoding time window (5 ms), and the value of d was empirically set to 10 cm to fit theta sequences with small local variations in slope (for those time bins k when the fitted line would specify a location beyond the end of the track, the median probability of all possible locations is taken as the likelihood). To determine the most likely slope for each decoded theta sequence, we densely sampled the parameter space of V and ρ to find the values that maximize R. A larger slope would indicate a faster propagation speed of the sequence across participating neurons.
Method IV: spike train correlation.
For each theta sequence, Pearson's linear correlation coefficient between spike timing and place cell peak firing positions was calculated for spikes emitted during 45–315 degrees of individual theta cycle (referenced to global phase zero) and for cells whose peak firing positions were within 50 cm behind or in front of the animal's current position.
To produce error bars in Figure 4b, theta sequences on each lap were divided into five groups by the corresponding z-scored theta peak amplitudes, instantaneous theta frequencies, overall firing rate, or the animal's running speeds. Analysis controlling overall firing rate on each lap was conducted by randomly sampling spikes from each lap (Figs. 3b, 5a,b, 6b,c, and Fig. 7c). Analysis controlling the animal's running speed on each lap was conducted by matching theta sequences with the same animal's running speed in between laps (see Fig. 5c,d).
Figure 4.

The variability of theta peak amplitude, theta instantaneous frequency, overall firing rate, and the animal's running speed between laps was not sufficient to account for the emergence of theta sequence structure after the first lap. a, Lap-by-lap changes of z-scored theta peak amplitude (first panel), instantaneous theta frequency (second panel), place cell overall firing rates (third panel), and the animal's running speed (fourth panel). b, Relationship between the above variables (four columns) and theta sequence strength under four different quantification methods (rows). Gray represents lap 1. Red represents lap 2. Green represents lap 8. Blue represents lap 14. Black represents laps 2–14. Shaded area and error bar indicate SEM. Text represents correlation value. *p < 0.05. **p < 0.001.
Figure 6.

Individual place field demonstrated strong phase precession on the first experience on a novel track. a, Phase precession from four different place cells. Each spike has been plotted out twice on the corresponding theta phase and the phase plus 360 degrees for visualization purpose. Top, Spikes from the whole session. Bottom, Spikes during the first lap; only spikes within the boundary of whole session place field or single-lap place field are shown. Red solid line indicates firing rate >1 Hz. Red dashed line indicates firing rate <1 Hz. Blue line indicates fitted line of phases with positions. Text on the upper right corner indicates the fitted slope. b, Top, Distribution of number of strong phase precessions (r < −0.5) from 5000 shuffles of 139 stable place fields. The 59 place fields on the first lap demonstrated strong phase precession (red line). Bottom, Pearson's linear correlations between animal's running positions and shifted theta phases of emitted spikes across laps. Black represents original data. Gray represents firing rate control. c, Phase precession slope (first panel), phase offset (second panel), phase range (third panel), in-field mean (red), and peak (pink) firing rate (fourth panel) of 139 stable place fields across laps. d, Place field center of mass shift (first panel), ratio of size change (second panel), skewness (third panel), and FRAI (fourth panel) across laps in reference to the whole session place field.
Quantifications of individual neuronal phase precessions.
Single-lap/trial phase precessions were examined in place fields that possessed peak firing rates no less than 5 Hz, peak firing positions in the middle of the track (one-fifth to four-fifths of the track length), field size (defined by 1 Hz firing rate boundary) more than two position bins and not including the end of the track. The definitions of center of mass, skewness, and FRAI (see Fig. 6d) were as previously described (Mehta et al., 2000). For group analysis, only stable place fields from cells emitting at least three spikes at no less than two different location bins on each lap were included. The phase-position correlation of spikes emitted by a place cell during a single traverse of its place field by the animal was determined by finding the optimal phase shift (P, referred as phase offset) that minimizes the negative Pearson's linear correlation (corr) between animal's positions (pos) and shifted spike phases (∅ + P) as follows:
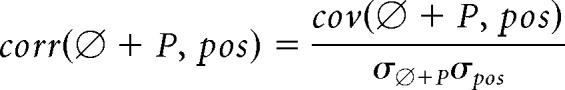 |
where ∅ is the original spike phase, cov is the covariance, and σ is the SD. Phase precession slope was calculated by least-square fit of spike locations of the animal and shifted spike phases. Phase range was defined as the phase difference between the spike with the highest shifted phase and the spike with the lowest shifted phase, rather than as the multiplication of phase precession slope and the size of the single-lap place field as previously has been defined (Schmidt et al., 2009). The latter method relies on the goodness of fit of the linear regression and, thus, can be imprecise or underestimate the real phase range when the spike phase and location are weakly or nonlinearly correlated (e.g., bimodality of phase precession; Fig. 6a, Cell 55 in Session 7) (Yamaguchi et al., 2002). The phase range of single-lap phase precession calculated through the latter method was indeed smaller (185 ± 1.64 degrees, mean ± SEM) than through our method (see Results) and was close to half a theta cycle as Schmidt et al. (2009) previously reported. However, our phase range calculation is independent of the strength of phase precession and thus was used throughout the study, although the method in Schmidt et al. (2009) did not change our main results. Polar plots of phase offset distributions were generated with π/6 bin size. The shuffled data were produced by independently replacing the phase of each emitted spike by a random phase for 5000 times (Fig. 6b, top). The resultant vector length in Figure 7c was calculated as the magnitude of the resultant vector of single-lap phase offsets from all the stable place fields that included in the group analysis. We also quantified the resultant vector length of phase offset of all the pairs of place fields that were recorded on the same recording tetrode, or between different tetrodes (Fig. 7d, left). Theta phase deviation was defined as the phase difference between global phase zero and the trough of theta oscillation of individual LFP. The calculation of spike modulation depth was as previously described (Carr et al., 2012). Circular statistics were performed using CircStat MATLAB Toolbox (Berens, 2009).
Results
In all of the seven recording sessions, we simultaneously recorded large numbers of hippocampal place cells that were active when animals ran laps on novel linear tracks (78 ± 6.5 active place cells per session; mean ± SEM). Both recorded LFP and neuronal spiking activities demonstrated strong theta modulation during exploration (Fig. 1a,b). Individual place cells emitted spikes in advancing theta phases as the animal ran across their place fields (single-lap phase precession: Fig. 1a, magenta and green). Ordering place cells by their peak firing positions along the track revealed repetitive sequential spiking activities across the population of neurons that were phase-locked to each theta cycle (theta sequences: Fig. 1a, middle). Decoded probabilities of the animal's position estimated from pyramidal cell activities (Davidson et al., 2009) revealed more distinct sequential structures of theta sequences (Fig. 1a, bottom), which start and end on the descending phase of theta-modulated spike density oscillation (on average 80 degrees in reference to spike density peak; Fig. 1b). Decoded errors were also modulated by theta oscillations, with minimum error near the center of theta sequences (Fig. 1b, middle).
Individual theta sequences and single-lap phase precession
To compare theta sequence strength on each lap accurately, we used four distinct methods, based on decoded probabilities or spike trains to quantify individual theta sequences during 5513 theta cycles. Consistent with previous reports (Dragoi and Buzsáki, 2006; Foster and Wilson, 2007; Davidson et al., 2009), the majority of theta sequences demonstrated stronger decoded probabilities along the animal's current running direction than the opposite direction (normalized probability differences: 0.22 ± 0.00, median ± SEM; Fig. 1c, first panel), positive weighted correlations between decoded position and time (0.26 ± 0.00; median ± SEM; Fig. 1c, second panel), positive slopes (2.50 ± 0.06, median ± SEM; Fig. 1c, third panel), and positive correlations between spike timing and place cell peak firing positions (0.21 ± 0.01; median ± SEM; Fig. 1c, fourth panel), all with p < 10−10 from Wilcoxon signed rank test .
We also quantified single-lap phase precessions in place cells that had stable place fields throughout the recording session. Consistent with previous reports (Schmidt et al., 2009), the majority of 1946 single-lap phase precessions demonstrated negative correlations between spike location and spike phase (−0.52 ± 0.00; mean ± SEM; Fig. 1d, first panel), negative slopes (−19.22 ± 0.67; mean ± SEM; Fig. 1d, second panel), phase offsets around 259 degrees (mean; 1.44, SEM; Fig. 1d, third panel), and phase ranges around 330 degrees (median; 0.99, SEM; Fig. 1d, fourth panel; see Materials and Methods). Given our ability to measure both theta sequences and theta phase precession, we next asked whether either or both varied as a function of experience on a lap-by-lap basis after exposure to a novel environment.
Theta sequence structure emerged rapidly after experience on a novel track
To examine the development of theta sequences, we centered the decoded position estimates by the animal's current running location and the mid-time point of theta sequence at each theta cycle and averaged the resulting sequences. We observed no clear sequential structure when the animal was running on the first lap across the novel track (Fig. 2a, first subplot, average of decoding during 440 theta cycles). However, by the second lap on the track, distinct theta sequences emerged in the decoded positions. These sequences swept forward along the animal's running direction and persisted across subsequent laps once established (Fig. 2a, second to 14th subplot).
All four quantification methods for theta sequences demonstrated significant positive correlations between theta sequence strength and the number of running experiences (Fig. 2b; Pearson's linear correlation coefficient r = 0.13, p < 10−10, probability differences, first panel; r = 0.11, p < 10−10, weighted correlation, second panel; r = 0.07, p = 2.02 × 10⁻⁷, slope, third panel; r = 0.06, p = 3.83 × 10⁻⁵, spike train correlation, fourth panel). Theta sequence strength increased dramatically between the first lap and following laps, resembling a negative acceleration curve. There was a significant difference in theta sequence strength between running laps (Fig. 2b; Kruskal–Wallis test: H(13) = 236.08, p < 10−10, probability differences, first panel; H(13) = 215.77, p < 10−10, weighted correlation, second panel; H(13) = 52.61, p = 1.06 × 10⁻⁶, slope, third panel; H(13) = 54.4, p = 5.16 × 10⁻⁷, spike train correlation, fourth panel), and the significance of the effect was mainly due to a near-zero theta sequence strength on the first lap indicated by post hoc multiple comparison with Scheffé correction (the first lap was included in all pairs of laps that were significantly different under all four quantification methods, with a single exception of probability difference between lap 2 and lap 8). We further verified the absence of clear sequential structure on the first lap in individual recording sessions, and the rapid development of theta sequences was universal across all the animals and recording sessions (Kruskal–Wallis test of probability differences measurement: p = 1.62 × 10⁻⁸, session 1; p = 2.59 × 10⁻⁷, session 2; p = 7.68 × 10⁻⁴, session 3; p = 2.10 × 10⁻⁶, session 4; p = 2.59 × 10⁻⁹, session 5; p < 10−10, session 6; p = 9.61 × 10⁻⁵, session 7). Post hoc multiple comparison with Scheffé correction indicated that, in all individual sessions, the first lap was included in all pairs of laps that were significantly different. Our results suggest that the formation of theta sequences can be rapidly achieved by single-trial experience.
The rapid development of theta sequences was not due to place field instability
Previous literature has reported that the ensemble code of hippocampal neural firing upon entering a novel environment is initially less robust and takes minutes to stabilize (Wilson and McNaughton, 1993), which raises a problem for the decoding algorithm we have used because the lack of sequential structure in the decoded probabilities during the first lap could simply result from the utilization of an inaccurate ensemble code based on spikes from the whole recording session (“whole session decoding”). We therefore implemented a second decoding algorithm using place fields calculated only from spikes that occurred during the lap being decoded (“single-lap decoding”) to obtain a more faithful representation of theta sequences on each lap.
We tested the accuracy of single-lap decoding on the short sequence-decoding timescale (20 ms), which is different from the behavioral timescale (approximately seconds) over which place fields were generated, so that accuracy was not a trivial consequence of data overfitting. Indeed, single-lap decoding largely increased the accuracy of position estimation, especially on the first lap (Fig. 3a,b). When comparing the decoded probabilities for the animal's current position, single-lap decoding (Fig. 3b, blue) yielded a significantly higher probability (p < 10−10, Wilcoxon rank sum test) than whole session decoding (Fig. 3b, black), and largely decreased the variability of decoded probabilities between laps (sum of squares of between-laps variability: 7.85 × 10¹¹ vs 3.42 × 10¹², single-lap vs whole session decoding). This variability can be further decreased by controlling overall firing rate between different laps (Fig. 3b, green; sum of squares of between-laps variability: 5.05 × 10¹¹).
The rapid development of theta sequences after the first lap was preserved when reconstructing theta sequences using single-lap decoding (Fig. 3c). More importantly, the decoded probabilities concentrated at the animal's current location on the first lap, suggesting a complete lack of sequential structure that was not due to an inaccurate representation of space from place cell activities. When quantifying the strength of theta sequences under single-lap decoding, all three methods based on decoding demonstrated a negative acceleration curve of theta sequence strength with the number of running laps, with near-zero theta sequence strength only on the first lap (Fig. 3d, first to third panels). Spike train correlation between spike timing and place cell peak firing positions defined by single-lap place fields increased dramatically after the second lap (Fig. 3d, fourth panel). There were statistically significant differences of theta sequence strength between different laps under all four methods (Kruskal–Wallis test: H(13) = 169.93, p < 10−10 for probability differences, Fig. 3d, first panel; H(13) = 160.39, p < 10−10 for weighted correlation, Fig. 3d, second panel; H(13) = 75.95, p < 10−10 for theta sequence slope, Fig. 3d, third panel; H(13) = 84.51, p < 10−10 for spike train correlation, Fig. 3d, fourth panel). Post hoc multiple comparisons with Scheffé correction indicated the first lap as the source of significant difference under the first three measurements of theta sequence strength, whereas the spike train correlation of both the first and second lap were significantly different with some of the later laps. The utilization of single-lap decoding suggested that the rapid development of theta sequences was not due to place field instability (Wilson and McNaughton, 1993); further, because this decoding algorithm is based on single-lap unidirectional place fields that were calculated using spikes only from the current lap and the current running direction (see Materials and Methods), the decoded results should be unaffected by progressive changes in place field directionality (Frank et al., 2004). Also, when the data were divided by animals' running directions, clear sequential structure was absent on the first lap in both directions (probability differences measurement of theta sequence strength for one running direction: 0.04 ± 0.01 vs 0.15 ± 0.00, mean ± SEM of the first lap versus all the following laps combined; for the other running direction: 0.06 ± 0.02 vs 0.20 ± 0.00). Because single-lap decoding was more accurate and less variable than whole session decoding, we continued to use single-lap decoding in all the following analyses.
The rapid development of theta sequences was not due to other novelty-based changes in intrinsic hippocampal function or in behavior
Being exposed to a novel environment not only alters place field stability but also several other aspects of hippocampal function and behavior. Changes include decreases in theta frequency (Jeewajee et al., 2008), increases in theta power (Penley et al., 2013), a suppression of interneuron activities (Wilson and McNaughton, 1993; Frank et al., 2004; Nitz and McNaughton, 2004), an elevation of pyramidal cell activities (Nitz and McNaughton, 2004), and a decrease in exploration speed (Mehta et al., 2002; Frank et al., 2004; Jeewajee et al., 2008; Penley et al., 2013). Further, these changes covary, so that part of the variability in theta rhythm and neuronal activities can be explained by variation in exploration speed (Vanderwolf, 1969; Whishaw and Vanderwolf, 1973; McNaughton et al., 1983; Sławińska and Kasicki, 1998). In our recordings, the running speed of the animals increased in later laps as expected (Pearson's linear correlation coefficient r = 0.07, p = 1.40 × 10⁻⁷; Fig. 4a, fourth panel), co-occurring with an increased place cell overall firing rate (Pearson's linear correlation coefficient r = 0.04, p = 9.57 × 10⁻⁴; Fig. 4a, third panel), an increased instantaneous theta frequency (Pearson's linear correlation coefficient r = 0.09, p < 10−10; Fig. 4a, second panel), and a decreased normalized theta peak amplitude (Pearson's linear correlation coefficient r = −0.07, p = 2.94 × 10⁻⁸; Fig. 4a, first panel). To examine whether the observed decrease in theta sequence strength on the first lap can be explained by novelty-based changes in intrinsic hippocampal function or the animal's speed of locomotion (Maurer et al., 2012), we correlated theta sequence strength with peak theta amplitude (Fig. 4b, first column), instantaneous theta frequency (Fig. 4b, second column), place cell firing rate (Fig. 4b, third column), or animal's running speed (Fig. 4b, fourth column). Under all four quantification methods, theta sequence strength in the laps after the first (Fig. 4b, black line) correlated significantly with theta peak amplitude, theta frequency (with the exception of two methods), place cell firing rate (with the exception of one method), and the animal's running speed; yet no significant correlation was detected between theta sequence strength on the first lap with any of the variables (Fig. 4b, gray line). Further, the specific theta amplitudes, theta frequencies, place cell firing rates, and exploration speeds associated with the strongest theta sequences during later laps were associated with little indication of theta sequence structure during the first lap. We also randomly subsampled the spikes on each lap to control for the variability of overall firing rates between laps (Fig. 5a,b). Firing rate controlled results preserved the observation of theta sequence development, indicating that the novelty-based change in overall firing rate was not sufficient to account for the progressive change observed in theta sequence structure. We further verified the results by subsampling theta cycles on subsequent laps to match the same speed profile as on the first lap (Fig. 5c,d). The above data suggest that the rapid emergence of theta sequence structure after the first lap cannot be explained by lap-by-lap variability of neural activities, such as theta rhythm, firing rate, and the animal's running speed.
Individual place fields demonstrated strong phase precession on the first experience on a novel track
Several models of theta sequences propose that the sequential firing patterns emerge as a natural consequence of phase precession within individual place cells (Skaggs et al., 1996); thus, we asked whether phase precession was also absent on the first lap of a novel track. In contrast to previous studies (O'Keefe and Recce, 1993; Skaggs et al., 1996; Huxter et al., 2003; Dragoi and Buzsáki, 2006), where phase precession was quantified using spikes pooled across multiple traversals (Fig. 6a, top), we examined phase precession on a lap-by-lap basis, to provide a better representation of temporally structured events (Schmidt et al., 2009). Individual place fields, despite a wide variability in single-lap firing rates and place field sizes, demonstrated strong phase precession during the first lap on the novel track (Fig. 6a, bottom). The speed of the phase advancement varied between place cells (Fig. 6a, blue line/text) and was dependent on both the phase range of the spikes and the size of place fields (Huxter et al., 2003). Of 139 stable place fields, 59 showed strong phase precession with phase-position correlation <−0.5 on the first lap, which was significantly greater than predicted by chance (Monte-Carlo p < 2.00 × 10⁻⁴; see Materials and Methods; Fig. 6b, top). The phase-position correlation remained strong for the following laps (mean r = −0.48) and, strikingly, was constant between lap 1 and subsequent laps (Kruskal–Wallis test: H(13) = 16.48, p = 0.22; Fig. 6b, bottom, black). Thus, phase precession appeared to be a preexisting property of hippocampal place cells. Examining further the properties of single-lap phase precession, no significant difference between laps was observed in its slope (Kruskal–Wallis test: H(13) = 9.18, p = 0.76; Fig. 6c, first panel, black) or phase range (circular Kruskal–Wallis test, p = 0.48; Fig. 6c, third panel, black), although there may have been a trend in phase offset (circular Kruskal–Wallis test, p = 9.36 × 10⁻²; Fig. 6c, second panel, black). Similar to place cell overall firing rate (Fig. 4a, third panel), the in-field firing rate for the group of 139 stable place fields also increased with running experiences (Pearson's linear correlation coefficient between mean in-field firing rate and running laps: r = 0.09, p = 6.09 × 10⁻⁵; between peak in-field firing rate and running laps: r = 0.10, p = 5.46 × 10⁻⁶; Fig. 6c, fourth panel); we therefore implemented the same firing rate control as in theta sequence quantifications for phase precession (see Materials and Methods). Firing rate controlled results revealed no significant difference across laps for phase-position correlation (Kruskal–Wallis test: H(13) = 22.24, p = 5.18 × 10⁻²; Fig. 6b, bottom panel, gray), phase precession slope (Kruskal–Wallis test: H(13) = 7.79, p = 0.86; Fig. 6c, first panel, gray), or phase range (circular Kruskal–Wallis test, p = 6.93 × 10⁻²; Fig. 6c, third panel, gray). However, under firing rate control, a significant difference across laps was observed in phase offset (circular Kruskal–Wallis test, p = 3.46 × 10⁻²; Fig. 6c, second panel, gray), which will be further examined in the next section. Together, these data indicate that the observed absence of theta sequences on the first lap of a novel track cannot be explained by a similar lack of phase precession within individual neurons, suggesting instead a circuit-level explanation.
A previous study has reported that single-lap phase precession becomes stronger (Mehta et al., 2002) as a result of asymmetric place field expansion with increased experience. We also observed a significant shift of place filed location to the direction that the animal is running from (Fig. 6d, first panel; Pearson's linear correlation coefficient, one-tailed, r = −0.09, p = 5.05 × 10⁻⁵), yet we failed to replicate the increase of place field size (Fig. 6d, second panel; Pearson's linear correlation coefficient, one-tailed, r = −0.02, p = 0.86), and the development of asymmetric place fields with experience (Fig. 6d, third panel; skewness: Pearson's linear correlation coefficient, one-tailed, r = 0.07, p = 0.99; Fig. 6d, fourth panel; FRAI, r = 0.08, p = 0.99). Similar conflicting results have been reported by other groups (Huxter et al., 2003; Lee et al., 2004; Schmidt et al., 2009). However, these studies, like ours, defined place field boundaries through firing rate thresholds, which might affect the precision of measurements of place field shape, such as skewness, if a portion of the place field tail was excluded by the boundaries. Nonetheless, our results demonstrated strong individual neuronal phase precessions throughout the recording session, whose strength were not affected by the progressive change of place field locations.
The phase offset of phase precession became more synchronized among individual neurons after the first experience on novel track
Having demonstrated that the presence of phase precession does not necessarily result in population-level theta sequences, we next addressed the neural mechanism underlying this apparent dissociation between the two phenomena. First we verified that the absence of theta sequences on the first lap was not driven by a portion of place fields possessing weak phase precession on the first lap. Previously, we demonstrated that the average strength of phase precession was constant across laps (Fig. 6b, bottom). We further reconstructed theta sequences using only the subset of place fields that possessed strong phase precession (phase-position correlation r < −0.5) on the first lap; also, to be consistent with the firing rate criterion of examining single-lap phase precession, we excluded place fields with peak firing rates <5 Hz in this analysis. The reconstruction based on the subset of place fields again revealed no clear sequential structure on the first lap, yet theta sequence strength immediately after the first lap was largely unaffected (Fig. 7a,b). This control analysis indicates that weak single-lap phase precession does not explain the observed absence of theta sequences on the first lap, further suggesting instead a circuit-level explanation for the dissociation between phase precession and theta sequences. An example of this dissociation can be seen in Figure 3a, where the spikes from two place cells (magenta and green) independently precess through three consecutive theta cycles during both the first and the fourteenth traverse of the same environment by the animal, yet the overall temporal relationship between the two neurons changes on different trials.
One explanation that accounts for the absence of theta sequences on the first lap despite the presence of phase precession is that while each individual neuron undergoes phase precession, each place cell initially precesses through a different phase range of the theta cycle, leading to a lack of structured sequence. Experience-dependent changes in hippocampal circuitry may subsequently serve to coordinate place cells, aligning them to the same phase offset to produce coherent theta sequences. Consistent with this hypothesis, we observed that the phase offset on the first lap was widely distributed and not significantly different from a uniform distribution (Fig. 7c, first polar plot, p = 0.14, Rayleigh test for circular uniformity), whereas on subsequent laps, the phase offset distribution was more concentrated and significantly different from a uniform distribution (Fig. 7c, second to fifth polar plot, p < 6.07 × 10⁻⁸ for lap 2 to lap 14, circular uniformity test). The length of the resultant vector of phase offsets after the first experience was more than three times larger than that of the first lap (Fig. 7c, red), indicating a larger variability of phase offset on the first lap. We obtained similar results when controlling for firing rate variance between different laps (Fig. 7c, green) and also when we restricted our analysis only to place fields that demonstrated strong phase precession on each lap (Fig. 7c, black). We next examined whether there was larger phase offset variability for cells recorded from different recording sites than for those from the same recording site. Within-sites place field pairs demonstrated significantly smaller phase offset variability in single-lap phase precession than between sites place field pairs (resultant vector length of single-lap phase offset of place field pairs, mean ± SEM: 0.78 ± 0.00 vs 0.71 ± 0.00, within-sites vs between sites; p < 10−10, Wilcoxon rank sum test; Fig. 7d, left). Further, the decrease of single-lap phase offset variability with experience was more predominant for between-sites than within-sites pairs (Pearson's linear correlation coefficient: within-sites, r = 0.027, p = 1.94 × 10⁻²; between sites, r = 0.031, p = 2.78 × 10⁻¹⁰). The decrease of phase offset variability among place fields could not be explained by either the theta phase deviation among different recording sites, as has been previously reported (Lubenov and Siapas, 2009; Patel et al., 2012), or by the spike modulation depth (Carr et al., 2012) by theta oscillation. No progressive changes of theta phase deviation (Fig. 7d, middle, black line; circular Kruskal–Wallis test, p = 0.71) or its variability (Fig. 7d, middle, red line; Pearson's linear correlation coefficient r = −0.16, p = 0.58) were observed, and the spiking of cells with stable place fields was theta-modulated to a similar extent throughout experience (Fig. 7d, right; Pearson's linear correlation coefficient r = −0.15, p = 0.60). Together, these data suggest that, upon exposure to a novel environment, individual neurons initially exhibit distinct phase offsets that rapidly become synchronized through early experience (Fig. 8). Further, this rapid synchronization may involve macroscopic coordination of neural activity between different regions of the hippocampus.
Figure 8.

Model of theta sequence development. Phase precessions of individual neurons initially exhibit distinct phase offsets (first lap) but rapidly become synchronized after experience (late laps).
Discussion
We have demonstrated that ensemble-level theta sequences develop rapidly with experience, in contrast to individual neuronal phase precession that occurs without prior experience in the current environment. A previous study has reported that single-lap phase precession becomes stronger with increased experience (Mehta et al., 2002). However, their study used the same phase offset to quantify phase-position correlation for all laps, which according to our data, would produce a weak correlation for the first lap because the phase offset among individual neurons was most widely distributed on the first lap compared with other laps (Fig. 7c). Here we quantified phase-position correlation lap by lap using single-lap phase offset, such that trial-by-trial variability of neural activities can be taken into account (Schmidt et al., 2009). In addition, the finding of Mehta et al. (2002) on phase precession development was proposed to be a neuronal read-out of the asymmetric expansion of place fields during early experience (Mehta et al., 2000), but this asymmetry has not been replicated in our study or in other groups' reports (Huxter et al., 2003; Lee et al., 2004; Schmidt et al., 2009).
Complementary to our findings, Cheng and Frank (2008) investigated how experience shapes hippocampal theta sequences and phase precession across days, and reported both stronger phase precession and higher spiking coordination between pairs of place cells during theta oscillations for familiar days compared with novel days. These results are in accordance with the notion of experience-dependent changes to hippocampal networks, but they do not address the possibility of rapid plasticity on the timescale of individual running laps or the possibility of a dissociation between phase precession and theta sequences, which in our data is revealed by the separate examination of laps. Particularly striking is the fact that, although theta sequences are wholly absent during the first lap, they require only that first lap of experience to develop. It is likely also that our direct measurement of sequences across large numbers of cells enhances the resolution of these effects over the use of pairwise correlation measures (Cheng and Frank, 2008).
To accurately examine progressive changes of neuronal activities on the timescale of individual running laps upon exposure to novel environments, we implemented a decoding algorithm based on single-lap experience. The traditional method of pooling spikes across multiple experiences of the same environment helps to increase the signal-to-noise ratio of position estimation under the assumption that a stable population code has already been established. However, in a novel environment, the neuronal representation of space is not stable (Wilson and McNaughton, 1993; Frank et al., 2004) and undergoes progressive changes, such as place field center of mass shift or the development of place field directionality (Mehta et al., 2000; Frank et al., 2004; Lee et al., 2004; Roth et al., 2012), which limit the utilization of whole session decoding. As we demonstrated from our data, single-lap decoding naturally characterized neuronal spatial representation with equal accuracy on each individual lap and represented more accurate estimation than whole session decoding. It is also reasonable to believe that the accuracy should increase with the number of place cells that are simultaneously being recorded. Moreover, the algorithm of single-lap decoding is potentially more relevant to the online computations performed by the brain areas downstream of the hippocampus (Schmidt et al., 2009).
Contrary to the long-standing hypothesis that individual neuronal phase precession necessarily results in population-level theta sequences (Skaggs et al., 1996), our data demonstrate the absence of theta sequences on the first traversal of a novel linear track despite strong phase precession among individual place cells, further supporting the notion that phase precession and theta sequence may be dissociable (Dragoi and Buzsáki, 2006; Foster and Wilson, 2007). This is particularly striking with single-lap decoding, for which position is as strongly decoded as on other laps, but unlike subsequent laps is static throughout the theta cycle. Possible explanations to account for phase precession's insufficiency to evoke theta sequences on the first lap include the variability of firing rates between different laps, the variability between place field sizes and shapes, and the variability of the exact timing of spikes between different neurons. The first two explanations are unlikely because controlling for the number of emitted spikes on each lap yielded similar results (Fig. 6b, gray), and only place fields that were stable throughout the recording session were used (see Materials and Methods). The third explanation is the most likely because we have demonstrated that the phase offset of phase precession for individual neurons becomes more synchronized after the first lap, indicating a decrease in the variability of the exact timing of spikes between different neurons with experience (Fig. 7c). Note that this change is compatible with the possible trend that we observed in overall phase offset (Fig. 6c, second panel). Moreover, it is possible that, in addition to a reduction in the variability of phase offsets, there may be a reduction in the variability of phase slope/range (Fig. 6c, first and third panels), which our analyses did not fully extract but might also serve to bind cells together in sequences. It is also possible that more complex changes in the spiking time relationships between neurons beyond the alignment of phase precession properties might have contributed to the development of theta sequences. Taken together, our findings suggest that the first experience of running along a novel linear track modulates the timing of firing of different neurons, to increase the temporal coordination between neurons in the following laps.
Our results have implications for the mechanisms underlying the formation of theta sequences. It has previously been proposed that the sequential firing structure of theta sequences could simply arise from spike phase precession of independent neurons driven by a common theta pacemaker (pacemaker models, e.g., the dual-interference model; O'Keefe and Recce, 1993; Skaggs et al., 1996); alternatively, it might require a strengthened temporal coordination among specific hippocampal cell assemblies reinforced by experience. Our results suggest that the latter is the case, as we observed a rapid formation of theta sequence structure during early experience. One candidate mechanism is synaptic plasticity because it is well established that increasing the coupling strength between oscillating neurons can lead to strong phase synchronization (Breakspear et al., 2010). Further, the formation of sequence structure that we observed was associated with increased spiking coordination between anatomically distributed groups of neurons, suggesting the possibility of macroscopic coordination across the hippocampus. It remains unknown how this coordination integrates with other features of hippocampal macroscopic organization that have been reported, such as the traveling wave of theta along the septotemporal axis of the hippocampus (Lubenov and Siapas, 2009; Patel et al., 2012), or progressive differences in spatial coding properties along this axis (Kjelstrup et al., 2008) and along the proximodistal axis of CA1 (Henriksen et al., 2010).
It is widely thought that experience-driven plastic changes in hippocampus underlie many learning and memory processes (Morris et al., 1982; Morris et al., 1986; Whitlock et al., 2006). Although it may take more than 10 min to develop a stable population code for a novel square arena (Wilson and McNaughton, 1993), and up to 3 d for a place field to fully develop its directionality on a novel linear arm (Frank et al., 2004), we have reported a very rapid process of formation for theta sequences, almost exclusively happening within the first experience (on average a few seconds of running on the novel linear track), when other neural activities were still undergoing progressive changes. This one-trial dramatic change of hippocampal sequential firing structure does not only support the notion of fast learning in the hippocampus but also indicates an important role of theta sequences in early spatial learning.
In conclusion, our results suggest that hippocampal neural networks may undergo rapid plasticity during experience, to acquire predictive representations of the immediate future in the form of theta sequences. This rapid development of theta sequences only requires a single experience and is achieved by synchronizing experience-independent temporal coding across individual neurons (Fig. 8).
Footnotes
This work was supported by National Institutes of Health Grant RO1 MH085823 to D.J.F. and a National Science Foundation student grant to D.S.
The authors declare no competing financial interests.
References
- Berens P. CircStat: a MATLAB toolbox for circular statistics. J Stat Softw. 2009;31:1–21. [Google Scholar]
- Breakspear M, Heitmann S, Daffertshofer A. Generative models of cortical oscillations: neurobiological implications of the Kuramoto model. Front Hum Neurosci. 2010;4:190. doi: 10.3389/fnhum.2010.00190. [DOI] [PMC free article] [PubMed] [Google Scholar]
- Carr MF, Karlsson MP, Frank LM. Transient slow gamma synchrony underlies hippocampal memory replay. Neuron. 2012;75:700–713. doi: 10.1016/j.neuron.2012.06.014. [DOI] [PMC free article] [PubMed] [Google Scholar]
- Cheng S, Frank LM. New experiences enhance coordinated neural activity in the hippocampus. Neuron. 2008;57:303–313. doi: 10.1016/j.neuron.2007.11.035. [DOI] [PMC free article] [PubMed] [Google Scholar]
- Davidson TJ, Kloosterman F, Wilson MA. Hippocampal replay of extended experience. Neuron. 2009;63:497–507. doi: 10.1016/j.neuron.2009.07.027. [DOI] [PMC free article] [PubMed] [Google Scholar]
- Dragoi G, Buzsáki G. Temporal encoding of place sequences by hippocampal cell assemblies. Neuron. 2006;50:145–157. doi: 10.1016/j.neuron.2006.02.023. [DOI] [PubMed] [Google Scholar]
- Foster DJ, Wilson MA. Reverse replay of behavioural sequences in hippocampal place cells during the awake state. Nature. 2006;440:680–683. doi: 10.1038/nature04587. [DOI] [PubMed] [Google Scholar]
- Foster DJ, Wilson MA. Hippocampal theta sequences. Hippocampus. 2007;17:1093–1099. doi: 10.1002/hipo.20345. [DOI] [PubMed] [Google Scholar]
- Frank LM, Stanley GB, Brown EN. Hippocampal plasticity across multiple days of exposure to novel environments. J Neurosci. 2004;24:7681–7689. doi: 10.1523/JNEUROSCI.1958-04.2004. [DOI] [PMC free article] [PubMed] [Google Scholar]
- Gaffan D. Scene-specific memory for objects: a model of episodic memory impairment in monkeys with fornix transection. J Cogn Neurosci. 1994;6:305–320. doi: 10.1162/jocn.1994.6.4.305. [DOI] [PubMed] [Google Scholar]
- Gupta AS, van der Meer MA, Touretzky DS, Redish AD. Segmentation of spatial experience by hippocampal theta sequences. Nat Neurosci. 2012;15:1032–1039. doi: 10.1038/nn.3138. [DOI] [PMC free article] [PubMed] [Google Scholar]
- Harvey CD, Collman F, Dombeck DA, Tank DW. Intracellular dynamics of hippocampal place cells during virtual navigation. Nature. 2009;461:941–946. doi: 10.1038/nature08499. [DOI] [PMC free article] [PubMed] [Google Scholar]
- Hebb DO, Martinez JL, Glickman SE. The organization of behavior: a neuropsychological theory. Contemp Psychol. 1994;39:1018–1020. [Google Scholar]
- Henriksen EJ, Colgin LL, Barnes CA, Witter MP, Moser MB, Moser EI. Spatial representation along the proximodistal axis of CA1. Neuron. 2010;68:127–137. doi: 10.1016/j.neuron.2010.08.042. [DOI] [PMC free article] [PubMed] [Google Scholar]
- Huxter J, Burgess N, O'Keefe J. Independent rate and temporal coding in hippocampal pyramidal cells. Nature. 2003;425:828–832. doi: 10.1038/nature02058. [DOI] [PMC free article] [PubMed] [Google Scholar]
- Itskov V, Curto C, Pastalkova E, Buzsáki G. Cell assembly sequences arising from spike threshold adaptation keep track of time in the hippocampus. J Neurosci. 2011;31:2828–2834. doi: 10.1523/JNEUROSCI.3773-10.2011. [DOI] [PMC free article] [PubMed] [Google Scholar]
- Jeewajee A, Lever C, Burton S, O'Keefe J, Burgess N. Environmental novelty is signaled by reduction of the hippocampal theta frequency. Hippocampus. 2008;18:340–348. doi: 10.1002/hipo.20394. [DOI] [PMC free article] [PubMed] [Google Scholar]
- Jensen O, Lisman JE. Hippocampal CA3 region predicts memory sequences: accounting for the phase precession of place cells. Learn Mem. 1996;3:279–287. doi: 10.1101/lm.3.2-3.279. [DOI] [PubMed] [Google Scholar]
- Johnson A, Redish AD. Neural ensembles in CA3 transiently encode paths forward of the animal at a decision point. J Neurosci. 2007;27:12176–12189. doi: 10.1523/JNEUROSCI.3761-07.2007. [DOI] [PMC free article] [PubMed] [Google Scholar]
- Kjelstrup KB, Solstad T, Brun VH, Hafting T, Leutgeb S, Witter MP, Moser EI, Moser MB. Finite scale of spatial representation in the hippocampus. Science. 2008;321:140–143. doi: 10.1126/science.1157086. [DOI] [PubMed] [Google Scholar]
- Lee AK, Wilson MA. Memory of sequential experience in the hippocampus during slow wave sleep. Neuron. 2002;36:1183–1194. doi: 10.1016/S0896-6273(02)01096-6. [DOI] [PubMed] [Google Scholar]
- Lee I, Rao G, Knierim JJ. A double dissociation between hippocampal subfields: differential time course of CA3 and CA1 place cells for processing changed environments. Neuron. 2004;42:803–815. doi: 10.1016/j.neuron.2004.05.010. [DOI] [PubMed] [Google Scholar]
- Lubenov EV, Siapas AG. Hippocampal theta oscillations are travelling waves. Nature. 2009;459:534–539. doi: 10.1038/nature08010. [DOI] [PubMed] [Google Scholar]
- Maurer AP, Burke SN, Lipa P, Skaggs WE, Barnes CA. Greater running speeds result in altered hippocampal phase sequence dynamics. Hippocampus. 2012;22:737–747. doi: 10.1002/hipo.20936. [DOI] [PMC free article] [PubMed] [Google Scholar]
- McNaughton BL, Barnes CA, O'Keefe J. The contributions of position, direction, and velocity to single unit activity in the hippocampus of freely-moving rats. Exp Brain Res. 1983;52:41–49. doi: 10.1007/BF00237147. [DOI] [PubMed] [Google Scholar]
- Mehta MR, Quirk MC, Wilson MA. Experience-dependent asymmetric shape of hippocampal receptive fields. Neuron. 2000;25:707–715. doi: 10.1016/S0896-6273(00)81072-7. [DOI] [PubMed] [Google Scholar]
- Mehta MR, Lee AK, Wilson MA. Role of experience and oscillations in transforming a rate code into a temporal code. Nature. 2002;417:741–746. doi: 10.1038/nature00807. [DOI] [PubMed] [Google Scholar]
- Morris RG, Garrud P, Rawlins JN, O'Keefe J. Place navigation impaired in rats with hippocampal lesions. Nature. 1982;297:681–683. doi: 10.1038/297681a0. [DOI] [PubMed] [Google Scholar]
- Morris RG, Anderson E, Lynch GS, Baudry M. Selective impairment of learning and blockade of long-term potentiation by an N-methyl-D-aspartate receptor antagonist, AP5. Nature. 1986;319:774–776. doi: 10.1038/319774a0. [DOI] [PubMed] [Google Scholar]
- Nitz D, McNaughton B. Differential modulation of CA1 and dentate gyrus interneurons during exploration of novel environments. J Neurophysiol. 2004;91:863–872. doi: 10.1152/jn.00614.2003. [DOI] [PubMed] [Google Scholar]
- O'Keefe J, Nadel L. The hippocampus as a cognitive map. Behav Brain Sci. 1979;2:520–528. doi: 10.1017/S0140525X00064256. [DOI] [Google Scholar]
- O'Keefe J, Recce ML. Phase relationship between hippocampal place units and the EEG theta-rhythm. Hippocampus. 1993;3:317–330. doi: 10.1002/hipo.450030307. [DOI] [PubMed] [Google Scholar]
- Olton DS, Samuelson RJ. Remembrance of places passed: spatial memory in rats. J Exp Psychol Anim Behav Process. 1976;2:97–116. doi: 10.1037/0097-7403.2.2.97. [DOI] [Google Scholar]
- Patel J, Fujisawa S, Berényi A, Royer S, Buzsáki G. Traveling theta waves along the entire septotemporal axis of the hippocampus. Neuron. 2012;75:410–417. doi: 10.1016/j.neuron.2012.07.015. [DOI] [PMC free article] [PubMed] [Google Scholar]
- Penley SC, Hinman JR, Long LL, Markus EJ, Escabí MA, Chrobak JJ. Novel space alters theta and gamma synchrony across the longitudinal axis of the hippocampus. Front Syst Neurosci. 2013;7:20. doi: 10.3389/fnsys.2013.00020. [DOI] [PMC free article] [PubMed] [Google Scholar]
- Pfeiffer BE, Foster DJ. Hippocampal place-cell sequences depict future paths to remembered goals. Nature. 2013;497:74–79. doi: 10.1038/nature12112. [DOI] [PMC free article] [PubMed] [Google Scholar]
- Rosenzweig ES, Ekstrom AD, Redish AD, McNaughton B, Barnes CA. Phase precession as an experience independent process: hippocampal pyramidal cell phase precession in a novel environment and under NMDS-receptor blockade. Soc Neurosci Abstr. 2000;26:982. [Google Scholar]
- Roth ED, Yu X, Rao G, Knierim JJ. Functional differences in the backward shifts of CA1 and CA3 place fields in novel and familiar environments. PLoS One. 2012;7:e36035. doi: 10.1371/journal.pone.0036035. [DOI] [PMC free article] [PubMed] [Google Scholar]
- Samsonovich A, McNaughton BL. Path integration and cognitive mapping in a continuous attractor neural network model. J Neurosci. 1997;17:5900–5920. doi: 10.1523/JNEUROSCI.17-15-05900.1997. [DOI] [PMC free article] [PubMed] [Google Scholar]
- Schmidt R, Diba K, Leibold C, Schmitz D, Buzsáki G, Kempter R. Single-trial phase precession in the hippocampus. J Neurosci. 2009;29:13232–13241. doi: 10.1523/JNEUROSCI.2270-09.2009. [DOI] [PMC free article] [PubMed] [Google Scholar]
- Scoville WB, Milner B. Loss of recent memory after bilateral hippocampal lesions. J Neurol Neurosurg Psychiatry. 1957;20:11–21. doi: 10.1136/jnnp.20.1.11. [DOI] [PMC free article] [PubMed] [Google Scholar]
- Skaggs WE, McNaughton BL, Wilson MA, Barnes CA. Theta phase precession in hippocampal neuronal populations and the compression of temporal sequences. Hippocampus. 1996;6:149–172. doi: 10.1002/(SICI)1098-1063(1996)6:2<149::AID-HIPO6>3.0.CO;2-K. [DOI] [PubMed] [Google Scholar]
- Sławińska U, Kasicki S. The frequency of rat's hippocampal theta rhythm is related to the speed of locomotion. Brain Res. 1998;796:327–331. doi: 10.1016/S0006-8993(98)00390-4. [DOI] [PubMed] [Google Scholar]
- Steele RJ, Morris RG. Delay-dependent impairment of a matching-to-place task with chronic and intrahippocampal infusion of the NMDA-antagonist D-AP5. Hippocampus. 1999;9:118–136. doi: 10.1002/(SICI)1098-1063(1999)9:2<118::AID-HIPO4>3.0.CO;2-8. [DOI] [PubMed] [Google Scholar]
- Toft PA. 1996. The radon transform: theory and implementation. PhD thesis, Dept of Mathematical Modelling, Technical University of Denmark ( http://petertoft.dk/PhD/) [Google Scholar]
- Tsodyks M. Attractor neural network models of spatial maps in hippocampus. Hippocampus. 1999;9:481–489. doi: 10.1002/(SICI)1098-1063(1999)9:4<481::AID-HIPO14>3.0.CO;2-S. [DOI] [PubMed] [Google Scholar]
- Vanderwolf CH. Hippocampal electrical activity and voluntary movement in the rat. Electroencephalogr Clin Neurophysiol. 1969;26:407–418. doi: 10.1016/0013-4694(69)90092-3. [DOI] [PubMed] [Google Scholar]
- Whishaw IQ, Vanderwolf CH. Hippocampal EEG and behavior: changes in amplitude and frequency of RSA (theta rhythm) associated with spontaneous and learned movement patterns in rats and cats. Behav Biol. 1973;8:461–484. doi: 10.1016/S0091-6773(73)80041-0. [DOI] [PubMed] [Google Scholar]
- Whitlock JR, Heynen AJ, Shuler MG, Bear MF. Learning induces long-term potentiation in the hippocampus. Science. 2006;313:1093–1097. doi: 10.1126/science.1128134. [DOI] [PubMed] [Google Scholar]
- Wilson MA, McNaughton BL. Dynamics of the hippocampal ensemble code for space. Science. 1993;261:1055–1058. doi: 10.1126/science.8351520. [DOI] [PubMed] [Google Scholar]
- Yamaguchi Y, Aota Y, McNaughton BL, Lipa P. Bimodality of theta phase precession in hippocampal place cells in freely running rats. J Neurophysiol. 2002;87:2629–2642. doi: 10.1152/jn.2002.87.6.2629. [DOI] [PubMed] [Google Scholar]