Abstract
Silver vanadium oxide (Ag2V4O11, SVO) has enjoyed widespread commercial success over the past 30 years as a cathode material for implantable cardiac defibrillator (ICD) batteries. Recently, silver vanadium phosphorous oxide (Ag2VO2PO4, SVPO) has been studied as possibly combining the desirable thermal stability aspects of LiFePO4 with the electrical conductivity of SVO. Further, due to the noted insoluble nature of most phosphate salts, a lower material solubility of SVPO relative to SVO is anticipated. Thus, the first vanadium dissolution studies of SVPO in battery electrolyte solutions are described herein. The equilibrium solubility of SVPO was ~5 times less than SVO, with a rate constant of dissolution ~3.5 times less than that of SVO. The vanadium dissolution in SVO and SVPO can be adequately described with a diffusion layer model, as supported by the Noyes-Whitney equation. Cells prepared with vanadium-treated anodes displayed higher AC impedance and DC resistance relative to control anodes. These data support the premise that SVPO cells are likely to exhibit reduced cathode solubility and thus less affected by increased cell resistance due to cathode solubility compared to SVO based cells.
Keywords: primary battery, lithium battery, implantable cardiac defibrillator, solubility, dissolution
1. Introduction
Batteries developed for implantation in biomedical devices need to satisfy a multitude of requirements.[1] While power requirements are specific to the particular application, all batteries intended to power implantable medical devices must provide long device lifetime, occupy minimal space, and perform in a reliable, predictable and safe manner. Specifically, the implantable cardioverter defibrillator (ICD) has particularly demanding and wide ranging energy and power requirements for complete ICD function. An ICD continuously monitors heart function and on demand delivers a high energy shock to the heart to treat arrhythmias. In order to successfully power an ICD, the primary lithium batteries must provide continuous 10–50 microampere level currents to power the monitoring circuitry and in some cases to support heart pacing functionality. On detection of an arrhythmia, the batteries must deliver ampere level currents at an energy level of 30–50 J to rapidly charge the high voltage capacitors whose discharge to the heart interrupts the ventricular fibrillation.[2] The high power demands of ICDs necessitate a battery which is capable of delivering high current pulses of 2–3 A in order to charge the capacitors of the device.[3]
The battery technology used to power the majority of ICDs over the past 20+ years and continuing to the present day is based on the lithium/silver vanadium oxide system (Li/SVO, Ag2V4O11), which enabled the widespread use of these lifesaving medical devices.[4–6] SVO is a notable bimetallic cathode material, offering the advantages of multiple electron transfers per formula unit, and the opportunity for in-situ formation of conductive silver metal nanoparticles on discharge. Both of these material properties are significant, as they provide the needed energy content and power for this demanding application. We have further explored this material design motif, introducing a series of bimetallic electrochemical displacement materials with these characteristics.[7–14] With a focus on central elements of Fe, Mn, and V, possible use as cathode materials in both primary and secondary batteries has been demonstrated.
The ICD application benefits from a stable internal cell resistance over the life of the battery as that enables consistent battery and thus, consistent device performance. Increased battery resistance translates to a longer time needed to charge the ICDs capacitors,[15] and thus, slower delivery of the defibrillation therapy. Minimizing battery resistance is critical in order to maximize the effectiveness of the ICD device.
A significant issue which needs to be considered when selecting a battery system for this application is the solubility of the cathode material, defined here as the loss of electroactive material from the solid cathode into the electrolyte. If even a small quantity of cathode material dissolves, transition metal ions enter the electrolyte and several undesirable effects can occur. First, solubility of the cathode results in direct capacity diminution via loss of electroactive material from the cathode structure. Further, these dissolved transition metal ions can also deposit on the surface of the lithium metal anode, forming a passivation layer on the anode which increases the cell resistance and limits the current which may be drawn from the cell. In particular, cathode solubility can be a crucial issue in the ICD application where consistent pulse performance is demanded and surgical replacement must be minimized. In spite of the potential impact on cell performance, relatively few reports exist on cathode solubility pertaining to non-aqueous battery systems.[16–26] In the specific case of the Li/SVO system, it has been reported that the cell behavior is affected by vanadium ion dissolution into the electrolyte solution which deposits on the lithium anode, increasing cell resistance.[27]
While the solubility of cathode materials can be influenced by their physical properties such as surface area, the inherent crystallographic structure and chemical composition of materials play large roles in the determination of their dissolution properties. In general, the dissolution process is less likely to be thermodynamically favorable for materials with stable crystal structures characterized by high lattice energies.[28] Thus, a potential strategy for minimizing cathode solubility is to use cathodes with high chemical stability. Phosphate-based cathode materials are suitable candidates for reducing solubility due to their demonstrated structural and chemical stability.[24, 29] The stability of phosphate structures vs. oxides is attributed to the strength of the P-O bonds that stabilize the molecular framework. When PO43− polyanions are introduced into the lattice, electronegative phosphorous atoms polarize electrons in the P-O bond, thus reducing the covalency of the M-O bond.[29–31] This inductive effect raises the voltage of the redox couple[30] and stabilizes the structure by making oxygen atoms more difficult to extract.[32]
We identified silver vanadium phosphorous oxides, AgwVxPyOz, to be a material family of interest, with the goal of achieving the in-situ formation of conductive silver metal nanoparticles and multiple electron transfers per formula unit exhibited by SVO, coupled with the high material stability of phosphate based materials. Previous electrochemical characterization has shown Ag2VO2PO4, identified here as SVPO, to be a promising cathode material for high rate applications such as ICDs.[7–9, 12] The lack of change in interlayer spacing upon discharge of the SVPO material supported our expectation that phosphorous oxide moieties in the molecular framework would impart stability and rigidity.[9] Our hypothesis is that SVPO cathode materials will minimize cathode solubility and anode passivation compared to SVO, resulting in more stable charge times when deployed in the ICD application.
In seeking to better understand cathode solubility in batteries for the ICD application, this study compares the solubility behavior of silver vanadium oxide (Ag2V4O11, SVO) with the phosphate-based cathode silver vanadium phosphorous oxide (Ag2VO2PO4, SVPO). Theoretical and empirical solubility studies of transition metal systems in electrolytes have been undertaken in the past, with particular interest in manganese oxide based systems.[33–35] However, to our knowledge, this study represents the first time that solubility behavior has been investigated for an oxide based cathode material and its phosphate analogue. Kinetic analysis of vanadium solubility data was performed to gain understanding of the mechanism of dissolution, AC impedance measurements as well as pulse tests of cells containing vanadium treated lithium surfaces were used to demonstrate the effects of solubility on cell resistance. The data demonstrate the improved stability and reduced solubility of SVPO relative to SVO, showing SVPO to be a worthy material for additional investigations relevant to its use in ICD batteries. In general, the techniques described herein establish a paradigm for other battery systems where cathode solubility may be an issue.
2. Experimental
2.1. Material Synthesis and Characterization
Silver vanadium phosphorous oxide (Ag2VO2PO4) was synthesized by a hydrothermal reaction according to a previously reported method.[36] Silver vanadium oxide (Ag2V4O11) was prepared by the method reported in the literature.[37]
The materials were characterized by several methods. Differential scanning calorimetry (DSC) analysis was performed using a TA instruments Q20. Powder X-ray diffraction (XRD) patterns were recorded with a Rigaku Ultima IV X-ray diffractometer. Cu Kα radiation was used with Bragg-Brentano focusing geometry for the XRD measurements, and the collected data were analyzed using MDI Jade software. Particle size of the materials was determined using a Horiba LA-950V2 laser scattering particle size analyzer. Surface area was measured with a Micromeritics Tristar II 3020 through the multipoint BET (Brunauer, Emmett, and Teller) method. Scanning electron microscope (SEM) images were collected on a Hitachi SU-70 field emission scanning electron microscope.
2.2. Dissolution analysis
In order to investigate the solubility of the cathode materials, each compound was immersed in electrolyte solution under inert atmosphere conditions and ambient temperature. The electrolyte consisted of 1 M LiBF4 dissolved in PC-DME (propylene carbonate-dimethoxyethane, 1:1 by volume) and was analyzed for water content using the Karl Fisher titration method. The samples were stirred and protected from light. At specified time intervals a low volume of electrolyte (1 mL) was removed from each sample and analyzed via inductively coupled plasma – optical emission spectroscopy (ICP-OES) to determine the dissolved concentration of silver and vanadium ions. A Thermofisher iCAP 6300 series ICP-OES was utilized to collect the concentration measurements.
2.3. AC Impedance Spectroscopy of Treated Li-Li cells
Lithium metal foil anodes were exposed to a vanadium containing solution in PC-DME (propylene carbonate-dimethoxyethane, 1:1 by volume) solvent for 4 hours, after which a brown discoloration of the treated surface was observed. Two electrode electrochemical cells were constructed using one treated Li and one fresh Li foil as electrodes. Control cells having two fresh Li anodes were also constructed. The electrolyte utilized was 1 M LiBF4 in PC-DME (1:1 by volume). AC impedance measurements were collected using a BioLogic VSP multichannel potentiostat using a 5 mV sinus amplitude and a frequency range of 10 mHz to 100 kHz. Analysis of AC impedance data was performed using ZView software, Version 3.3b. The data were fit to an equivalent circuit model to quantify the cell resistance.
2.4 Pulse test of Control and V-Treated Li-SVPO Cells
Coin type experimental cells were assembled using SVPO cathodes and lithium metal anodes. Two sets of cells were prepared where the first group of cells used fresh lithium metal anodes to serve as control cells and the second group used V-treated lithium metal anodes. The cells were tested by application of a pulse train of three ten second pulses in a row where each pulse at a current density of 20 mA cm−2 was followed by 10 seconds of open circuit voltage.
3. Results and Discussion
3.1. Material Characterization
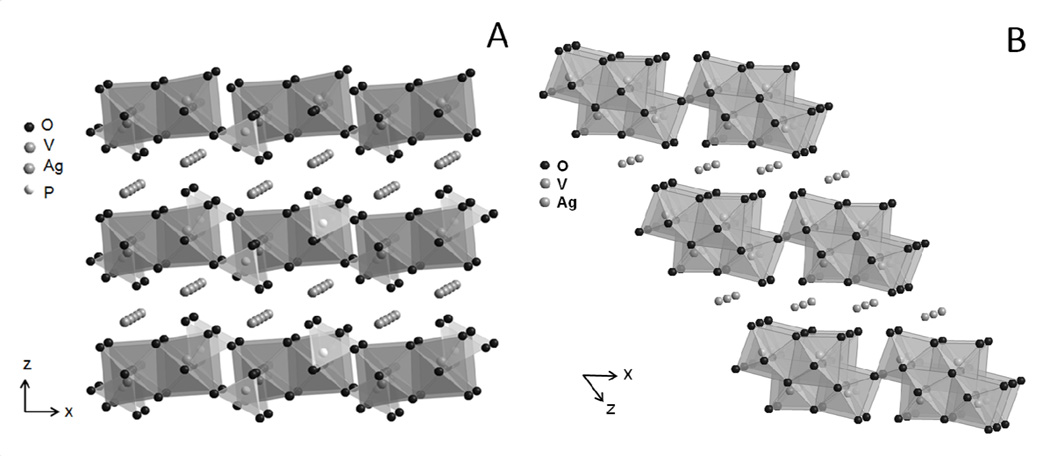
X-ray diffraction characterization of the target materials was performed, and the experimentally recorded patterns were matched to those reported in the literature (see supplemental data). SVPO crystallizes in the monoclinic C2/m space group. The structure is characterized by layers of edge sharing VO6 octahedra and PO4 tetrahedra layers which are parallel to the (001) crystallographic plane (Figure 1A).[36] The Ag+ ions located between the layers are in a distorted octahedral coordination with oxygen. SVO is also a layered structure crystallizing in the c2/m space group (Figure 1B).[38] Its layers stack in the [001] direction and are comprised of distorted VO6 octahedra which share edges and corners. Ag+ ions between the V4O11 layers are coordinated to five oxygen atoms.
Figure 1.
Structures of A) silver vanadium phosphorous oxide (SVPO), Ag2VO2PO4 and B) silver vanadium oxide (SVO), Ag2V4O11
Thermal analysis using differential scanning calorimetry verified single endothermic transitions (see supplemental data). The absence of additional endotherms suggests that the synthesized materials were comprised of single pure phases.[7, 12]
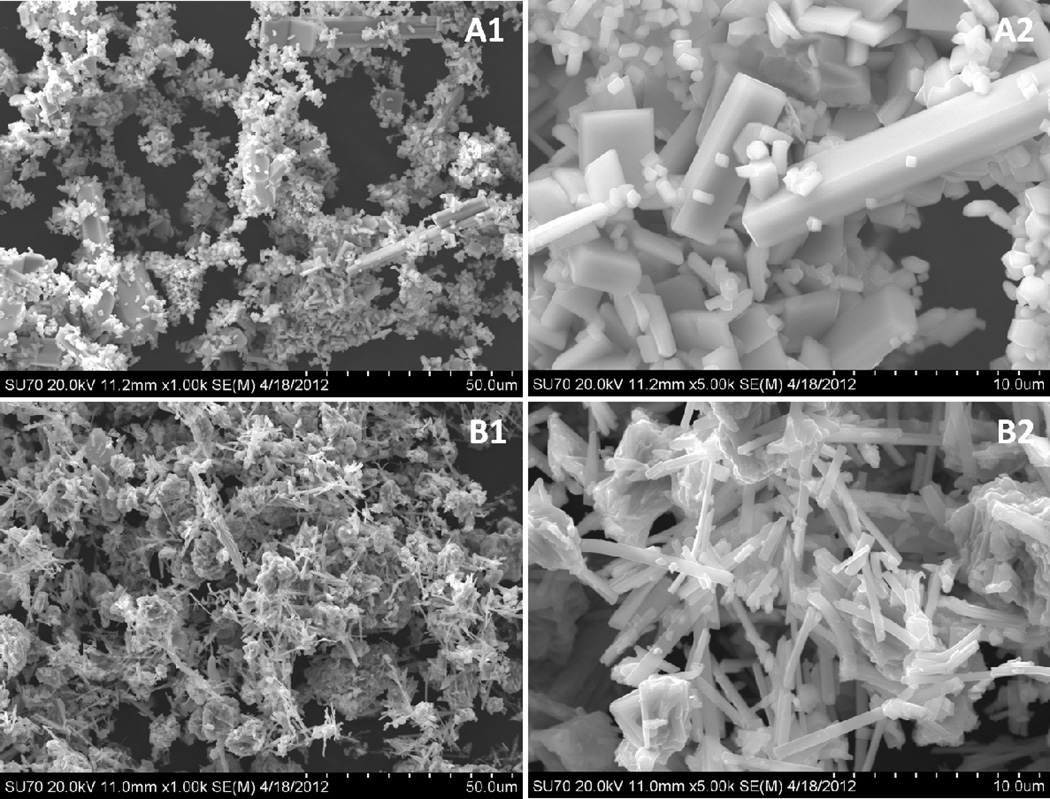
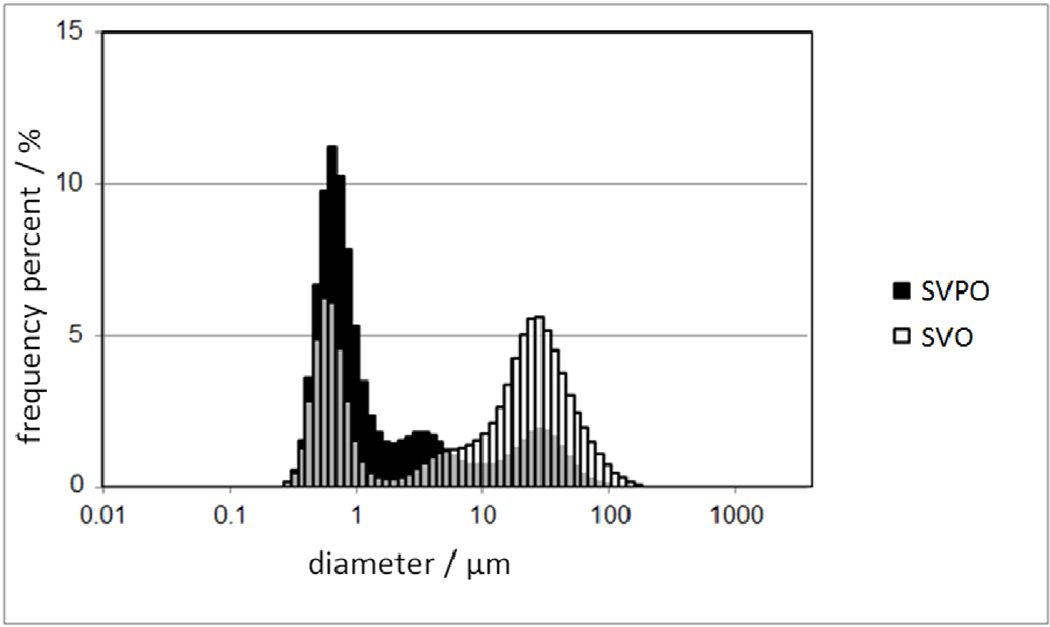
SEM images revealed some differences in morphology and particle size in the materials of interest (Figure 2). The SVPO sample was comprised of both larger rod shaped structures and smaller granular particles (Figure 2A). The rods typically ranged from 15–35 µm in length with a width of 3–4 µm, whereas the smaller particles had typical dimensions of 0.5–3µm. In contrast, SVO exhibited a distinct morphology consisting of needle shaped particles with an average length of 4 µm and width of 0.5 µm mixed with larger, irregular masses 5 to 50 µm in diameter (Figure 2B). Laser scattering particle size measurements were performed to quantify the predominant dimensions of the particles (Figure 3). A typical particle size distribution for SVPO displayed maxima at 0.6, 4 and 25 µm. The multi-modal distribution of particle size for this material is typical of rod shaped particles and corresponds to the SEM images. The SVO material exhibited a more narrow distribution at approximately 0.6 µm and a broader distribution at 25 µm. The bimodal distribution is representative of the needle shaped particles and larger masses observed via SEM . The surface area measured by the BET method of the samples was similar where the surface area of SVPO was approximately 0.7 ± 0.1 m2g−1 and that of the SVO particles was 0.8 ± 0.2 m2g−1. While the surface areas of the materials were similar, subtle differences in the particle size distributions and particle shapes would need to be accounted for in further comparisons.
Figure 2.
Scanning electron microscope (SEM) images of A) SVPO and B) SVO under 1) 1 kX and 2) 5 kX magnification
Figure 3.
Particle size distributions of SVPO and SVO
3.2. Dissolution Study
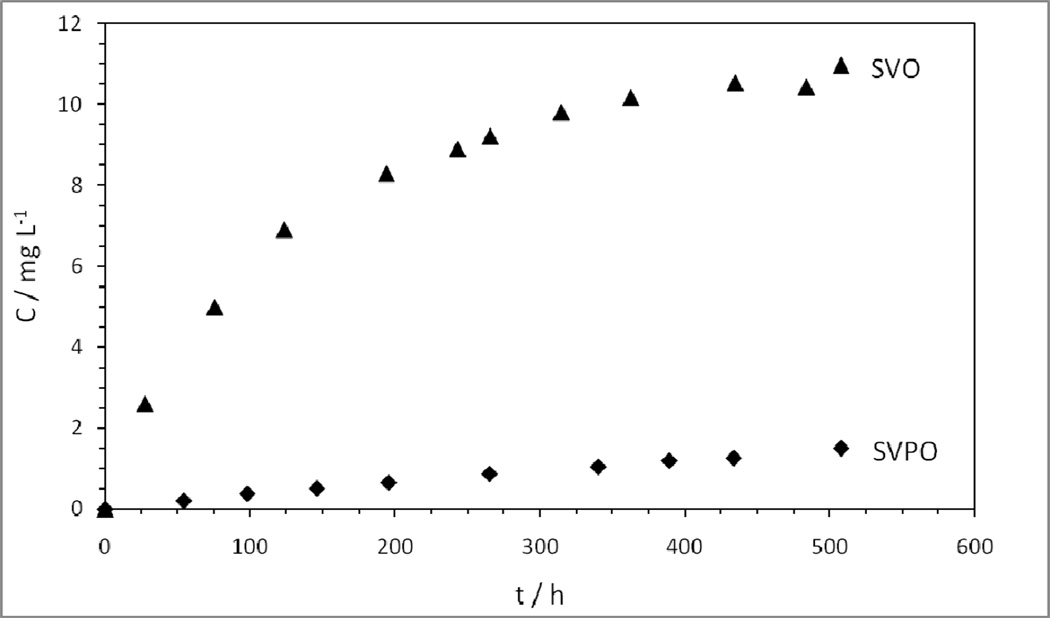
Typical open circuit voltages of lithium/SVPO and lithium/SVO cells are comparable, at 3.4 and 3.2 V, respectively.[8, 39] Dissolution analyses of SVPO and SVO were performed with the purpose of comparing solubility of the two materials. The concentration data were recorded as a function of time, so that the kinetics of the dissolution process could be examined. The data were compiled to show the concentration of V versus time found in electrolyte solution for SVPO and SVO (Figure 4). In order to account for the small volumes of electrolyte removed from the parent samples at each measurement point, a volume correction calculation was applied to the data to account for the volume of each aliquot removed for analysis. The data reveal that the magnitude of dissolved V ions from SVO is several times that of SVPO.
Figure 4.
Concentration of vanadium dissolved in electrolyte as a function of time for SVPO and SVO
In order to gain more insight into the vanadium solubility behavior, the concentration-time data was fit to the Noyes-Whitney equation, which is used to describe the dissolution of solid particles in liquid media:[40, 41]
| [1] |
where C is the concentration of the solid at time t, Cs is the equilibrium solubility at the particle surface, and k is a proportionality constant. Integration of [1] yields the form:
| [2] |
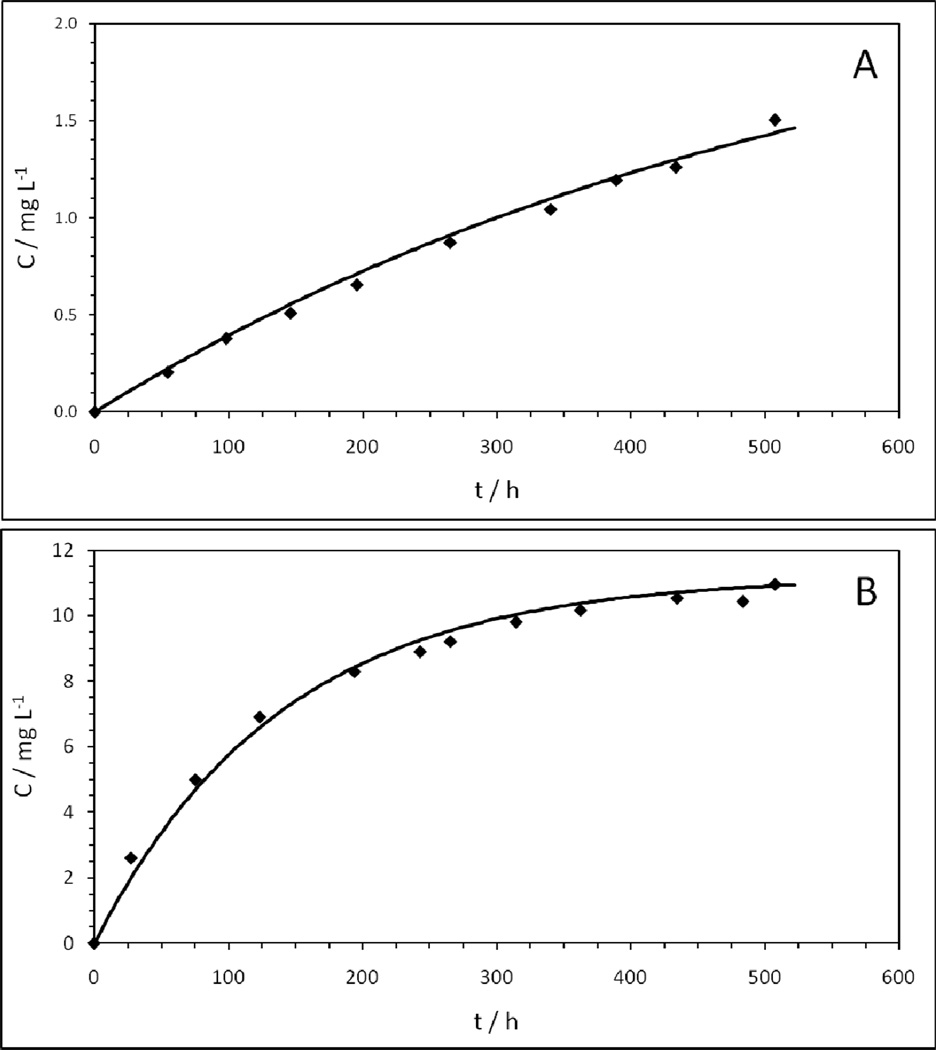
This equation represents a diffusion layer model where the extent of dissolution is dependent upon the equilibrium solubility of the material. The rate limiting step in the process is the transport of solvated molecules from the particle surface through a thin diffusion layer to the bulk solution.[41] Non-linear regression analysis was used to fit equation [2] to experimental vanadium dissolution data from 9 individual trials. The best fit curves were used to evaluate the parameters Cs and k. Examination of representative concentration–time plots for SVPO (Figure 5A) and SVO (Figure 5B) shows good agreement between the data and the best fit curves. For the SVPO material, the average value of Cs was 2.2 ± 0.5 mg/L, and k was determined to be 5.8 × 10⁻⁷ ± 1.0 × 10⁻⁷ s−1. The average correlation coefficient for the SVPO fits was 0.98 ± 0.01. In contrast, the greater magnitude of V dissolution observed for SVO was quantified as having Cs and k values of 10.4 ± 1.7 mg/L and 2.1 × 10⁻⁶ ± 0.5 × 10⁻⁶ s−1, respectively, with the average correlation being 0.98 ± 0.01. Thus, the diffusion layer model described by equation 2 is adequate to describe the vanadium dissolution of SVO and SVPO. Furthermore, SVO was found to have an equilibrium solubilitywhich was approximately 5 times greater than SVPO, and a rate constant approximately 3.5 times greater than SVPO.
Figure 5.
Fits of vanadium concentration data as a function of time for A) SVPO and B) SVO to diffusion-layer models (C = Cs[1−exp(−kt)])
The surface area data suggest that the observed difference in magnitude of the equilibrium solubility is likely due to differences in stability between the phosphate and oxide based structures. Notably, the particle size distribution and surface area of the SVPO and SVO materials were similar, thus the significant difference in vanadium solubility cannot be explained by differences in physical properties between the two materials. These data, the first direct comparison of the solubility of an oxide based materials and its phosphate analog in nonaqueous electrolyte, support our initial premise that a phosphate based material will demonstrate reduced cathode solubility over an oxide based material.
3.3. AC Impedance Study
It is notable that the impedance of a battery is due to a variety of contributions including those of the anode, the cathode and the electrolyte. In the case of silver vanadium oxide (SVO), the cathode resistance decreases with discharge which is observed as decreased cell resistance when the cells are discharged rapidly. However, over long discharge times, the cell impedance is observed to increase which has been attributed to cathode dissolution and associated increase in resistance at the anode.[27] For silver vanadium phosphorous oxide (SVPO) based cells, there is also a significant decrease in both the cathode and cell resistance with initial discharge.[8, 9] Both the cathode resistance and cell impedance as a function of depth of discharge have been reported and directly correlate over short discharge times.
One of the potential complications of cathode dissolution is raising the impedance of a battery due to the deposition of the dissolution products on the anode. As the solubility experiments indicated a clear difference in the amount of vanadium which dissolves from the SVO and SVPO cathode materials we wished to examine the potential impact of the vanadium dissolution with respect to internal cell resistance with a focus on the anode. AC impedance measurements were performed on 2 electrode cells containing one V-treated Li electrode and one untreated electrode, compared with AC impedance data collected on control cells containing fresh lithium surfaces at both electrodes. For each experiment, 5 anodes treated with V were prepared. Three of the treated anodes were used to construct cells for the AC impedance study, while the remaining samples were digested and analyzed by ICP-OES to determine V content. Multiple experimental trials were performed to confirm trends in the data.
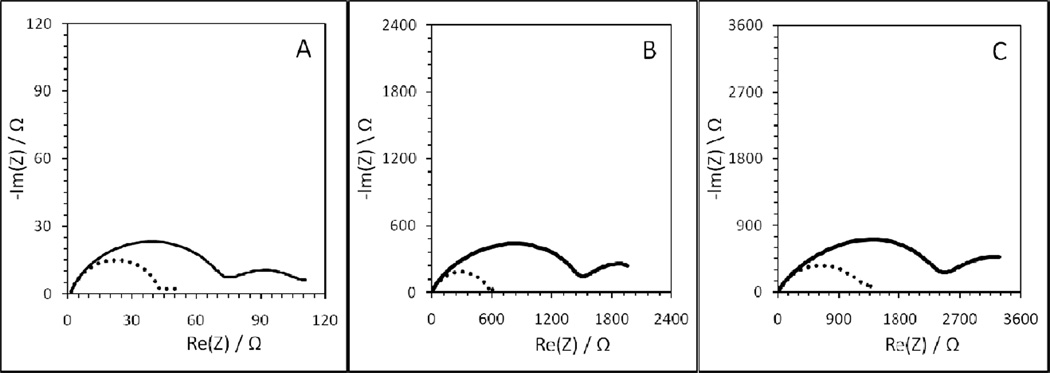
AC impedance data were collected and plotted in the Nyquist format for a typical V-treated cell and a control cell at time intervals of 24 hours, 72 hours, and 120 hours (Figure 6). The impedance increases with increasing storage time. After 24 hours at 37°C the diameter of the semicircle in the Nyquist plots was approximately 45 Ω, and 70 Ω for the control cell and V-treated cell, respectively. Passivation of the anode surface increased with time such that after 120 hours of storage these values had increased to 1400Ω and 2500Ω. The Nyquist plots clearly demonstrate that cells containing the anodes treated with V had a higher internal resistance at each time point. The implication of this result is that cathode materials which dissolve vanadium into the electrolyte will accelerate passivation of the anode surface and increase the overall cell resistance.
Figure 6.
Nyquist plots of cells containing fresh lithium anodes (control, dotted line) and V-treated Li anodes (solid line), where AC impedance data was collected A) 24 h, B) 72 h, and C) 120 h after cell construction
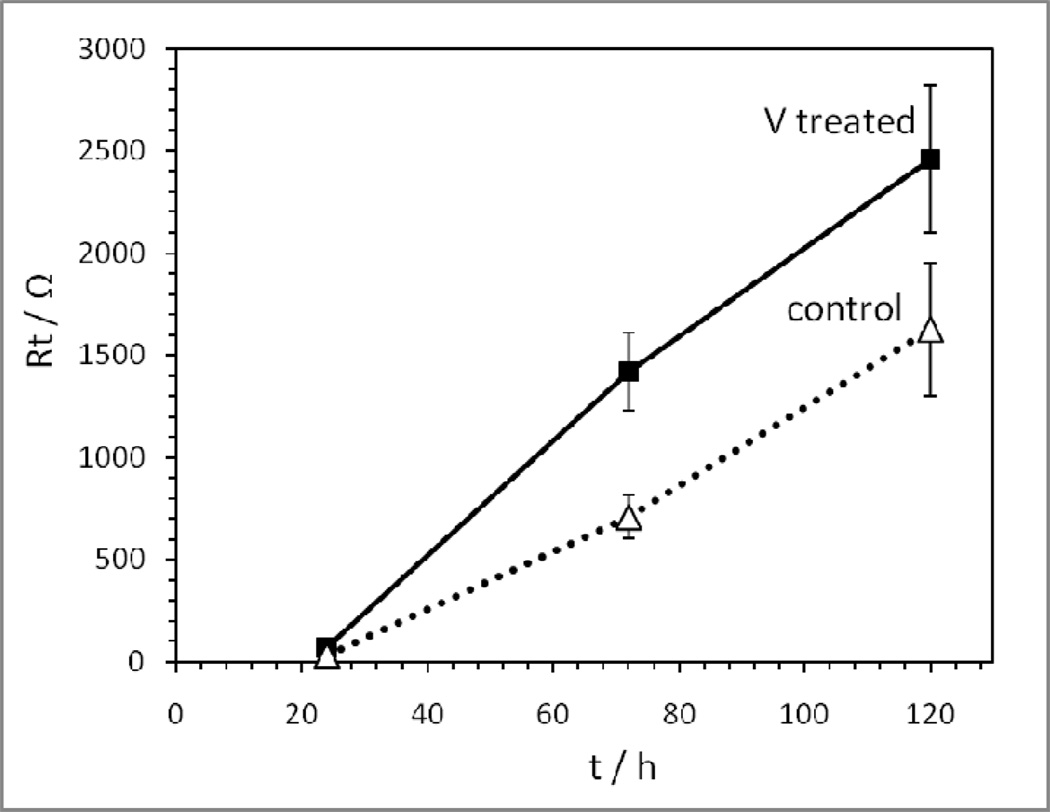
In order to quantify the cell resistance, the AC impedance data were fit to a simple equivalent circuit model (Figure 7). The model consisted of a resistor, Rs, in series with two parallel combinations of a constant phase element, CPE and a resistor, Rp, where the first CPE and Rp were labeled as CPE1 and R1, and the second CPE and Rp were labeled as CPE2 and R2. For the circuit fits the weighted sum of the squares ranged from 0.004 to 0.089. Rt was calculated by adding Rs, R1 and R2. The calculated Rt (ohms) was then plotted versus storage time for the two groups of cells (Figure 8). Each data point denotes the mean value of three samples with error bars representative of the standard error. After 120 hours of storage the cells with V-treated anodes had an average of ~1.5 times the total resistance of the control cells. Measurements taken at 24 hours and 72 hours of storage time similarly displayed a higher total resistance for the V-treated cells.
Figure 7.
Equivalent circuit model used to fit AC impedance data
Figure 8.
Total resistance (Rt) as a function of time for cells containing fresh lithium anodes (control) and V-treated Li anodes
3.4 Pulse test of Control and V-Treated Li-SVPO Cells
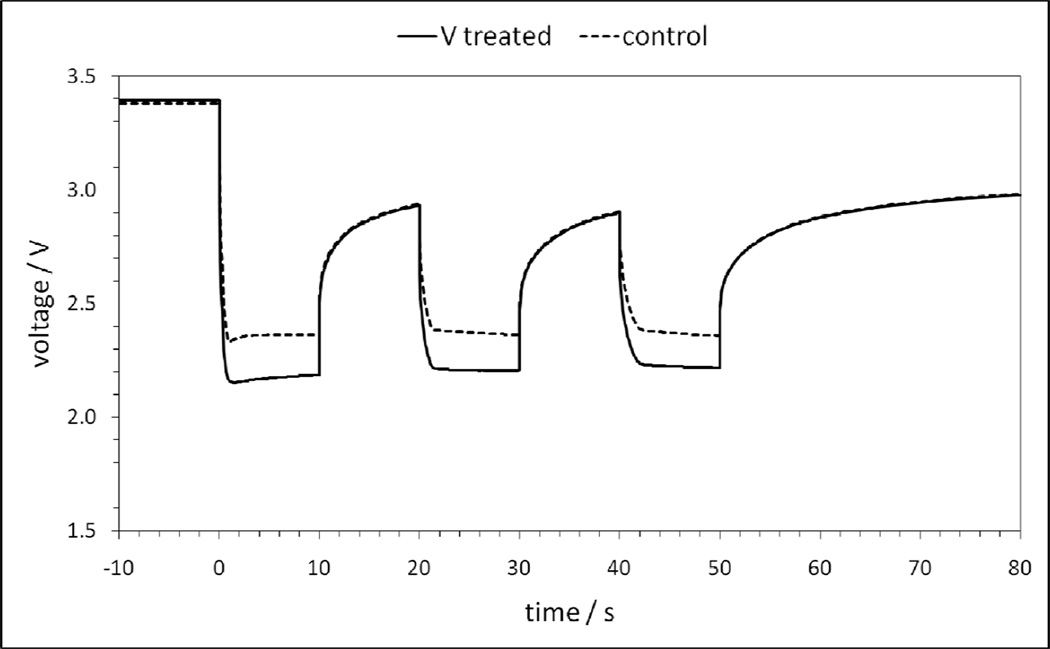
In order to interrogate the impact on V-treatment of the anode on cell performance, pulse tests of coin type experimental Li/SVPO cells with fresh lithium metal anodes and V-treated anodes were conducted. The cells were tested by application of a pulse train of three ten second pulses in a row where each pulse at a current density of 20 mA cm−2 was followed by 10 seconds of rest at open circuit voltage. Representative data of a cell from each group is shown to illustrate the impact of V-treated lithium metal anodes when compared to fresh lithium metal anodes (Figure 9). The cells with the fresh lithium metal anodes consistently show higher operating voltage under pulse. The DC resistance of each cell was calculated from the pulse data where the calculated resistance of the cell using the fresh lithium anodes for each pulse was 39, 22 and 20 ohms. The calculated resistance of the V-treated anode cell was 45, 27 and 25 ohms. Thus, there was a 15% to 26% increase in calculated cell DC resistance for the cells with the V-treated anodes compared to the control cells.
Figure 9.
Voltage response of Li/SVPO cells during application of three 10 second pulses for fresh lithium anodes (control) and V-treated Li anodes.
The results from the AC impedance experiments and the cell pulse test results may be used in conjunction with the dissolution data to support our hypothesis that silver vanadium phosphorous oxide, Ag2VO2PO4, cathode materials will exhibit reduced cell resistance due to anode passivation resulting from vanadium dissolution compared to SVO, Ag2V4O11. SVO dissolved approximately 5 times more vanadium than SVPO, with the dissolution occurring at a faster rate. In consequence, the quantity of V deposited on the lithium anode would be expected to be lower in electrochemical cells having SVPO cathodes compared to those containing SVO. Less significant V deposition on the lithium anode surface should result in lower cell resistance and improved electrochemical performance for SVPO cells relative to SVO cells.
4. Summary
Vanadium dissolution studies of SVPO, Ag2VO2PO4, and SVO, Ag2V4O11, in electrolyte solutions were conducted. The equilibrium solubility of the vanadium component of SVO was found to be approximately 5 times greater than that of SVPO, with a rate constant of dissolution approximately 3.5 times greater than SVPO. Good correlations of the data with the Noyes-Whitney equation support describing vanadium dissolution of SVO and SVPO using a diffusion layer model. AC impedance of Li-Li cells and pulse tests of Li/SVPO cells with V-treated anodes compared to control anodes was conducted affirming higher impedance and cell resistance for the V-treated anode cells. These data support the premise that the SVPO based cells are likely to show improved performance and to be less affected by increased cell resistance due to cathode solubility compared to SVO based cells.
Supplementary Material
Figure S1. XRD of silver vanadium phosphorous oxide (SVPO), Ag2VO2PO4, comparison with PDF#97-007-3580.
Figure S2. XRD of silver vanadium oxide (SVO), Ag2V4O11, comparison with PDF#.
Figure S3. DSC of SVPO.
Figure S4. DSC of SVO.
The first vanadium dissolution studies of SVPO in battery electrolyte solutions are described. The equilibrium solubility of SVPO was ~5 times less than that of silver vanadium oxide, SVO. These techniques establish a paradigm for other systems where solubility may be an issue.
Acknowledgements
The authors acknowledge financial support for the material preparation, material characterization, and cathode solubility studies from the National Institutes of Health under Grant 1R01HL093044-01A1 from the National Heart, Lung, and Blood Institute. The authors acknowledge support for the AC impedance spectroscopy studies from the Department of Energy, Office of Basic Energy Sciences, Division of Materials Science, grant DE-SC0002460.
Footnotes
Publisher's Disclaimer: This is a PDF file of an unedited manuscript that has been accepted for publication. As a service to our customers we are providing this early version of the manuscript. The manuscript will undergo copyediting, typesetting, and review of the resulting proof before it is published in its final citable form. Please note that during the production process errors may be discovered which could affect the content, and all legal disclaimers that apply to the journal pertain.
References
- 1.Bock DC, Marschilok AC, Takeuchi KJ, Takeuchi ES. Electrochim. Acta. doi: 10.1016/j.electacta.2012.03.057. (in press) [DOI] [PMC free article] [PubMed] [Google Scholar]
- 2.Takeuchi ES. J. Power Sources. 1995;54:115–119. [Google Scholar]
- 3.Takeuchi ES, Leising RA. MRS Bulletin. 2002;27:624–627. [Google Scholar]
- 4.Takeuchi KJ, Marschilok AC, Davis SM, Leising RA, Takeuchi ES. Coordination Chemistry Reviews. 2001;219-221:283–310. [Google Scholar]
- 5.Takeuchi KJ, Marschilok AC, Takeuchi ES. Preparation, characterization, and battery applications of silver vanadium oxide materials. In: Tracey AS, Willsky GR, Takeuchi ES, editors. Vanadium: Chemistry, Biochemistry, Pharmacology and Practical Applications. Taylor and Francis: New York; 2007. [Google Scholar]
- 6.Takeuchi ES, Takeuchi KJ, Marschilok AC. PRIMARY BATTERIES – NONAQUEOUS SYSTEMS | Lithium–Vanadium/Silver Oxides. In: Jürgen G, editor. Encyclopedia of Electrochemical Power Sources, Elsevier, Amsterdam. 2009. pp. 100–110. Editor-in-Chief. [Google Scholar]
- 7.Marschilok AC, Takeuchi KJ, Takeuchi ES. Electrochem. Solid-State Lett. 2008;12:A5–A9. [Google Scholar]
- 8.Takeuchi ES, Marschilok AC, Tanzil K, Kozarsky ES, Zhu S, Takeuchi KJ. Chem. Mater. 2009;21:4934–4939. doi: 10.1021/cm902102k. [DOI] [PMC free article] [PubMed] [Google Scholar]
- 9.Marschilok AC, Kozarsky ES, Tanzil K, Zhu S, Takeuchi KJ, Takeuchi ES. J. Power Sources. 2010;195:6839–6846. doi: 10.1016/j.jpowsour.2010.04.033. [DOI] [PMC free article] [PubMed] [Google Scholar]
- 10.Zhu S, Marschilok AC, Lee C-Y, Takeuchi ES, Takeuchi KJ. Electrochem. Solid-State Lett. 2010;13:A98–A100. [Google Scholar]
- 11.Kim YJ, Lee C-Y, Marschilok AC, Takeuchi KJ, Takeuchi ES. J. Power Sources. 2011;196:3325–3330. doi: 10.1016/j.jpowsour.2010.11.144. [DOI] [PMC free article] [PubMed] [Google Scholar]
- 12.Kim YJ, Marschilok AC, Takeuchi KJ, Takeuchi ES. J. Power Sources. 2011;196:6781–6787. doi: 10.1016/j.jpowsour.2010.10.054. [DOI] [PMC free article] [PubMed] [Google Scholar]
- 13.Patridge CJ, Jaye C, Abtew TA, Ravel B, Fischer DA, Marschilok AC, Zhang P, Takeuchi KJ, Takeuchi ES, Banerjee S. J. Phys. Chem. C. 2011;115:14437–14447. [Google Scholar]
- 14.Farley KE, Marschilok AC, Takeuchi ES, Takeuchi KJ. Electrochem. Solid-State Lett. 2012;15:A23–A27. [Google Scholar]
- 15.Gomadam PM, Brown JR, Scott ER, Schmidt CL. ECS Transactions. 2007;6:15–23. [Google Scholar]
- 16.Amatucci GG, Tarascon JM, Klein LC. Solid State Ionics. 1996;83:167–173. [Google Scholar]
- 17.Aurbach D, Markovsky B, Rodkin A, Levi E, Cohen YS, Kim HJ, Schmidt M. Electrochim. Acta. 2002;47:4291–4306. [Google Scholar]
- 18.Markevich E, Salitra G, Aurbach D. Electrochem. Commun. 2005;7:1298–1304. [Google Scholar]
- 19.Jang DH, Shin YJ, Oh SM. J. Electrochem. Soc. 1996;143:2204–2211. [Google Scholar]
- 20.Jang DH, Oh SM. J. Electrochem. Soc. 1997;144:3342–3348. [Google Scholar]
- 21.Aoshima T, Okahara K, Kiyohara C, Shizuka K. J. Power Sources. 2001;97-98:377–380. [Google Scholar]
- 22.Lu C-H, Lin S-W. J. Mater. Res. 2002;17:1476–1481. [Google Scholar]
- 23.Wang H-C, Lu C-H. J. Power Sources. 2003;119-121:738–742. [Google Scholar]
- 24.Iltchev N, Chen Y, Okada S, Yamaki J-i. J. Power Sources. 2003;119-121:749–754. [Google Scholar]
- 25.Choi W, Manthiram A. J. Electrochem. Soc. 2006;153:A1760–A1764. [Google Scholar]
- 26.Koltypin M, Aurbach D, Nazar L, Ellis B. Electrochem. Solid-State Lett. 2007;10:A40–A44. [Google Scholar]
- 27.Root MJ. J. Electrochem. Soc. 2011;158:A1347–A1353. [Google Scholar]
- 28.MacKay KM, MacKay RA, Henderson W. Introduction to Modern Inorganic Chemistry. 6th ed. Cheltenham, U.K.: Nelson Thornes, Ltd.; 2002. [Google Scholar]
- 29.Ellis BL, Lee KT, Nazar LF. Chem. Mater. 2010;22:691–714. [Google Scholar]
- 30.Hautier G, Jain A, Ong SP, Kang B, Moore C, Doe R, Ceder G. Chem. Mater. 2011;23:3495–3508. [Google Scholar]
- 31.Padhi AK, Nanjundaswamy KS, Goodenough JB. Journal of the Electrochemical Society. 1997;144:1188–1194. [Google Scholar]
- 32.Kim D-H, Kim J. Electrochem. Solid-State Lett. 2006;9:A439–A442. [Google Scholar]
- 33.Blyr A, Sigala C, Amatucci G, Guyomard D, Chabre Y, Tarascon J-M. J. Electrochem. Soc. 1998;145:194–209. [Google Scholar]
- 34.Park J, Seo JH, Plett G, Lu W, Sastry AM. Electrochem. Solid State Lett. 2011;14:A14–A18. [Google Scholar]
- 35.Yang L, Takahashi M, Wang B. Electrochimica Acta. 2006;51:3228–3234. [Google Scholar]
- 36.Kang HY, Wang SL, Tsai PP, Lii KH. Journal of the Chemical Society, Dalton Transactions: Inorganic Chemistry (1972-1999) 1993:1525–1528. [Google Scholar]
- 37.Leising RA, Takeuchi ES. Chemistry of Materials. 1993;5:738–742. [Google Scholar]
- 38.Onoda M, Kanbe K. Journal of Physics: Condensed Matter. 2001;13:6675–6685. [Google Scholar]
- 39.Linden D, Reddy TB. Lithium Batteries. In: Linden D, Reddy TB, editors. Handbook of Batteries. New York: McGraw-Hill; 2002. [Google Scholar]
- 40.Noyes AA, Whitney WR. Journal of the American Chemical Society. 1897;19:930–934. [Google Scholar]
- 41.Dokoumetzidis A, Macheras P. International Journal of Pharmaceutics. 2006;321:1–11. doi: 10.1016/j.ijpharm.2006.07.011. [DOI] [PubMed] [Google Scholar]
Associated Data
This section collects any data citations, data availability statements, or supplementary materials included in this article.
Supplementary Materials
Figure S1. XRD of silver vanadium phosphorous oxide (SVPO), Ag2VO2PO4, comparison with PDF#97-007-3580.
Figure S2. XRD of silver vanadium oxide (SVO), Ag2V4O11, comparison with PDF#.
Figure S3. DSC of SVPO.
Figure S4. DSC of SVO.


