Abstract
Ecosystem-level impacts of two hurricane seasons were compared several years after the storms in the largest lagoonal estuary in the U.S., the Albemarle–Pamlico Estuarine System. A segmented linear regression flow model was developed to compare mass-water transport and nutrient loadings to a major artery, the Neuse River Estuary (NRE), and to estimate mean annual versus storm-related volume delivery to the NRE and Pamlico Sound. Significantly less water volume was delivered by Hurricane Fran (1996), but massive fish kills occurred in association with severe dissolved oxygen deficits and high contaminant loadings (total nitrogen, total phosphorus, suspended solids, and fecal bacteria). The high water volume of the second hurricane season (Hurricanes Dennis, Floyd, and Irene in 1999) delivered generally comparable but more dilute contaminant loads, and no major fish kills were reported. There were no discernable long-term adverse impacts on water quality. Populations of undesirable organisms, such as toxic dinoflagellates, were displaced down-estuary to habitats less conducive for growth. The response of fisheries was species-dependent: there was no apparent impact of the hurricanes on commercial landings of bivalve molluscs or shrimp. In contrast, interacting effects of hurricane floodwaters in 1999 and intensive fishing pressure led to striking reductions in blue crabs. Overall, the data support the premise that, in shallow estuaries frequently disturbed by hurricanes, there can be relatively rapid recovery in water quality and biota, and benefit from the scouring activity of these storms.
Keywords: estuaries, fisheries, resilience, volume delivery, water quality
Over the past 100 years, more severe storms have struck the U.S. Atlantic coast than anywhere else on Earth, with North Carolina second only to Florida in the number of major storms that have made landfall (www.nhc.noaa.gov). Half of the area used as nurseries by fish from Maine to Florida is provided by the Albemarle–Pamlico Estuarine System in North Carolina and Virginia, the largest lagoonal system on the U.S. mainland (1). In the late 1990s, the Albemarle–Pamlico sustained impacts from several major storms (2, 3). The first of these, Hurricane Fran, occurred in September 1996. More substantial long-term impacts on this ecosystem were predicted after Hurricane Floyd in mid-September 1999, with heavier rains and higher-volume runoff (4). Floyd was rated as a 100-year storm that, because of drainage changes from development, caused a 500-year flood in some areas of the Neuse basin (3). It followed Hurricane Dennis, and preceded by a month Hurricane Irene, which passed near the coast in mid-October 1999 (5). The Albemarle–Pamlico sustained nearly 30 hurricanes in the past ≈100 years (www.nhc.noaa.gov). Stream ecosystem communities are known to be resilient to repeated flooding/scouring effects from major storms (6). It has been hypothesized that estuaries, with many highly mobile species in a frequently changing environment dominated by strong aperiodic physical forces, are also resilient ecosystems (7). Beyond acute, short-term adverse impacts of hurricanes on estuaries, however, little is known about the extent to which shallow, poorly flushed, hurricane-prone estuaries may be resilient to repeated major flooding events.
We compared the impacts of these two major storm periods, Fran (1996) and Dennis/Floyd/Irene (1999), on the Neuse River Estuary (NRE) and western Pamlico Sound (WPS). Our objectives were to (i) compare mean annual and storm-related mass-water transport, fill deliveries, and nutrient loads to the NRE; (ii) reassess the theoretical flushing rate of Pamlico Sound based on recently derived volume estimates, and compare volume delivery data from hurricane and nonhurricane periods; and (iii) assess short-and long-term ecosystem responses after several years.
Methods
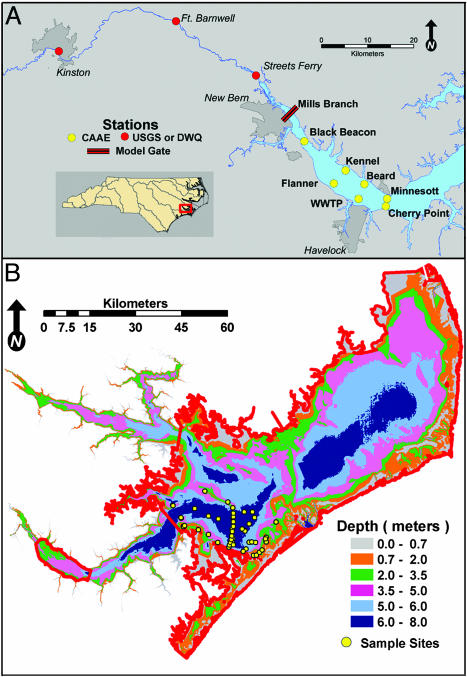
Study Area. The NRE and Pamlico Sound are shallow (mean Sound depth, 3.6 m) and wind-mixed with little tidal influence (1, 2) (Fig. 1). Above the narrows at Minnesott Beach–Cherry Point, the NRE has sustained frequent hypoxia, algal blooms, and fish kills (refs. 1 and 8–10, and www.esb.enr.state.nc.us). Less information is available on the Pamlico Sound ecosystem, which is generally described as having good water quality in comparison to the NRE (1).
Fig. 1.
The study area. (A) The Neuse River and Estuary, showing USGS flow stations, the Mills Branch gate (generally the oligohaline edge of the estuary) for the flow model, and sampling sites. (B) Geographic information system–triangular irregular network (GIS–TIN) boundaries (red) and bathymetry of the mesohaline NRE (Black Beacon to Minnesott Beach/Cherry Point) and Pamlico Sound (northern boundary truncated at the mouth of Roanoke Sound), and sampling sites in the western Sound.
Flow Model. A segmented linear-regression flow model was developed to improve accuracy in estimates of mass water transport to the NRE, and to provide a standard means of comparing the two storm periods (see supporting information, which is published on the PNAS web site). Nonlinear regression was used to fit the model to predict flow as a function of the measured flow at the U.S. Geological Survey (USGS) station in Kinston. The model was calibrated with flow data from Mills Branch (Fig. 1), collected by using an acoustic Doppler current profiler (9, 11). Mills Branch was used as the model gate (Fig. 1A) because it is located near the estuary's oligohaline edge during average-precipitation conditions (12), and was more inclusive of upstream hydrologic contributions than gauging stations (Fig. 1A) that historically have been used (especially the Kinston USGS gauging station, located ≈70 km upstream from Mills Branch) for regulatory-based assessments of nutrient loadings to the NRE (12–15). The model involved two linear components (r2 = 0.91) with the point of intersection estimated by nonlinear least squares, and with a flow breakpoint at 155 m3·s-1. Intervals of 36 and 75 days after landfall of Fran and Dennis were used to compare short-term impacts of the two hurricane seasons on water quality and biota.
Morphometry, Basin Volumes, Volume Delivered, and Flushing. The morphometry and flushing of the Albemarle–Pamlico had been generally characterized (2, 3, 16). The volume of Pamlico Sound had been estimated (26 × 109 m3), but without clear specification of spatial boundaries (16). Here, data from National Oceanographic and Atmospheric Administration (NOAA) (http://cads.nos.noaa.gov) were used to estimate volumes for the NRE study area and Pamlico Sound (Fig. 1). The boundaries and bathymetric data layer, established at mean low water, were input to geographic information system (GIS) to create a triangular irregular network (TIN) (http://cads.nos.noaa.gov) of the defined NRE and Pamlico Sound receiving basins. GIS–TIN volume estimates and USGS (http://waterdata.usgs.gov/nc/nwis/inventory) water input data (including input from the Roanoke River and Albemarle Sound into Pamlico Sound) were used to estimate turnover for the defined receiving basins.
Net precipitation delivery estimates were calculated for the storm periods and the annual mean in nonhurricane years (www.nc-climate.ncsu.edu) by using evaporation data from the National Climatic Data Center (Aurora, NC) and an average pan evaporation value of 0.7 (17). Freshwater delivery to the NRE was based on the model estimates. Volume delivery to the Sound was based on USGS flow-gauged data (http://waterdata.usgs.gov/nc/nwis/inventory) (70%) and USGS estimates for downstream and Sound surface deposition (30%). Flushing rates (turnover times) were calculated as each basin volume divided by the volume delivered for each storm period.
Water Quality. A comprehensive data set from 18 stations, sampled weekly to biweekly for ≈40 variables by the Center for Applied Aquatic Ecology since 1994, and other available data (see supporting information) were used to characterize pre- and postlandfall conditions in the NRE (see ref. 9 for methods). Data for Pamlico Sound before the 1999 storms are sparse: we had sampled three stations near the mouth of the NRE in July 1998, and data from several student training exercises in 1998–1999 were available from other sources (4). We collected data in WPS in October to November 1999, and during summer–fall cruises in 2000–2002. Total nitrogen (TN) and total phosphorus (TP) loadings to the NRE were calculated by using data collected adjacent to and upstream from Mills Branch (Fig. 1). Values were linearly interpolated across dates (n = 3 and 8 poststorm dates in September to November 1996 and September to December 1999, respectively).
Fisheries Abundance and Trends in Landings. Commercially important benthic, sessile shellfish in the study area (Crassostrea virginica, Mercenaria mercenaria) mostly occur in the lower NRE and WPS (18). Commercial landings of these organisms, shrimp (Farfantepenaeus aztecus, Farfantepenaeus duorarum, Litopenaeus setiferus), and finfish were assessed before and after the 1996 and 1999 hurricane periods by using fishery-dependent data of North Carolina Division of Marine Fisheries (18). More detailed fisheries-dependent and -independent data were available on the most important North Carolina commercial fishery, blue crab (Callinectes sapidus). Distribution and abundance patterns of early juvenile blue crabs were quantified over time to determine rates of juvenile loss or gain (refs. 19–22; see supporting information). Eight cohorts (two per year, from 1996 to 1999) were examined for patterns indicative of postsettlement pelagic dispersal of juveniles. To assess whether this dispersal occurred mostly during major storms, we examined the number of tropical cyclones that occurred during cohort sampling periods (Cohort 1, August to September; Cohort 2, September to October) versus the percentage of sites in the Sound region with abundance patterns indicative of postsettlement pelagic dispersal (20).
Results
Precipitation and Net Freshwater Delivery. About 20 cm of rain fell in the Neuse watershed during Fran, versus >50 cm during Dennis/Floyd/Irene. The Neuse flow maximum from Fran (1996) occurred 11 days after landfall at Kinston–Mills Branch (Fig. 1); after 31 days, flow had declined to within 30% of prestorm conditions (http://waterdata.usgs.gov/nc/nwis/inventory). Additional rainfall (5.2 cm) from tropical storm Josephine, and a 2-week controlled release of 212 m3/s of water in the upper watershed (initiated September 10, 1996), caused a secondary flow surge (3, 23). In contrast, the flow maximum from the 1999 hurricanes occurred 8 days after Floyd landfall. Almost twice as much rain was delivered during the 75-day postlandfall period in 1999 (including a secondary maximum from Irene) than during the same period after Fran (Table 1). Comparison of net precipitation and discharge estimates indicated that ≈75% (1996) and 59% (1999) of the net precipitation to the Neuse watershed during the 75-day poststorm periods passed the model gate (Table 1). The differential between net precipitation and discharge consisted of precipitation that occurred below that point (≈15% of the watershed) and was retained in impoundments, taken up by terrestrial vegetation, or lost to groundwater and evaporation.
Table 1. Net precipitation to the Neuse watershed and discharge (mass water transport at Mills Branch), number of fill volumes, and estimated nutrient load to the NRE study area.
| Event | Period, days | Net precipitation delivery, 109 m3 | Discharge (Mills Branch), 109 m3 | Fill volumes to estuary | TN loading, 106 kg | TP loading, 106 kg | |||||
|---|---|---|---|---|---|---|---|---|---|---|---|
| Fran | 36 | 3.47 | 25% | 1.78 | 25% | 4.7 | 20% | 2.75 | 32% | 0.50 | 55% |
| Floyd | 36 | 6.05 | 44% | 2.72 | 39% | 7.2 | 31% | 2.35 | 28% | 0.48 | 53% |
| Fran | 75 | 3.51 | 26% | 2.66 | 38% | 7.0 | 30% | 3.73 | 44% | 0.58 | 64% |
| Floyd | 75 | 6.58 | 48% | 3.90 | 56% | 10.3 | 45% | 3.64 | 43% | 0.65 | 71% |
Data are from the 36- and 75- day (September 6 to October 11 and September 6 to November 19, respectively) posthurricane periods in 1996 (Fran) and 1999 (Dennis, Floyd, and Irene). The second number in each column represents the percentage of the mean annual (1993—2002) for the variable indicated.
Morphometry and Delivery Volumes to the NRE and Pamlico Sound. The volume estimated for the NRE study area, as delineated in Fig. 1A, is 3 × 10⁸ m3. The average fill volume delivery time is 15.6 days, yielding ≈23 fill volumes per nonhurricane year. Fran and Dennis/Floyd/Irene delivered enough volume to fill the delineated NRE (Fig. 1) 7.0 and 10.3 times, respectively (Table 1). The estimated basin volume of Pamlico Sound (using the boundary delineation in Fig. 1B) is 16.9 × 10⁹ m3. From this revised volume estimate and a mean annual freshwater input of 28.5 × 10⁹ m3 (3), the estimated annual turnover of the Sound is 1.7, which is more rapid than previously estimated (≈1.1 turnovers per year, refs. 2, 3, and 16). Based on data from USGS gauging stations initiated after Fran (3), Dennis/Floyd/Irene delivered enough volume to fill the Sound 1.28 times.
Water Quality. Major storms add organic loading to the Neuse from wastewater treatment plant bypasses, leakage and runoff from animal waste facilities, cropland inundation, flooding of underground storage tanks, and other sources (2). For more than 2 weeks after Fran landfall, conditions in the Neuse River/upper NRE were anoxic, with dissolved oxygen (DO) at 0.58 ± 0.06 mg/liter (mean ± 1 SE, n = 35) along a 70-km normally freshwater segment from Kinston to Mills Branch. DO had recovered to >4 mg/liter in that segment at 6 weeks after Fran. The same area sustained milder hypoxia after Floyd, with 2.79 ± 0.06 mg of DO per liter in the first 2 weeks and 3.90 ± 0.04 mg of DO per liter at 6 weeks. Thereafter, DO recovered to >5 mg/liter.
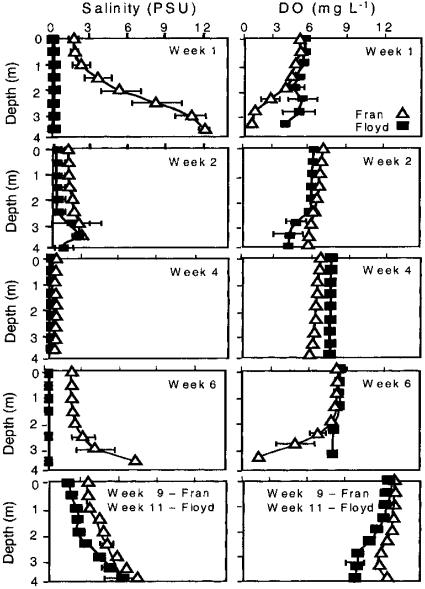
In the upper to mid-NRE 1 week after the flow maximum of Fran at Kinston, the halocline persisted and the lower water column was hypoxic (Fig. 2) from salinity stratification and organic matter deposited by floodwaters. At 2 weeks after Fran, the halocline was disrupted, but redeveloped in 6 weeks along with bottom-water hypoxia. In contrast, the halocline was rapidly disrupted after Floyd by mixing from the greater influx of fresh water (Fig. 2), and did not reestablish for 11 weeks except in a narrow area along the north shore. DO was depressed to 4.4 ± 1.1 mg/liter (n = 4 accessible sites) for ≈2 weeks after Floyd. Bottom-water salinities remained below seasonal averages (9) into the following spring (4).
Fig. 2.
Depth profiles of salinity and DO in the NRE study area (Fig. 1) at weeks 1, 2, 4, 6, and 9 (Fran) or 11 (Floyd) after storm (means ± 1 SE, n = 6 sites).
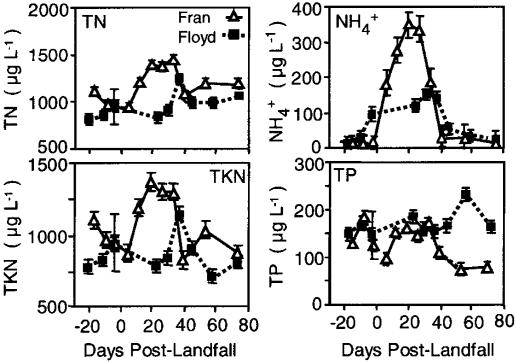
The river and oligohaline NRE (Kinston to Mills Branch) after Fran had high levels of suspended solids (SS) (16.6 ± 1.2 mg/liter), TP (353 ± 21 μg/liter), and total organic nitrogen (TON) (1,515 ± 40 μg/liter) (n = 11–12 stations). These parameters were much lower after Floyd (5.5 ± 1.0 mg of SS per liter, n = 18; 165 ± 9 μg of TP per liter, n = 11; and 710 ± 25 μg of TON per liter; n = 17–21). Inorganic nitrogen consisted almost entirely of ammonium in the anoxic river after Fran (195 ± 10 μg of  per liter, maximum 350 μg/liter versus 1.3 ± 0.6 μg of
  per liter, maximum <10 μg/liter; n = 18). Much of the TN was organic (Fig. 3), which would have exacerbated the extensive riverine anoxia. In contrast, low
  and
and  (55 ± 5 μg of
  per liter; 85 ± 50 μg of
  per liter, maximum of 150 μg of
  per liter; n = 17) occurred in the river and estuary after the 1999 storms. Overall, despite the massive volume delivered to the NRE by the 1999 storms relative to Fran, TN and TP loads from the two storm periods were comparable at the model gate (Table 1). This finding is supported by other research showing comparable TN loading to the freshwater Neuse above Kinston (2).
Fig. 3.
TN,  , total Kjeldähl nitrogen, and TP before and 75 days after Fran and Dennis/Floyd/Irene (“Floyd”) (means ± 1 SE; n = 6 sites on 11 and 8 dates in 1996 and 1999, respectively).
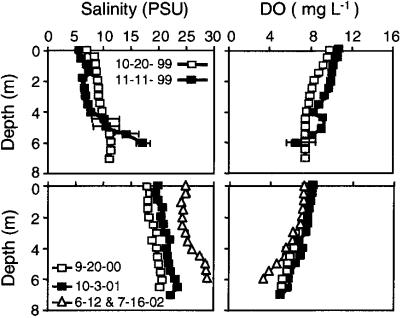
In WPS, salinity was 18–25 practical salinity units (psu) and 19–29 psu in surface and bottom waters, respectively, during nonhurricane years (2000–2002), but decreased to 5–9 psu and 10–16 psu, respectively, after the 1999 hurricanes (Fig. 4). Salinities remained below seasonal norms into the following spring (4). DO profiles at 4 and 7 weeks after Floyd were similar to those in autumn of nonhurricane years (Fig. 4). As the floodwater plume moved through the NRE into WPS, some of the pollutant load likely was deposited in bottom sediments or the submerged floodplain, and the remainder was highly diluted. At 4 weeks after Floyd landfall, SS and organic nitrogen levels in WPS were similar to those in the NRE (9.9 ± 0.9 mg of SS per liter and 790 ± 40 μg of TON per liter; n = 6 sites), whereas total inorganic nitrogen (TNi) (54 ± 19 μg/liter, with ≤ 22 μg of  per liter) and TP (65 ± 3 μg/liter) were 3-fold lower. At 7 weeks after Floyd landfall (n = 11 sites), SS and TON had declined (5.3 ± 0.5 μg/liter and 650 ± 35 μg/liter, respectively). Nitrate remained elevated (24 ± 13 μg/liter), influenced by three sites spanning the mouth of the NRE; excluding those sites,
  in WPS was low (2.8 ± 1.7 μg/liter; n = 8). SS and analyzed nutrients other than
  were within the range observed in 1998 and in the 3-year period after the 1999 storms (e.g., 4.8–11.4 mg of SS per liter, 40–65 μg of TP per liter, 35–49 μg of TNi per liter).
Fig. 4.
Depth profiles of salinity and DO in WPS ≈4 and 7 weeks after Hurricane Floyd landfall (Upper), in autumn 2001, and in summer–autumn 2000–2002 (Lower) (n = 14–15 sites).
Biota. In the anoxic 70-km freshwater Neuse segment from Kinston to New Bern 2 weeks after Fran, fecal coliforms ranged from 20 to >2,000 colony-forming units (CFU) per 100 ml after landfall (mean ± 1 SE, 750 ± 230 CFU per 100 ml, n = 9, September 17–18, 1996). Enterococci were at 70–600 CFU per 100 ml (300 ± 65 CFU per 100 ml); and fecal streptococci ranged from 310 to 1,900 CFU per 100 ml (865 ± 185 CFU per 100 ml), indicative of degraded conditions (24). Data on fecal bacteria were not available until 4 weeks after Floyd. At ≈4 and 8 weeks after Floyd landfall, fecal coliforms were relatively low in the river and estuary (<230 CFU per 100 ml) except for two freshwater sites (1,900 ± 900 and 15,500 ± 1,500 CFU per 100 ml) 9 days after landfall. Fecal streptococci had declined between 4 and 8 weeks to 93 ± 13 CFU per 100 ml (n = 13 sites). In WPS, fecal coliform densities were low in both the water column and the upper 2 cm of sediments (<4 CFU per 100 ml; n = 15–16 sites; Fig. 1).
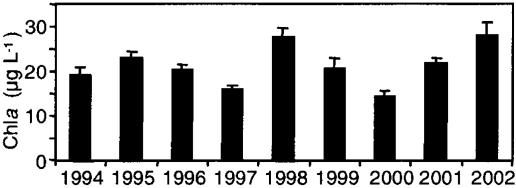
Phytoplankton biomass was depressed in the NRE for ≈6 weeks after the storms to <10 μg of chlorophyll a (chla) per liter from late September to late October 1996 and 1999, respectively), relative to nonhurricane conditions from June through October (23 ± 2 μg of chla per liter, 1994–2002; n = 6–8 sites). Suppression of phytoplankton was also evident in posthurricane years 1997 and 2000, when mean annual chla was minimal (15–16 ± 1 μg/liter) for the 9-year period (annual mean, 21 ± 2 μg/liter for nonstorm years in 1994–2002) (Fig. 5). The high volume of Floyd scoured benthic sediments from some locations in the NRE.††,‡‡ The floodwaters also removed or displaced undesirable microorganisms: for example, toxic dinoflagellates (Pfiesteria spp.) had been abundant in the upper–mid NRE before the 1999 hurricanes (10), but few suspended cells or sedimented cysts have been detected in that area since Floyd (1999–present). Most Pfiesteria populations after 1999 have occurred in the lower NRE (Fig. 6), where higher salinity, increased wind mixing, and other conditions are suboptimal for Pfiesteria growth (10).
Fig. 5.
Annual mean chla (±1 SE, n = 6–8 sites each sampled on 20–52 dates per year) in the mesohaline NRE study area (1994–2002).
Fig. 6.
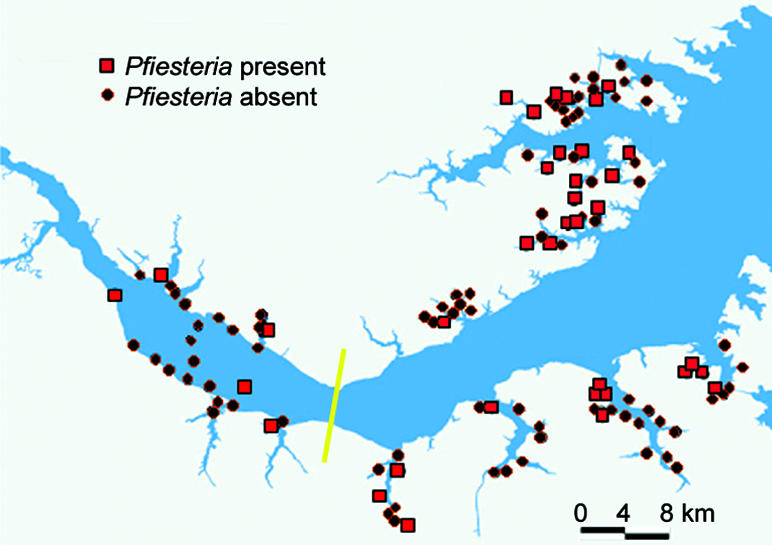
Distribution of Pfiesteria spp. in the NRE water column and sediments after the 1999 hurricanes, based on PCR data (25) and standardized fish bioassays (10) (n = 36 sites positive for Pfiesteria spp., shown in red; n = 82 sites where Pfiesteria spp. were not found, shown in black). Area left of solid line is where numerous toxic Pfiesteria outbreaks occurred from 1991 to 1998 (10), and where Pfiesteria cells were abundant in the water column and sediments of ≈90% of the area, with exception of the narrow, deeper central channel.
In WPS surface waters 8 weeks after Floyd landfall, chla was elevated (maximum, 23 μg/liter; n = 11 stations; Fig. 1). The higher poststorm chla (also reported by ref. 26: mean, 17 ± 0.1 μg/liter, n = 15 stations) reflected a small dinoflagellate bloom that may have responded to the elevated nitrate. Mean chla had been lower in the same area in 1998 (6–9 μg/liter; n = 15 stations), and 2000–2002 (mean, 5–12 μg/liter, also reported by ref. 26 except for one date in autumn 2001, when mean chla was 14 ± 1 μg/liter).
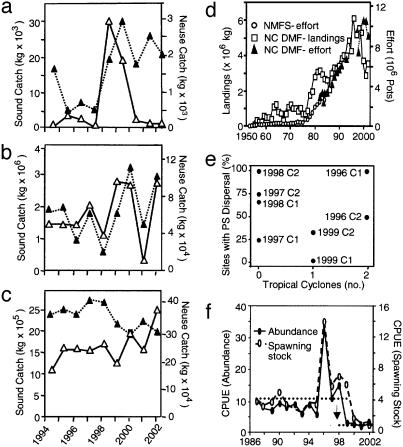
There was no apparent impact of the hurricanes on commercial landings of bivalve molluscs (Fig. 7a). The NRE bivalve catch increased in December 1998 to January 1999, followed by declines in 1999–2002 to levels comparable to those in 1994–1997. Bivalve catch in Pamlico Sound also increased beginning in 1998, relative to landings in 1995–1997 (18); however, the highest annual bivalve catch in the Sound occurred in 1999. The commercial catch of shrimp increased significantly in the Sound after storms, especially after Floyd (Fig. 7b). The largest shrimp catch in recent record occurred in 2000, followed by a decline in 2001 and high landings again in 2002. The NRE followed a similar trend, with large shrimp catches in 1999, 2000, and 2002 (18).
Fig. 7.
Shellfish and finfish. Annual commercial catch of bivalve molluscs (a), shrimp (b), and finfish (c) in Pamlico Sound (filled triangles) and the NRE (open triangles), 1994–2002 (18). (d) Fishery-dependent landings (18) and fishing effort (1953–1984, North Carolina Department of Marine Fisheries, NC DMF; 1982–2002, National Marine Fisheries Service, NMFS) for blue crabs in North Carolina (adapted from ref. 19). (e) Relationship between the number of major storms that occurred between the sampling periods of each cohort (C) of juvenile blue crabs over 4 years (C1, August to September; C2, September to October) and the percentage of sites in Pamlico Sound with evidence of postsettlement planktonic dispersal of juveniles. C1 in 1999 was the only cohort that did not show postsettlement dispersal to sites along the western shore of WPS; C2 in 1999 was the only cohort that showed secondary dispersal at an inlet (seaward) site (modified from ref. 20). (f) Fishery-independent annual mean index of abundance of blue crab adults (>126 mm carapace width) and spawning stock (mature females >126 mm carapace width) (adapted from ref. 19). Horizontal lines, average abundance before and after 1999; relative abundance, crabs per 20-min tow (catch per unit effort, CPUE, of adults); spawning stock, average of 53 trawl samples taken in September from randomly selected stations mostly in Pamlico Sound.
Fishing effort for blue crabs, measured as the number of hard crab pots, increased sharply from the 1980s to 2001 (Fig. 7d). Landings increased steadily with effort until 1996, after which they declined (Fig. 7d). Statistical analyses of fishery-dependent and -independent data in 1998 indicated that the blue crab population was being fished at or above sustainable levels (22) and, thus, was showing signs of overfishing stress before the 1999 storms. Fishery-independent data confirmed a major loss of blue crabs in 1999, coincident with substantially higher blue crab catch efficiency (370% above the historical 12-year average) that remained elevated into 2000 (19). In 1999–2002, adult abundance declined by 70%, and spawning stock (mature female crabs) declined by 72% (Fig. 7f); young-of-year and postlarvae also declined by 63% and 84%, respectively (19). The data suggest that the blue crab decline reflected intense fishing pressure as crabs migrating en masse down estuaries were aggregated by the floodwaters and carried into Pamlico Sound, where the hyperaggregated population encountered high fishing pressure (18, 19). Lack of natural recovery may be related, in part, to the unusually intense harvest of the spawning stock in 1999 and early 2000 (19).
Blue crab recruitment failure apparently was due, as well, to disruption of secondary pelagic dispersal of early juvenile crabs from initial settlement areas near inlets to the Sound by hurricane floodwaters (20). About 57% of the cohorts examined showed secondary dispersal in periods without tropical cyclones (Fig. 7e), suggesting that postsettlement planktonic dispersal was not restricted to major storms. There was a high percentage of postsettlement pelagic dispersal in 1996 between major storms. Conversely, juvenile blue crab cohorts in 1999 demonstrated the lowest percentage of sites with postsettlement dispersal.
Finfish populations were variable in poststorm trends (Fig. 7c). In the riverine segments after Fran, extensive anoxia led to major fish kills (ref. 8 and www.esb.enr.state.nc.us). By contrast, major finfish or shellfish kills in the Neuse River, NRE, or Pamlico Sound were not documented after Floyd (www.esb.enr.state.nc.us). Finfish in the Sound likely were stressed by rapidly decreased salinity and had high incidence of ulcerative disease for several weeks after Floyd, followed by a decline in disease by mid-November as typical of nonhurricane years (27, 28). Overall, there was no apparent effect of Fran on finfish landings. Commercial finfish landings decreased in the NRE after 1998, followed by an increase in 2000–2002 (Fig. 7c). In the Sound, finfish landings declined since 1998 and have remained at levels lower than before the 1999 storms.
Discussion
This study supports the hypothesis that, in shallow estuaries frequently disturbed by hurricanes, there can be relatively rapid recovery and even some long-term benefit from these storms. WPS apparently sustained relatively high nitrogen loading during the 1999 hurricane season, linked to increased phytoplankton biomass (this study and ref. 26). However, within the following year, poststorm data indicate that the Sound returned to what was described (4) as a more typical condition of low nitrogen and algal production. From a management perspective, the scouring was beneficial in reducing populations of certain undesirable microorganisms, and may also have been beneficial in transporting benthic sediments,††,‡‡ which can contain numerous contaminants (29), from some locations.
It had been postulated (4, 28) that hypoxic stress and low salinity in the lower NRE and WPS led to large losses of fish and benthic fauna after the 1999 hurricanes. Available data, considered with other studies (4, 28, 30–34), suggest instead that biota were stressed and some organisms died, but that most finfish and benthic, sessile shellfish would have survived or that populations rapidly recovered. The bottom-water hypoxia (2–3 weeks, 3–4 mg of O2 per liter, except ≤2 mg of O2 per liter in small areas) and depressed salinities (8–12 psu) in the lower NRE after Floyd would have been expected to stress, but not kill, most sessile shellfish, which have behavioral and physiological mechanisms to enable survival for extended periods in such conditions (refs. 30–33 and supporting information). Conditions generally were less severe in WPS (bottom water at ≥4 mg of O2 per liter except for one date reported by ref. 4; salinities ≥ 5 psu; our data and ref. 4). The 2000–2002 data also indicate that, except for blue crabs, fisheries impacts were not as severe or as lasting as initially feared (4, 28). We suggest that the blue crab decline beginning in 1999–2000 was caused by high densities of crabs displaced by the 1999 hurricane floodwaters and hyperaggregated in the Sound, where blue crabs confronted intensive fishing pressure (19), and by subsequent recruitment failure of early juvenile crabs (20). A strong stock-recruitment relationship for blue crabs in North Carolina waters indicates an urgent need to conserve spawning stock for long-term population persistence.
The rapid recovery of most biota that was observed in the NRE and WPS was not an isolated, river-specific response. Concurrent data on benthic fauna, dominated by polychaete worms and bivalve molluscs, from four sites in the Pamlico River Estuary show similar recovery patterns. There was a significant increase in total benthic infauna in 2000 relative to 1999 (F = 3.9, P < 0.04; M.P. and T.A., unpublished data). The major taxa involved (polychaetes Mediomastus spp., Streblospio benedicti, Maranzellaria viridis; and bivalves molluscs Macoma balthica, and Macoma mitchelli) are opportunists that can quickly recolonize after disturbance (35).
Low DO in rivers and estuaries is a common short-term aftermath of hurricanes because of loading of organic materials from natural, agricultural, and urban sources (36). Hypoxia affected the entire water column of the Neuse River, and was more extreme after Fran, which contributed less flow than the 1999 hurricane season. Floodwaters in major tributaries to the Sound crested ≈1 month or more after Floyd landfall. Acute impacts of Floyd may have been less detrimental than those from the lower-volume storm of 1996 because the larger freshet from Floyd eliminated density stratification, thereby limiting development of hypoxia. The massive floodwater diluted incoming pollutants to a greater degree and buffered the system from excessive hypoxia, high ammonia, and related adverse impacts (2), while also flushing certain harmful microorganisms and transporting benthic sediments from some areas of the estuary. An exception was higher nitrate after Floyd. The extensive riverine anoxia after Fran may have depressed nitrification; moreover, more rainfall from Floyd occurred in the lower agricultural watershed, contributing runoff high in nitrate that rapidly entered the estuary.
In summary, this study indicates that in shallow estuaries frequently disturbed by hurricane-level storms, there can be relatively rapid recovery, and that the ecological impacts may not be as damaging or as long-term as generally assumed. These events may serve essential functions of ecosystem renewal through periodic flushing of certain sensitive areas. Beyond acute adverse impacts, short- and long-term ecological benefits can be realized depending on the storm track, intensity, and rainfall distribution.
Supplementary Material
Acknowledgments
Funding support was provided by the North Carolina General Assembly and U.S. Environmental Protection Agency Grant CP-97437001 (to J.B. and H.G.) and by National Science Foundation Grants OCE 97-34472 and OCE-0221086 and North Carolina Sea Grants 99-FEG-10, 00-FEG-11, and NA46RG0087 (to D.E.).
This paper was submitted directly (Track II) to the PNAS office.
Abbreviations: NRE, Neuse River Estuary; WPS, western Pamlico Sound; USGS, U.S. Geological Survey; TN, total nitrogen; TP, total phosphorus; DO, dissolved oxygen; SS, suspended solids; TON, total organic nitrogen; chla, chlorophyll a.
Footnotes
Benninger, L. K., Wells, J. T., Alperin, M. J. & Clesceri, E. J. (2001) Proceedings of the 50th Annual Meeting of the Geological Society of America–Southeastern Section, Raleigh, NC (Geol. Soc. Am., Boulder, CO), abstract 4748 (abstr.).
Benninger, L. K., Alperin, M. J., Wells, J. T., Munoz, P., Nie, Y., Ream, B. J. & Mislowack, B.J. (2003) Proceedings of the 52nd Annual Meeting of the Geological Society of America–South-Central and Southeastern Sections, Memphis, TN (Geol. Soc. Am., Boulder, CO), abstract 49874 (abstr.).
References
- 1.Mallin, M. A., Burkholder, J. M., Cahoon, L. B. & Posey, M. H. (2000) Mar. Pollut. Bull. 41, 56-75. [Google Scholar]
- 2.Bales, J. D. (2003) Estuaries 26, 1319-1328. [Google Scholar]
- 3.Bales, J. D., Oblinger, C. J. & Sallenger, A. H. (2000) Two Months of Flooding in Eastern North Carolina, Sept.–Oct. 1999 (U.S. Geol. Surv., Raleigh, NC), Open File Report 96-499.
- 4.Paerl, H. W., Bales, J. D., Ausley, L. W., Buzzelli, C. P., Crowder, L. B., Eby, L. A., Fear, J. M., Go, M., Peierls, B. L., Richardson, T. L. & Ramus, J. S. (2001) Proc. Nat. Acad. Sci. USA 98, 5655-5660. [DOI] [PMC free article] [PubMed] [Google Scholar]
- 5.Barnes, J. (2001) North Carolina's Hurricane History (Univ. of North Carolina Press, Chapel Hill), 3rd Ed.
- 6.Yount, J. D. & Niemi, G. J. (1990) Env. Manag. 14, 547-569. [Google Scholar]
- 7.Costanza, R., Kemp, W. M. & Boynton, W. R. (1993) Ambio 22, 88-96. [Google Scholar]
- 8.Burkholder, J. M., Mallin, M. A. & Glasgow, H. B. (1999) Mar. Ecol. Prog. Ser. 179, 301-310. [Google Scholar]
- 9.Glasgow, H. B. & Burkholder, J. M. (2000) Ecol. Appl. 10, 1024-1046. [Google Scholar]
- 10.Glasgow, H. B., Burkholder, J. M., Mallin, M. A., Deamer-Melia, N. J. & Reed, R. E. (2001) Env. Health Perspect. 109, 715-730. [DOI] [PMC free article] [PubMed] [Google Scholar]
- 11.RD Instruments (1989) Acoustic Doppler Current Profilers–Principles of Operation: A Practical Primer (RD Instruments, San Diego).
- 12.Bowen, J. D. & Hieronymus, J. (2000) Neuse River Estuary Modeling and Monitoring Project Stage 1: Predictions and Uncertainty Analysis of Response to Nutrient Loading Using a Mechanistic Eutrophication Model (North Carolina State Univ., Raleigh), Report No. 325-D.
- 13.DiPiero, S. J., Rogers, B. & Hermann, R. B. (1994) Weyerhaeuser Studies on the Neuse River Assimilative Capacity (Weyerhaeuser, New Bern, NC).
- 14.Thut, R. N. (1980) Neuse River Waste Assimilation Study (Weyerhaeuser, New Bern, NC).
- 15.North Carolina Department of Environment and Natural Resources (1999) Total Maximum Daily Load for Total Nitrogen to the Neuse River Estuary, North Carolina (Department of Environment and Natural Resources, Raleigh, NC).
- 16.Giese, G. L., Wilder, H. B. & Parker, G. G. (1985) Hydrology of Major Estuaries and Sounds of North Carolina (U.S. Geol. Surv., Raleigh, NC.), Water Supply Paper 2221.
- 17.Kohler, M.A., Nordenson, T. J. & Baker, D. R. (1959) Evaporation Maps for the United States (U.S. Weather Bureau, Washington, DC), Technical Paper No. 37.
- 18.North Carolina Department of Environment and Natural Resources (1994. –2002) Landings Bulletin (Division of Marine Fisheries, Morehead City, NC).
- 19.Eggleston, D. B., Johnson, E. & Hightower, J. (2004) Population Dynamics and Stock Assessment of the Blue Crab in North Carolina (Division of Marine Fisheries, Morehead City, NC).
- 20.Etherington, L. L. & Eggleston, D. B. (2003) Can. J. Fish. Aquat. Sci. 60, 873-887. [Google Scholar]
- 21.Etherington, L. L. & Eggleston, D. B. (2000) Mar. Ecol. Prog. Ser. 204, 179-198. [Google Scholar]
- 22.Eggleston, D. B. (1998) Population Dynamics of the Blue Crab in North Carolina: Statistical Analysis of Fisheries Survey Data (Division of Marine Fisheries, Morehead City, NC).
- 23.U.S. Army Corps of Engineers (1997) Falls Lake Project-Neuse River Basin With Emphasis on the Flood Events Preceding and Related to Hurricane Fran, September 1996 (U.S. Army Corps of Engineers, Wilmington, NC).
- 24.North Carolina Department of Environment and Natural Resources (1996) Classifications and Water Quality Standards Applicable to Surface Waters of North Carolina (Department of Environment & Natural Resources, Raleigh, NC).
- 25.Oldach, D.W., Delwiche, C. F., Jakobsen, K. S., Tengs, T., Brown, E. G., Kempton, J. W., Schaefer, E. F., Bowers, H., Glasgow, H. B., Burkholder, J. M., et al. (2000) Proc. Nat. Acad. Sci. USA 97, 4304-4308. [DOI] [PMC free article] [PubMed] [Google Scholar]
- 26.Ramus, J. L., Eby, L. A., McClellan, C. M. & Crowder, L. B. (2003) Estuaries 26, 1344-1352. [Google Scholar]
- 27.Adams, S. M., Greeley, M. S., Law, J. M., Noga, E. J. & Zelikoff, J. T. (2003) Estuaries 26, 1365-1382. [Google Scholar]
- 28.Paerl, H. W., Bales, J. D., Ausley, L. W., Buzzelli, C. P., Crowder, L. B., Eby, L. A., Go, M., Peierls, B., Richardson, T. L. & Ramus, J. S. (2000) EOS 81, 457, 459, 462. [DOI] [PMC free article] [PubMed] [Google Scholar]
- 29.Hyland, J. L., Balthis, W. L., Hackney, C. T. & Posey, M. (2000) J. Aquat. Ecosystem Stress Recov. 8, 107-124. [Google Scholar]
- 30.Seitz, R. D., Marshall, L. S., Jr., Hines, A. H. & Clark, K. L. (2003) Mar. Ecol. Prog. Ser. 257, 179-188. [Google Scholar]
- 31.Borsuk, M. E., Powers, S. P. & Peterson, C. H. (2002) Can. J. Fish. Aquat. Sci. 59, 1266-1274. [Google Scholar]
- 32.Diaz, R. J. & Rosenberg, R. (1995) Oceanogr. Mar. Biol. Annu. Rev. 33, 245-303. [Google Scholar]
- 33.Grizzle, R., Shumway, S. E. & Bricelj, V. M. (2001) in The Hard Clam, Mercenaria mercenaria, eds. Kraeuter, J. N. & Castagna, M. (Elsevier, New York), pp. 305-382.
- 34.Shumway, S. E. (1996) in The Eastern Oyster, Crassostrea virginica, eds. Kennedy, V. S., Newell, R. I. E. & Elbe, A. F. (Maryland Sea Grant, College Park, MD), pp. 467-513.
- 35.Posey, M. H., Alphin, T. D., Cahoon, L. B., Lindquist, D. G., Mallin, M. A. & Nevers, M. B. (2002) Estuaries 25, 999-1014. [Google Scholar]
- 36.Mallin, M. A., Posey, M. H., McIver, M. R., Parsons, D. C., Ensign, S. H. & Alphin, T. D. (2002) BioScience 52, 999-1010. [Google Scholar]
Associated Data
This section collects any data citations, data availability statements, or supplementary materials included in this article.


