

Abstract
Using a previously developed population pharmacokinetic model, an exposure-response (ER) model was successfully developed to describe guanfacine plasma concentrations and changes in heart rate (HR) and the QT interval. Guanfacine exposure was associated with small decreases in HR and a small prolongation of the population-corrected QT (QTcP) interval. Based on the final ER model for effect of guanfacine on HR, the estimated population typical decrease in HR would be 2.3% (2.1–2.7%) of the baseline circadian HR for every 1 ng/mL of guanfacine exposure. A QTcP was developed for the analysis using the sampled population. An effect of sex on baseline-corrected QT (BQTP) was the only covariate effect in the final ER model for QTcP, its inclusion resulting in a typical baseline QTcP estimate that is 9 (5–13) ms higher for females. There was no evidence of QT-RR hysteresis. A linear model was used to relate guanfacine plasma concentrations to QTcP. The typical (95% confidence interval) slope parameter was estimated to be 0.941 (0.62–1.25) ms/ng/mL. The final model predicted an approximate 1-ms increase from baseline for every 1 ng/mL of guanfacine in plasma. The main predictor of QTcP prolongation was guanfacine exposure, which decreased with body weight and increased with dose.
Electronic supplementary material
The online version of this article (doi:10.1208/s12248-014-9645-0) contains supplementary material, which is available to authorized users.
KEY WORDS: ADHD, guanfacine, pediatric, pharmacodynamics, pharmacokinetic
INTRODUCTION
Attention deficit/hyperactivity disorder (ADHD) is a common childhood disorder characterized by symptoms of inattention, impulsivity, and hyperactivity (1). Psychostimulant medications have been used successfully to treat ADHD in children (1,2) and are considered first-line pharmacological treatment for ADHD (3). However, some children have a suboptimal response to psychostimulant monotherapy, and some may experience dose-limiting adverse effects (4–6).
Guanfacine hydrochloride is an α2-adrenergic agonist approved in 1986 for the treatment of hypertension in adults alone or in combination with thiazide therapy (7,8). More recently, an extended-release formulation of guanfacine was approved in the USA for the treatment of ADHD in children and adolescents as monotherapy or as adjunctive treatment to stimulant medications (9).
The objective of this analysis was to describe, using linear or nonlinear mixed-effects models, population and individual exposure-response (ER) relationships for guanfacine extended release effects on heart rate (HR) and cardiovascular repolarization, as measured by the HR-corrected QT interval (QTc), in children with ADHD, and to quantify the probability of clinically significant changes in QTc in relation to escalating guanfacine dosage regimens.
METHODS
Study Design
The population pharmacokinetic–pharmacodynamic (PK/PD) database was composed of data from one phase 1 and two phase 2 trials. The phase 1 trial was an open-label, dose escalation, PK study of guanfacine extended release administered to children and adolescents with ADHD in which 28 patients received a single 2-mg dose on day 1 followed by escalating dosages of 2, 3, and 4 mg/day to complete 29 days of treatment (10). HR and electrocardiogram (ECG) measurements were performed throughout the study. Twelve-lead ECGs were collected while the patient was in a quiet state and a supine position. All ECGs were read by a central lab for determination of QT interval.
The first phase 2 trial was an open-label study of guanfacine extended release in children with ADHD in which 20 patients received escalating and descending dosages of a modified-release formulation of guanfacine (1, 2, 3, and 4 mg/day), similar to the currently approved extended-release formulation (data on file). Each treatment period lasted 1 week. HR and ECG measurements were performed throughout the study. The second phase 2 study was a randomized, double-blind, placebo-controlled study of the approved formulation of guanfacine extended release conducted in children and adolescents with ADHD (11). The dosage of guanfacine extended release could be titrated from 1 to 3 mg (with 1-mg/week increments), based on assessments of the patient’s overall clinical response. HR and singlet ECG measurements were performed throughout. For the PD part of the analysis, 843 (five/patient) sets of ECG/HR measurements from 169 patients were available and included data from guanfacine-naive (placebo) patients.
These studies were approved by an ethics committee or institutional review board and conducted in accordance with the current revision of the Declaration of Helsinki.
Data Analysis
The population analyses were conducted via nonlinear mixed-effects modeling with the NONMEM software, Version V, Level 1.1 (ICON, Elicott City, MD). The first-order conditional estimation with eta-epsilon interaction (FOCEI) method in NONMEM was employed for all model runs (12). Results of the population PK analysis of guanfacine in pediatric subjects will be presented in another manuscript.
The PD endpoints evaluated in the ER analysis included HR, QT interval, and QTc interval. QTc interval data included corrections based on Bazett and Fridericia. The ER analyses were based on population PK model-predicted concentrations.
Heart Rate
Following administration of guanfacine, a decrease in HR is known to occur. A linear slope-intercept model was initially used to describe the guanfacine exposure–HR relationship. More complex linear or nonlinear models were then evaluated if suggested by the graphical evaluation or the results of the linear slope-intercept model. A model incorporating circadian rhythm was also investigated (13). Following development of the base ER model for HR, a covariate analysis was performed (see below for covariate analysis).
QTc Interval
An ER model was also developed to explore the relationship between guanfacine exposure and QTc (Bazett, Fridericia, and/or population [QTcP] corrected). A linear slope-intercept model was initially used to describe the guanfacine exposure–QTc relationship. Following the development of the base ER model for QTc, a covariate analysis was performed. Estimates of precision of the population ER QTc model parameters (e.g., asymptotic standard errors [SEs] or bootstrap 95% confidence intervals [CIs]) were generated for the final model.
QT-RR Interaction
If review of the individual QT-versus-RR plots suggested hysteresis or other QT-RR interactions not accounted for in the HR correction, an investigation of the QT-RR interaction was to be performed. The QT-RR investigation was limited to graphical evaluation.
Modeling Assumptions
All interindividual error terms were described by an exponential error model or additive error model. An attempt was made to define a full block covariance matrix for the interindividual random effects (Ω). For PD observations in this analysis, the residual error model was initially described by a combined additive and proportional error model.
Covariate Model
A covariate modeling approach emphasizing parameter estimation rather than stepwise hypothesis testing was implemented. Potential covariate–parameter relationships were prespecified and identified based on scientific interest, mechanistic plausibility, and exploratory graphics; a full model was constructed, and parameters estimated. The full model did not simultaneously include effects of correlated or collinear predictors. Covariates investigated in this analysis included sex, age, weight, and circadian rhythm, as they are all demonstrated in the literature for other similar compounds and are of clinical interest. A full model was carefully constructed to avoid inclusion of collinear or correlated covariates using the results of the graphical analysis, scientific interest, and mechanistic plausibility.
Inferences about clinical relevance of parameters were based on the resulting parameter estimates and measures of estimation precision (asymptotic SEs or bootstrap 95% CIs). This approach allows for the direct assessment of clinical relevance of covariate effects and also provides some explanation for the apparent absence of a covariate effect (true lack of an effect vs. lack of information about that effect).
For the PD analysis, it was necessary to assume that the QT-RR relationship was constant within an individual over time.
Model Evaluation
The final model and parameter estimates were investigated with a nonparametric bootstrap procedure (14,15) and a predictive check method (16). For the bootstrap procedure, a total of 1,000 replicate data sets were generated by random sampling with replacement using the individual as the sampling unit. Stratification during the random sampling process was implemented to ensure that bootstrap data sets adequately represented the original data. Population parameters for each data set were estimated using NONMEM and empirical 95% CIs were constructed from the results.
For the predictive check method, 100 Monte Carlo simulation replicates of the original data set were generated using the final population PK/PD model. Distributions of a characteristic of the simulated data were compared with the distribution of the same characteristic in the observed data set, using exploratory graphics.
Model Simulations
The full guanfacine PK model and ER model for QTcP results were used to simulate predicted QTcP at steady state following 2- or 4-mg guanfacine administration. In order to yield a more robust prediction with respect to weight and age, the demographics (weight, age, and sex) used as inputs into the simulations were taken from the Third National Health and Nutrition Examination Survey (NHANES III) database (17). Due to the effect of weight on apparent clearance (CL/F) and apparent volume of distribution (V/F) in the PK model, as well as the relationship between weight and age, there was also interest in assessing predicted QTcP in patients with low body weights in the indication range for guanfacine, typically exemplified as 6-year-old girls. For this portion of the simulation, age and sex were fixed, and weight was allowed to vary according to the median (5th, 95th percentile) weight for 6-year-old girls in the National Center for Health Statistics growth charts (18).
The scenarios simulated using the constraints defined above were a 2-mg dose in the phase 3 population, a 4-mg dose in the phase 3 population, a 2-mg dose in a population of 6-year-old girls with the weight distribution as described above, and a 4-mg dose in a population of 6-year-old girls with the weight distribution as described above. A total of 1,000 trials were simulated for each scenario and the following metrics were calculated for each simulation:
Probability of mean QTcP change from baseline of 5, 10, and 15 ms
Percentage of boys in each simulated trial with QTcP ≥450 ms
Percentage of girls in each simulated trial with QTcP ≥460 ms
Percentage of patients in each simulated trial with QTcP ≥480 ms
Percentage of patients in each simulated trial with increase in QTcP ≥10% from baseline
RESULTS
Analysis Population and Data Characteristics
The guanfacine pediatric PD database was composed of 217 patients contributing a total of 3,498 ECG measurements. Patient demographics at screening are summarized in Table I. Distributions of all continuous covariates were similar between placebo and guanfacine patients with the exception of a slightly older median age (13 vs. 12 years) in the placebo-treated group. Caucasians (68%) were the predominant race/ethnic group in the PK/PD database, accounting for more than two thirds of subjects, followed by African Americans/other (32%).
Table I.
Summary of Continuous and Categorical Covariates of Subjects in the Population PK/PD Analysis (Size and Age)
| Continuous | ||||
| Minimum | Maximum | Median | Mean | |
| Weight (kg) | 25 | 109 | 51.4 | 49.7 |
| Body mass index (kg/m2) | 13 | 34 | 19.6 | 20.3 |
| Age (year) | 6 | 17 | 13 | 12.4 |
| Body surface area (m2) | 0.924 | 2.34 | 1.5 | 1.45 |
| Categorical | ||||
| Race | Sex | |||
| Caucasian | African American/other | Female | Male | |
| Number | 147 | 70 | 64 | 153 |
| Percentage | 68 | 32 | 29 | 71 |
n = 217 for all variables
PK/PD pharmacokinetic–pharmacodynamic
Population PK/PD Modeling Results
A graphical evaluation of HR data was performed to explore the relationship between QT and RR, determine whether hysteresis existed in the QT-RR relationship, and assess the performance of HR correction factors (Bazett, Fridericia, population, and individual). Plots of QT versus RR at the baseline visit (prior to guanfacine treatment) for all patients, post baseline for guanfacine-treated patients, and post baseline for placebo-treated patients demonstrated the expected relationship between these variables; mainly, QT interval increases with lengthening of the RR interval. Individual QT-versus-RR plots did not demonstrate any consistent pattern indicative of hysteresis. Given the lack of any consistent hysteresis pattern in individual QT-versus-RR plots, no further evaluation of a QT-versus-RR hysteresis relationship was performed.
ER Model for Effect of Guanfacine on HR
Predicted guanfacine concentrations were used to develop the ER model for effect of guanfacine on HR as guanfacine concentration measurements were not collected at the same time as ECG measurements. The population PK final model was used to predict the individual-specific guanfacine concentration at the time of ECG measurement in all patients. A plot of HR versus guanfacine concentration demonstrated that there was a decrease in HR with increasing concentration (Fig. 1, upper panel). For the baseline visit, a plot of HR versus time demonstrated a slight decrease in HR over the first 12 h followed by an increase in HR over the last 12 h, indicating the presence of a circadian rhythm in the baseline HR data (Fig. 1, middle panel).
Fig. 1.
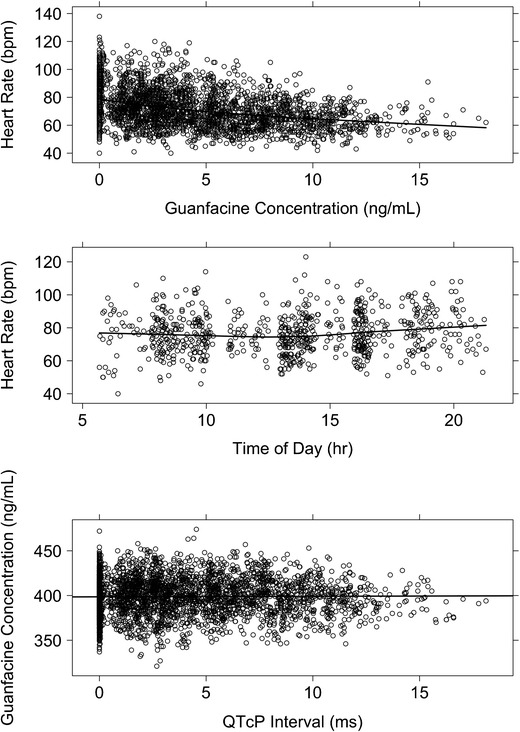
Image shows effect of guanfacine concentration on heart rate and QTcP interval and the effect of time of day on heart rate. Guanfacine concentration values (ng/mL) are plotted versus heart rate (bpm) and QTcP interval (ms), and time of day (h) is plotted versus heart rate. Values are indicated by open circles and a solid black lowess (local regression smoother) trend line through the data. Top and middle show heart rates and bottom shows QTcP interval
Based on a review of the observed data, a model was developed for the effect of guanfacine concentration on HR. Initially, baseline HR measurements (without drug) were utilized to build the model. A cosine model with 1 oscillator function provided the best fit of HR-versus-time data at baseline. This model was used as the baseline HR model and was characterized by an average HR over a 24-h cycle (HRM), the amplitude of the oscillation (AMP), and the acrophase or shift of the peak time during the cycle (ACR). Interindividual variance terms on HRM and ACR and the random residual variance were best described by an additive model. A full covariate model was then built, and individual subject-specific parameter estimates from that model were carried forward into the ER model development for guanfacine.
A linear model provided the best fit of the relationship between guanfacine concentration and HR, with an additional variance term representing the interoccasion variability on baseline HR. This model was characterized by a slope term (SLPD) representing change in HR from the circadian pattern due to guanfacine. Interindividual variance on SLPD was described by an exponential model, and interoccasion variance on HRM as well as random residual variance were described by an additive model. Diagnostic plots demonstrated a good fit to the observed data (Fig. 2, left panel, first column). However, there was a small degree of positive bias present in the weighted residuals (WRES)- and conditional residuals (CWRES)-versus-time plots (data not shown).
Fig. 2.
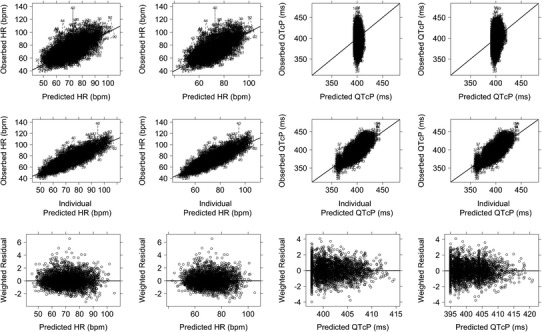
Image shows observed heart rate, QTcP interval, and weighted residuals versus population and individual predicted values. Observed heart rate values (bpm), QTcP intervals (ms), and weighted residuals are plotted versus population and individual predictions. For the observed versus predicted plots, values are indicated by individual NONMEM ID numbers with a dotted line connecting individual data points. For the weighted residual plots, values are indicated by open circles and a dotted black lowess (local regression smoother) trend line through the data. A solid black line at y = 0 is included as a reference. The line of identity (solid black) is included as a reference. Panels 1 and 2 show the HR model and panels 3 and 4 show the QTcP interval model. Base models are presented in panels 1 and 3 and final models are presented in panels 2 and 4
The circadian model portion of the final base model results (based on baseline data only) indicated that the estimated population-typical HRM (95% CI) for the reference patient (male, 12 years old) was 77.9 (75.2–80.6) beats/min with an AMP of 5.14% (1.60–8.68%) of the typical HRM and a maximum HR occurring at approximately 11:00 PM (9:00 PM–1:00 AM) each day. However, HRM and AMP were highly variable between individuals with point estimates (SD) of 77.9 (9.8) and 5.14 (2.9), respectively. The base model results (baseline + guanfacine effect) are provided in Table II. For every 1 ng/mL of guanfacine, the estimated population-typical decrease in HR would be 2.3% (2.1–2.7%) of the baseline HRM. The SLPD parameter was estimated with good precision and the 95% CI SEs did not include zero.
Table II.
Summary of Heart Rate and QTcP Population PK/PD Parameter Estimates
| Heart rate | |||
| Parameter | Fixed effect parameter (%SE) (base model) | Fixed effect parameter (%SE) (final model) | Asymptotic 95% CI |
| AMP (%) | 5.14 (IPV)a | 5.14 (IPV) | NA |
| ACR (h) | 23.1 (IPV) | 23.1 (IPV) | NA |
| HRM (beats/min) | 77.9 (IPV) | 77.9 (IPV) | NA |
| SLPD (%/ng/mL) | −2.31 | −2.34 (7%) | −2.65, −2.06 |
| *(AGE/12)θ3 | – | 0.481 (46%) | 0.00875, 0.923 |
| *θ4SEX | – | 1.14 (14%) | 0.860, 1.48 |
| Interindividual variance (%SE) | |||
| Ω1.1SLP | 0.171 (21%) SD = 0.414 | 0.134 (27%) SD = 0.366 | 0.0515, 0.197 |
| IOV (SD) | 37.4 (18%) SD = 6.11 | 36.5 (18%) SD = 6.04 | 24.3, 48.5 |
| Residual variance (%SE) | |||
| σ2 add | 55.1 (6%) SD = 7.42 | 55.5 (6%) SD = 7.45 | 50.2, 62.2 |
| QTcP | |||
| Parameter | Fixed effect parameter (%SE) | Asymptotic 95% CI | |
| BQTP (ms) | 398 (0.3%) | 395 (0.3%) | 393, 397 |
| +θ3SEX | – | 8.92 (25%) | 4.59, 13.3 |
| SLOP (ms/ng/mL) | 0.938 (17%) | 0.941 (17%) | 0.627, 1.25 |
| Interindividual variance (%SE) | |||
| Ω1.1BQTP | 223 (11%) SD = 14.9 | 206 (11%) SD = 14.4 | 164, 249 |
| Ω2.2SLOP | 0.620 (44%) SD = 0.787 | 0.659 (46%) SD = 0.812 | 0.0698, 1.25 |
| Residual variance (%SE) | |||
| σ2 add | 165 (5%) SD = 12.8 | 165 (5%) SD = 12.8 | 150, 179 |
Asymptotic 95% CI calculated from NONMEM SEs
QTcP population-corrected QT, PK/PD pharmacokinetic–pharmacodynamic, %SE percent standard error, CI confidence interval, AMP amplitude, IPV subject-specific predicted value from baseline heart rate model, NA not available, ACR acrophase, HRM average heart rate, SLPD slope term representing the change in HR from the circadian pattern due to guanfacine, IOV interoccasion variability, SD standard deviation, add additive error, BQTP intercept representing the baseline population-corrected QT interval, SLOP slope term representing the change in population-corrected QT interval from baseline due to guanfacine
aPopulation estimates from baseline heart rate model used to predict IPV
The predefined covariates were added to the base model to create a full ER model for HR. Weight and age were found to be positively correlated with a correlation coefficient of 0.74, so they were not included in the same full model. Since the effect of weight was already accounted for via guanfacine exposure due to use of predicted PK concentrations, age was used in the full covariate model rather than weight. Sex was also included in the full covariate model.
Age was included as a power function normalized by the reference age of 12 years and sex was included as a multiplicative function using an on/off switch on SLPD (Eq. 1).
| 1 |
In Eq. 1, individual PD parameters are denoted by subscript i and individual PD parameters predicted by the baseline model are denoted by subscript p. CIRCi is the oscillator function with a fixed period of 24 h, cos is the cosine function, HRi is the predicted HR, Timei is the time of the observation relative to the first measured ECG, DRUGi is the effect of guanfacine concentration on HR, Conci is the individual predicted guanfacine concentration from the population PK model, HRi is the predicted HR, ε1 is additive residual error, and all other parameters are as described previously.
This full model resulted in similar goodness-of-fit criteria, compared to the base model (Fig. 2, left panel, second column). Diagnostic plots revealed that the model was consistent with observed data, and no systematic bias was present.
The typical PK/PD model estimate for the effect of guanfacine on HR is presented in Table II for the reference patient (male, 12 years old). For every 1 ng/mL of guanfacine, there was a decrease of 2.34% (2.06–2.65%) for baseline HRM. The bootstrap 95% CI for the effect of age on SLPD was wide and, for the effect of sex on SLPD, it contained the null value, indicating a large amount of uncertainty in these point estimates. Given these results, there is insufficient information in the present data set to make conclusions about clinical significance of the covariates on SLPD.
The HR model evaluation results, which included the results of a predictive check and a stratified nonparametric bootstrap, revealed that the final model provided a reliable description of the data with good precision on the majority of structural and variance model parameters. The predictive performance of the final HR population PK/PD model demonstrated that simulated distributions of the median observed HR within each individual were in agreement with observed values (Supplemental Fig. S1, top panel) with some overprediction of the median HR at the upper end of the median HR range. Overall, typical structural model parameters and random variance terms were estimated with good precision, while the covariate effect of age was poorly estimated.
ER Model for the Effect of Guanfacine on QTc
ECG data from the three studies were pooled to determine the correction factor that provided the least bias when applied to the available data. QTcP was chosen over the Bazette- or Fridericia-corrected QTc due to the presence of bias in the Bazette and Fridericia corrections (data not shown). The population correction was further modified to allow for a difference in the correction for males and females. With the addition of the correction for males and females, the QTcP provided the best correction (no bias) of the three methods. Similar to the ER model for HR, the predicted guanfacine concentrations were then used to develop the ER model for effect of guanfacine on QTcP. A plot of QTcP versus guanfacine concentration demonstrated a slight increase in QTcP with increasing concentration (Fig. 1, bottom panel).
A linear slope-intercept model provided the best fit of the relationship between guanfacine concentration and QTcP. This model was characterized by an intercept (BQTP) representing baseline QTcP and a slope term (SLOP) representing change in QTcP from baseline due to guanfacine. Interindividual variance on BQTP and SLOP and random residual variance were described by additive models. Diagnostic plots for the model demonstrated good fit to the observed data (Fig. 2, right panel, first column).
The predefined covariates were added to the base model to create a full ER model for QTcP. As weight and age were found to be positively correlated, they were not included in the same full model. Since effect of weight was already accounted for via guanfacine exposure due to the use of predicted PK concentrations, age was used in the full covariate model rather than weight. Sex was also included in the full covariate model.
Age and sex entered the full model in the same manner as was used for the HR model. Initially, both covariates were added to BQTP and SLOP. However, the parameters for effect of age and sex on BQTP and age on SLOP were estimated with extremely poor precision (%SE >96%). Since the final QTcP model would be used for simulation, the full covariate model was reduced to reflect the most parsimonious model (Eq. 2).
| 2 |
In Eq. 2, individual PD parameters are denoted by the subscript i, QTPRi is the predicted QTcP, Conci is the individual predicted guanfacine concentration from the population PK model, ε1 is additive residual error, and all other parameters are as defined in the text.
This full model resulted in similar goodness-of-fit criteria compared to the base model. Diagnostic plots revealed that the model was consistent with observed data and no systematic bias was present. Therefore, the full model was accepted as the final ER model for QTcP for this analysis (Fig. 2, right panel, second column).
The typical PK/PD parameters (95% CI) for this model given the reference covariate (male) were 395 (393–397) ms and 0.941 (0.627–1.25) ms/ng/mL for BQTP and SLOP, respectively (Table II). Unexplained interindividual variability and random residual variability were essentially unchanged from the values reported after the fit of the base model. The NONMEM asymptotic 95% CI for effect of sex on BQTP indicated that the parameter was estimated with good precision. The effect of sex on BQTP results in a typical baseline QTcP estimate (95% CI) that is 9 (5–13) ms higher for females compared with males. This effect is consistent with known physiology and is not related to guanfacine effects on QTcP.
The QTcP model evaluation results revealed that the final model provided a reliable description of the data with good precision on the majority of structural and variance model parameters. The predictive performance of the final QTcP population PK/PD model demonstrated that simulated distributions of the median observed QTcP within each individual were in agreement with observed values (Supplemental Fig. S1, lower panel), with some overprediction of the median QTcP at the upper end of the median QTcP range.
Simulation of QTcP for Varying Guanfacine Doses
The full guanfacine PK model and ER model for QTcP were used to simulate predicted QTcP at steady state following 2- or 4-mg guanfacine administration. Weight was a major factor in predicted guanfacine-related changes in QTcP from baseline (Supplemental Fig. S2). As weight increased from 20 to 150 kg, the predicted change in QTcP from baseline declined according to the shape of a power function. Based on these results, slices of the overall weight distribution were used to estimate probability of a given QTcP change from baseline at steady-state maximum concentration (Cmax) for the simulation as described in the “Methods” section. Based on these simulations, the expected probability of having a 5-, 10-, or 15-ms change from baseline in QTcP for a typical 20-kg female receiving 4 mg of guanfacine daily are 100, 95, and 38%, respectively. For a dose of 2 mg, the probabilities for the 5-, 10-, or 15-ms change from baseline in QTcP drop to 95, 2, and 0%, respectively. As patient weight increases, the probabilities of the 5-ms change in QTcP from baseline decrease to an asymptote of 0 and 59% for a 2-mg and 4-mg dosing regimens, respectively.
Table III presents the results for all simulated scenarios and a comparison to the collected study data. The simulated QTcP metrics were similar to those found in the study data. For the 2-mg dose, all simulated metrics based on a QTcP cutoff value (QTcP [male] >450 ms, QTcP [female] >460 ms, QTcP >480 ms) had median percentages per trial that were less than 1% and in most cases were zero. When the 4-mg dose was evaluated, the percentages increased slightly but were still very small, in most cases less than 5%, or zero. The percentage of patients per trial that demonstrated an increase from baseline in QTcP of 10% or greater appeared to approximately double when the dose was doubled for a given weight distribution. This set of simulations and associated metrics demonstrated the dependence of QTcP on patient weight for a given administered guanfacine dose. When the administered dose of guanfacine is non-weight based (i.e., 2 or 4 mg/day), then the largest relative changes in QTcP prolongation will be observed in patients with lower body weights.
Table III.
Summary of Simulation Results for the Individual QTcP Metrics Based on QTcP Cutoff Values
| Source | % males/trial with QTcP >450 ms (# trials) | % females/trial with QTcP >460 ms (# trials) | % patients/trial with QTcP >480 ms (# trials) | % patients/trial with ≥10% increase from baseline in QTcP (# trials) |
|---|---|---|---|---|
| PD databasea | 2.5% (1) | 0 (1) | 0 (1) | 9.4% (1) |
| 2 mg phase III simulation | 0 (0, 2.7) %b (1,000)c | 0 (0, 2.5) % (1,000) | 0 (0, 0) % (1,000) | 3.1 (0.63, 6.9) % (1,000) |
| 4 mg phase III simulation | 1.2 (0, 4.9) % (1,000) | 1.2 (0, 5.1) % (1,000) | 0 (0, 0.63) % (1,000) | 6.3 (1.9, 11) % (1,000) |
| 2 mg 6-year-old female simulationd | NA | 0.63 (0, 3.1) % (1,000) | 0 (0, 0.63) % (1,000) | 5.0 (1.9, 11) % (1,000) |
| 4 mg 6-year-old female simulationd | NA | 4.4 (0.63, 9.4) % (1,000) | 0.63 (0, 3.1) % (1,000) | 13 (6.9, 21) % (1,000) |
QTcP population-corrected QT, PD pharmacodynamic
aGuanfacine treated only from studies SPD503-107, SPD503-203, and SPD503-206
bMedian (2.5th, 97.5th percentile)
c160 patients/trial
dMedian (5th, 95th percentile) weight = 21 (15, 27) kg
DISCUSSION
The model for the HR-ER relationship was described by an empiric circadian model for baseline HR plus a linear model for the effect of guanfacine. The effect of guanfacine was modeled as a linear slope that resulted in a decrease in baseline HR. The final model results indicated that the estimated population-typical (95% CI) decrease in HR would be 2.3% (2.1–2.7%) of the baseline HR for every 1 ng/mL of guanfacine. Interoccasion variability of baseline HR demonstrated some positive bias for patients in one of the phase 2 studies. A review of individual HR-versus-time plots for patients in this study demonstrated an overshoot of baseline HR following the discontinuation of drug in some patients. The interoccasion variability term in the HR model accounts for some of the overshoot in baseline HR that occurred. The abrupt discontinuation of orally administered, centrally acting α2-adrenergic agonists can cause increases in blood pressure to values greater than those prior to the start of therapy (9). However, given the slow taper of guanfacine in this study and the decreased propensity for guanfacine to cause rebound effects upon withdrawal, it is unlikely that rebound increases in HR were due to withdrawal and more likely that they represent true interoccasion variability.
The effect of age on the guanfacine slope parameter in the ER model for HR indicated a trend toward a decrease in HR with increasing age over the age range (6–17 years) studied. The age effect, however, was estimated with poor precision and the CI for this effect overlapped the null effect while extending into regions of potential clinical significance. The sex effect on guanfacine slope was precisely estimated with a 95% CI crossing the null effect but extending into the region of potential clinical significance at its upper bound. Based on these results, however, there is not enough information in the data set to determine the clinical significance of the effects of age and sex on the ER model for HR.
Consistent trends that would indicate that QT-RR hysteresis was occurring were not apparent in the graphical evaluation of the QT-RR relationship. QT-RR hysteresis can occur when there is a lag between a change in the RR interval and the detection of that change in the QT interval. Any intervention causing a rapid change in HR, e.g., certain drugs, exercise, and postural changes, has the ability to result in QT-RR hysteresis. It is known that guanfacine can cause a decrease in HR via central stimulation of α2-adrenergic receptors leading to a decrease in sympathetic tone, which results in a reduction in HR (9). For this reason, it was important to determine whether the HR decrease caused by guanfacine resulted in QT-RR hysteresis. The inability to detect hysteresis may be the result of a number of factors, including the extended-release characteristics of the modified-release formulation of guanfacine HCl that result in a flat PK profile (longer absorption period and lower Cmaxvs. immediate release), which decreases the likelihood of rapid changes in HR; the lack of closely spaced ECG measurements, which are required to capture QT-RR hysteresis; or simply the inability of guanfacine to cause this effect. The specific reason cannot be determined given the available data.
The ER relationship for the effect of guanfacine on QTcP was described by a linear model parameterized in terms of BQTP and SLOP. QTcP was generated by correcting the QT interval for HR using a population approach with an additional effect for sex. The use of a sex effect for QT correction in the pediatric population has been demonstrated in the literature and was necessary in the present analysis to remove a bias evident following the standard population correction (19). An effect of sex on BQTP was the only covariate effect in the final ER model for QTcP and its inclusion resulted in a typical baseline QTcP estimate that is 9 (5–13) ms higher for females compared with males. The magnitude of this difference is consistent with literature reports for sex differences in HR-corrected QT interval (13). The typical (95% CI) SLOP was estimated to be 0.941 (0.627–1.25) ms/ng/mL, resulting in an approximate 1-ms increase from baseline for every 1 ng/mL of guanfacine in plasma.
Integration of the guanfacine population PK and PK/PD models allows for the evaluation of dosages and patient demographics relative to endpoints of interest. This integrated relationship for QTcP was used to assess the effect of different dosage regimens and patient characteristics on QTcP changes. PK/PD simulations showed that within the same guanfacine dosage (mg/day), patients with lower body weights had a higher Cmax and therefore greater relative increases in QTcP. The probabilities of a 10-ms change in QTcP at the Cmax associated with 2 mg/day of guanfacine are 2, 0, and 0%, respectively, for typical female patients weighing (approximate age) 20 kg (6 years), 50 kg (12 years), and 65 kg (17 years) (Fig. 3). The probabilities for a 10-ms change in QTcP following 4 mg/day of guanfacine are 95, <1, and ∼0%, respectively, for typical female patients following the same weight (age) distributions. Although the probability for a typical smaller child (female, 6 years old, 20 kg, 4-mg dose) of observing a 10-ms change in QTcP is 95%, the probability associated with a 15-ms change drops to 38%, and to a probability of 1.8% for a 20-ms change. These probabilities decrease when evaluating QTcP changes in slightly larger female pediatric patients.
Fig. 3.
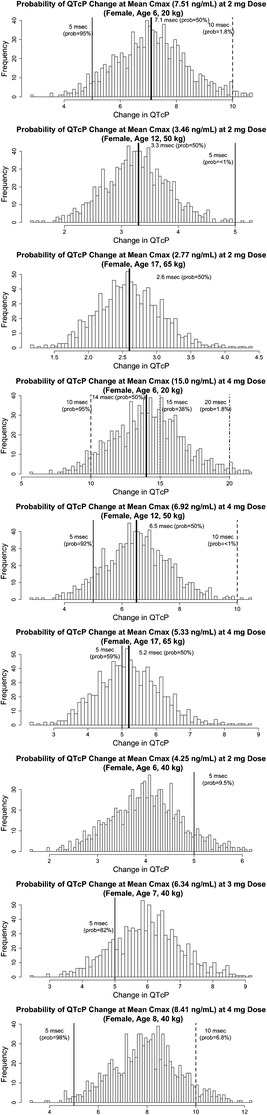
Image shows the probability of mean QTcP change at steady-state mean. Histogram of mean change in QTcP from 10,000 simulated clinical trials. The solid line is reference for 5-msec mean QTcP change and dashed line is reference for 10-msec mean QTcP change with associated probability listed on the plot. Heavy black line is mean QTcP change with a 50% probability. Histogram of mean change in QTcP from 10,000 simulated clinical trials for a 20-kg, 6-year-old female (top), 50-kg, 12-year-old female (middle), and 65-kg, 17-year-old female (bottom) patient with ADHD receiving 2 mg of guanfacine is shown in column 1. Histogram of mean change in QTcP from 10,000 simulated clinical trials for a 20-kg, 6-year-old female (top), 50-kg, 12-year-old female (middle), and 65-kg, 17-year-old female (bottom) patient with ADHD receiving 4 mg of guanfacine in column 2. Histogram of mean change in QTcP from 1000 simulated clinical trials for a 40-kg, 6-year-old female (top), 40-kg, 7-year-old female (middle), and 40-kg, 8-year-old female (bottom) patient with ADHD receiving 4 mg of guanfacine in column 3
Incorporating predicted concentrations from the population PK model, an ER model was successfully developed to describe guanfacine plasma concentrations and changes in the QT interval. Guanfacine exposure was associated with a small prolongation of the QTcP interval. The addition of a sex component to the population correction for QT was necessary to correct the baseline QTcP. The main predictor of QTcP prolongation was guanfacine exposure, which decreased with body weight and increased with dose. This was confirmed and described using simulations from the model incorporating patient covariates, different dosages, and variability.
Electronic supplementary material
Image shows a predictive check for median heart rates with distributions of simulated median heart rates (bpm) within each individual (C med) compared to the actual observed distribution of C med values from the population pharmacodynamic database and a predictive check for maximum population corrected QT (QTcP) intervals (ms) compared to the actual observed distribution of QTcP intervals from the population pharmacodynamic database. Quantile-quantile plots for each of the 100 simulation replicates are depicted by a gray dashed line and are overlaid on this plot. The black solid line represents a reference line of identity. Top image shows heart rate and bottom image shows QTcP intervals. (GIF 84 kb)
Image shows change in QTcP at steady-state C max versus weight for clinical trial simulations in pediatric ADHD patients receiving 2 or 4 mg of guanfacine. Simulated change in QTcP at steady-state C max is plotted against corresponding weight (kg). Values are plotted as open circles. Solid black line is reference for weight of 20 kg in 6-year old, dashed line is reference for weight of 50 kg in 12-year old, and dotted line is reference for weight of 65 kg in 17-year old. Left panel shows 2 mg dose and right panel shows 4 mg dose. (GIF 71 kb)
ACKNOWLEDGMENTS
Funding for this research was provided by Shire Development LLC to Metrum. Melissa Brunckhorst, from MedErgy, provided editorial assistance in formatting, proofreading, and copy editing. This support was funded by Shire. Although the sponsor was involved in the design, collection, analysis, interpretation, and fact checking of information, the content of this manuscript, the ultimate interpretation, and the decision to submit it for publication in The AAPS Journal were made by all the authors independently.
Conflict of Interest
JE, PM, and JP are employees of Shire Development LLC and hold stock/stock options in Shire. WK and MRG are employees of Metrum Research Group LLC, which received funding from Shire Development LLC for this study.
REFERENCES
- 1.National Institute of Mental Health. Attention deficit hyperactivity disorder (ADHD). US Department of Health and Human Services; 2008.
- 2.Biederman J, Faraone SV. Attention-deficit hyperactivity disorder. Lancet. 2005;366(9481):237–48. doi: 10.1016/S0140-6736(05)66915-2. [DOI] [PubMed] [Google Scholar]
- 3.Wolraich M, Brown L, Brown RT, et al. Implementing the key action statements: an algorithm and explanation for process of care for the evaluation, diagnosis, treatment, and monitoring of ADHD in children and adolescents. Pediatrics. 2011;128(5, supplemental information):SI1–21. doi: 10.1542/peds.digest1285. [DOI] [Google Scholar]
- 4.Wilens TE, Spencer TJ. The stimulants revisited. Child Adolesc Psychiatr Clin N Am. 2000;9(3):573–603. [PubMed] [Google Scholar]
- 5.Cantwell DP. Attention deficit disorder: a review of the past 10 years. J Am Acad Child Adolesc Psychiatry. 1996;35(8):978–87. doi: 10.1097/00004583-199608000-00008. [DOI] [PubMed] [Google Scholar]
- 6.Wilens TE, Spencer T, Biederman J, Wozniak J, Connor D. Combined pharmacotherapy: an emerging trend in pediatric psychopharmacology. J Am Acad Child Adolesc Psychiatry. 1995;34(1):110–2. doi: 10.1097/00004583-199501000-00021. [DOI] [PubMed] [Google Scholar]
- 7.TENEX (guanfacine hydrochloride) tablet prescribing information. Bridgewater, NJ: Promius Pharma LLC; 2008.
- 8.TENEX: Summary of approval. A.H. Robbins Company. NDA No. 19-032. 1986. 1986.
- 9.INTUNIV® (guanfacine) extended-release tablets [package insert]. Wayne, PA: Shire Pharmaceuticals LLC.
- 10.Boellner SW, Pennick M, Fiske K, Lyne A, Shojaei A. Pharmacokinetics of a guanfacine extended-release formulation in children and adolescents with attention-deficit-hyperactivity disorder. Pharmacotherapy. 2007;27(9):1253–62. doi: 10.1592/phco.27.9.1253. [DOI] [PubMed] [Google Scholar]
- 11.Kollins SH, Lopez FA, Vince BD, et al. Psychomotor functioning and alertness with guanfacine extended release in subjects with attention-deficit/hyperactivity disorder. J Child Adolesc Psychopharmacol. 2011;21(2):111–20. doi: 10.1089/cap.2010.0064. [DOI] [PubMed] [Google Scholar]
- 12.Beal SL, Sheiner LB, Boeckmann AJ. NONMEM users guide: part I-VII, (1989–2006) Ellicott City: Icon Development Solutions; 2006. [Google Scholar]
- 13.Piotrovsky V. Pharmacokinetic-pharmacodynamic modeling in the data analysis and interpretation of drug-induced QT/QTc prolongation. AAPS J. 2005;7(3):E609–24. doi: 10.1208/aapsj070363. [DOI] [PMC free article] [PubMed] [Google Scholar]
- 14.Parke J, Holford NH, Charles BG. A procedure for generating bootstrap samples for the validation of nonlinear mixed-effects population models. Comput Methods Programs Biomed. 1999;59(1):19–29. doi: 10.1016/S0169-2607(98)00098-4. [DOI] [PubMed] [Google Scholar]
- 15.Ette EI, Onyiah LC. Estimating inestimable standard errors in population pharmacokinetic studies: the bootstrap with Winsorization. Eur J Drug Metab Pharmacokinet. 2002;27(3):213–24. doi: 10.1007/BF03190460. [DOI] [PubMed] [Google Scholar]
- 16.Yano Y, Beal SL, Sheiner LB. Evaluating pharmacokinetic/pharmacodynamic models using the posterior predictive check. J Pharmacokinet Pharmacodyn. 2001;28(2):171–92. doi: 10.1023/A:1011555016423. [DOI] [PubMed] [Google Scholar]
- 17.National Center for Health Statistics. NHANES III, Third National Health and Nutrition Examination Survey, 1988–1994. Available at: http://www.cdc.gov/nchs/about/major/nhanes/nh3data.htm. Accessed 21 Feb 2013.
- 18.National Center for Health Statistics. CDC growth charts. Available at: http://www.cdc.gov/growthcharts/. Accessed 21 Feb 2013.
- 19.Wernicke JF, Faries D, Breitung R, Girod D. QT correction methods in children and adolescents. J Cardiovasc Electrophysiol. 2005;16(1):76–81. doi: 10.1046/j.1540-8167.2005.03520.x. [DOI] [PubMed] [Google Scholar]
Associated Data
This section collects any data citations, data availability statements, or supplementary materials included in this article.
Supplementary Materials
Image shows a predictive check for median heart rates with distributions of simulated median heart rates (bpm) within each individual (C med) compared to the actual observed distribution of C med values from the population pharmacodynamic database and a predictive check for maximum population corrected QT (QTcP) intervals (ms) compared to the actual observed distribution of QTcP intervals from the population pharmacodynamic database. Quantile-quantile plots for each of the 100 simulation replicates are depicted by a gray dashed line and are overlaid on this plot. The black solid line represents a reference line of identity. Top image shows heart rate and bottom image shows QTcP intervals. (GIF 84 kb)
Image shows change in QTcP at steady-state C max versus weight for clinical trial simulations in pediatric ADHD patients receiving 2 or 4 mg of guanfacine. Simulated change in QTcP at steady-state C max is plotted against corresponding weight (kg). Values are plotted as open circles. Solid black line is reference for weight of 20 kg in 6-year old, dashed line is reference for weight of 50 kg in 12-year old, and dotted line is reference for weight of 65 kg in 17-year old. Left panel shows 2 mg dose and right panel shows 4 mg dose. (GIF 71 kb)