

Abstract
Achieving the required sensitivity can be a challenge in the development of ligand binding assays for pharmacokinetic (PK) determinations of biotherapeutics. To address this need, BioScale’s Acoustic Membrane Microparticle (AMMP) technology was evaluated for the quantification of a PEGylated domain antibody (dAb) biotherapeutic. Previous uses of this technology had shown utility in biomarker and process development applications and this is the first application, to our knowledge, for PK determinations. In this evaluation, AMMP was capable of delivering a sensitivity of 0.750 ng/mL, which surpasses the sensitivity requirements for the majority of assays to support PK determinations. This evaluation demonstrates that this emerging technology has the ability to produce the required sensitivity, reproducibility, and selectivity needed to meet the industry’s standards for PK analysis.
KEY WORDS: acoustic membrane microparticle technology, biotherapeutics, emerging technology, ligand binding assays, pharmacokinetics
INTRODUCTION
Enzyme-linked immunosorbent assays (ELISAs) have traditionally been used for the quantification of biotherapeutics for pharmacokinetic (PK) determinations and absorbance-based immunoassays are the gold standard when it comes to ligand binding assays (LBAs). However, absorbance-based ELISAs have their drawbacks ranging from limited sensitivity and assay range, to requiring numerous and often manual manipulations. These assays, on average, take a full day to complete, and unless automated, the analyst must be available to tend to the assay during step-wise incubations. Electro/chemiluminescence (1), bead-based technology (2), micro-fluidics (3), and acoustic membrane microparticle (AMMP) technology, to name a few, have led to many advances to overcome issues of the absorbance-based ELISAs: sensitivity, walk-away capabilities, and wider detection range. Optimization of analytical methods and testing processes within drug development is essential to achieve program needs and reduce drug development timelines. In order to successfully accomplish this, new technologies may be evaluated. In addition to platform selection, the quality of the reagents plays a critical role in sensitivity limitations and should be explored, especially when access to a new platform is not feasible. There are also alternatives in the type of substrate (4) or plates (5) and when coupled with the use of a liquid handler, the needs of the program may be fulfilled.
AMMP technology differs from other platforms as it utilizes a non-optical detection system, which determines protein concentration by measuring the change in the oscillating frequency of a piezoelectric membrane. This change is proportional to the mass of the analyte bound to it. The change in vibrating frequency is “amplified” by conjugating the capture reagent to magnetic beads, which help increase the mass of the entire immunocomplex being detected. This is done on a system available by BioScale called the ViBE Workstation and it works as follows: (1) A solution-based immunocomplex is formed where the capture reagent is labeled with magnetic beads, and the detection reagent is labeled with fluorescein. This step can either be done manually or by the ViBE instrument’s liquid handler to provide a walk-away system. (2) The instrument uses eight probes to add the samples to the membrane, one column at a time, and the solution flows over the membrane. (3) The interaction between the membrane and the immunocomplex is facilitated by application of a magnetic field to pull the complex near the membrane. (4) The membrane, which is coated with anti-fluorescein antibodies, will bind the fluorescein attached to the detection reagent. (5) The magnet is removed and all unbound reagents are washed away leaving only the bound immunocomplex. (6) The change in vibrating frequency is measured (Fig. 1a) [www.bioscale.com]. In this platform, interference from the detector reagent binding to other components in the matrix is negligible, as they cannot form a sandwich with the capture agent on the magnetic beads. Only those components non-specifically bridging the capture and detector reagents would cause interference in the assay.
Fig. 1.
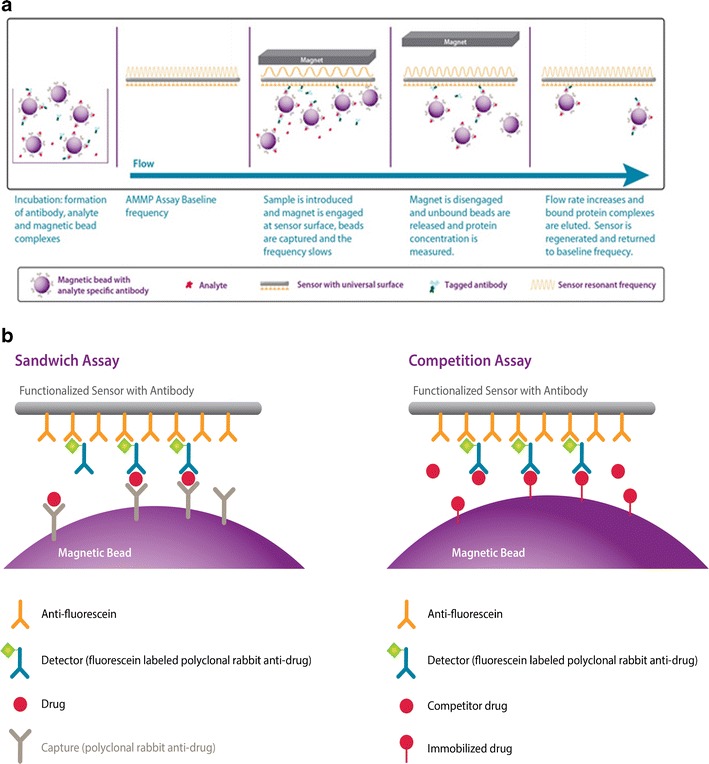
a Schematic representation of how the AMMP platform works. b Sandwich format: drug detection with polyclonal anti-drug antibody immobilized on the magnetic bead and the same polyclonal anti-drug antibody, fluorescein labeled, for detection of the complex on the sensor. Competition format: drug detection with the drug immobilized on the magnetic bead and the polyclonal rabbit anti-drug antibody, fluorescein labeled, competing for detection of the complex on the sensor
Here, we present a case study where AMMP technology was evaluated for the quantification of a PEGylated domain antibody (dAb) in human serum. The goal of the evaluation was to develop a new LBA to support a multiple ascending dose study (MAD) with the ability to achieve improved sensitivity over the current assay used to support a first-in-human study (FIH). The original assay was an electrochemiluminescent plate-based assay which utilized a solution phase target capture system and a goat anti-Vκ antibody as detection. This assay was able to achieve a lower limit of quantification (LLOQ) of 80 ng/mL. This sensitivity would have not allowed for the characterization of the full PK profile at lower doses. Since AMMP technology has been previously shown to quantitate biomarkers in the low picogram per milliliter levels (6,7), we evaluated its capability of delivering the required sensitivity, selectivity, accuracy, and precision for a PK assay. Two assay formats were investigated: a sandwich assay and a competition assay. The sandwich assay was limited by the bead capacity and optimal amount of beads utilized in the assay, resulting in a hook effect; therefore, this assay was not chosen. The competition assay utilized the PEGylated dAb conjugated to magnetic beads and a polyclonal rabbit anti-drug antibody conjugated to fluorescein for detection and was selected for the evaluation. Here, we present the accuracy and precision data of a competition LBA using AMMP technology which was able to achieve an LLOQ of 0.750 ng/mL.
METHODS AND MATERIALS
Common Reagents
Antibody reagents or drug were conjugated to epoxy coated paramagnetic beads via amine coupling (BioScale, Lexington, MA) or to fluorescein using a N-hydroxysuccinimide (NHS)-Fluorescein Labeling Kit (BioScale, Lexington, MA). Conjugation reactions were performed according to the manufacturers’ instructions. All standards and quality controls (QCs) were prepared in 100% human serum (Bioreclamation, Liverpool, NY) and diluted into serum diluent buffer (BioScale, Lexington, MA). Wash buffer consisted of PBS (EMD Millipore, Billerica, MA) with 0.05% Tween-20 (Sigma-Aldrich, St. Louis, MO) and 1% BSA (Equitech-Bio, Kerryville, TX). Assays were performed either using 1- or 2-plate universal detection cartridges (BioScale, Lexington, MA) with ViBE cartridge regeneration buffer (BioScale, Lexington, MA). The polyclonal rabbit anti-drug antibody was generated by Covance (Dedham, MA) and affinity purified by Bristol-Myers Squibb (BMS). The PEGylated domain antibody biotherapeutic was generated by BMS and has a 40-kDa PEG attached to a 12 kDa protein domain.
Method Development
Experiments were designed using AMMP technology on the ViBE Workstation (BioScale, Lexington, MA). Two assay formats were evaluated: (1) an antibody sandwich assay using anti-drug antibodies as capture and detection and (2) a competition assay using the drug and an anti-drug antibody (Fig. 1b).
Sandwich Assay
Paramagnetic beads were conjugated with a polyclonal rabbit anti-drug antibody at a challenge ratio of either 5 or 20 μg of antibody per milligram of beads (6.67×10⁸ beads/mg). Different lots of rabbit polyclonal antibody were conjugated with fluorescein for pairing with the conjugated beads in the assay. The final homogeneous assay was composed of 1×10⁵ bead/mL and 200 ng/mL fluorescein-labeled antibody added to the standard (0.02–220 ng/mL) or sample (all components incubated simultaneously). At drug concentrations above 5 ng/mL, there was not enough capture antibody per well for quantification of the drug. Higher concentrations of antibody conjugated to beads could not be tested due to the binding limitations of the beads. The instrument is capable of using beads of various sizes; however, BioScale generally uses beads with a diameter of 2 μm and therefore, all setting are optimized to this bead size. The user has the ability to test various bead sizes, but one would have to keep in mind that smaller beads would not elicit the same magnitude of response from the sensor and larger beads will be susceptible to different shear forces in the running buffer flow. Since no wash steps are included between the additions of reagents, a hook effect was observed at higher drug concentrations due to saturation of capture and detector antibodies, therefore preventing formation of the complex/sandwich.
Competition Assay
The assays were run such that the bead and fluorescein-labeled reagents were incubated with the sample for 60 min each. The competition assay was evaluated in two formats: (1) beads conjugated with drug paired with fluorescein-labeled anti-drug antibody and (2) beads conjugated with anti-drug antibody paired with fluorescein-labeled drug. To assess which format gave the best sensitivity, the bead and binding partners were titrated. The sensitivity of the assay with the first format was approximately 0.100 ng/mL which was lower than that of the second format which had a sensitivity of 0.500 ng/mL (Fig. 2). The final assay format determined to have the best sensitivity was the drug-conjugated beads with the fluorescein-labeled antibody and it was further optimized.
Fig. 2.
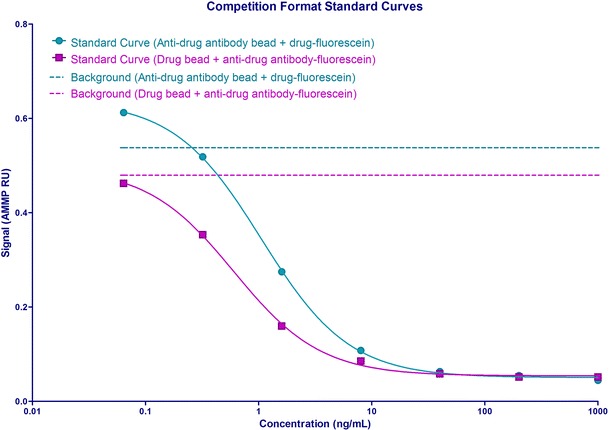
Competition format standard curves
Optimized Assay Conditions
Based on the results from the different formats tested, the assay parameters were determined using the drug-conjugated bead and the fluorescein-labeled polyclonal rabbit anti-drug antibody. Though the number of beads used in an assay is set by the capacity of the sensor, the amount of drug conjugated to the bead’s surface can be varied to modulate sensitivity in the assay. In this case, beads were conjugated with 2 μg drug/mg of bead due to the molecular weight of the drug. To optimize a competition assay, a balance of signal strength and the appropriate amount of sample competing for the fluorescein-labeled antibody must be achieved. This was investigated by looking at saturating and sub-saturating levels of the beads with varying amounts of fluorescein-labeled antibody. The optimal number of beads was tested at 1 × 10⁵ beads/mL with 9, 6, or 3 ng/mL of fluorescein-labeled antibody to achieve the best sensitivity. Additionally, to determine the minimum required dilution (MRD) of the assay, standards were prepared at a range of concentrations from 0.06 to 133 ng/mL in three different lots of pooled human serum. Each standard curve was then diluted either fourfold or eightfold in serum diluent buffer. Both MRDs, in all three lots of serum, showed equivalent recovery and a fourfold MRD was chosen for the final assay to avoid unnecessary sample dilution. The optimized assay conditions were found to be 1 × 10⁵ beads/mL and 9 ng/mL of the fluorescein-labeled antibody. For this assay, samples were diluted to the MRD in serum diluent manually by the analyst and then placed on the ViBE instrument. The instrument incubated the assay for a total of 120 min, first by adding the beads to the sample for 60 min followed by adding the fluorescein-labeled antibody for the remaining 60 min.
RESULTS
Accuracy and Precision Assessment
Accuracy and precision of the assay were evaluated in four runs completed over 2 days on the same instrument by one analyst. A standard curve and three replicates of each QC level were included on each run. The standard curve consisted of points ranging from 0.750 to 20.0 ng/mL, with anchor points at 0.500 and 50.0 ng/mL. Quality controls were tested at six levels. The dilution QC was prepared at 75 μg/mL and diluted in 100% serum to 3.00 ng/mL. The QC accuracy and precision performance is summarized in Table I, while Table II shows the standard curve performance. It is worth noting that all QCs were within 20% deviation from the nominal concentration except for the dilution QC which showed a deviation of −22.0%. However, when different dilution QC sample preparations were tested in the dilutional linearity assessment and in cross-site testing, their percent deviations were within 20% of the nominal concentration.
Table I.
ANOVA
| LLOQ | LQC | MQC | HQC | ULOQ | DIL QC | |
|---|---|---|---|---|---|---|
| Nominal conc. (ng/mL) | 0.750 | 1.50 | 10.0 | 15.0 | 20.0 | 7.50 × 10⁴ |
| Mean observed conc. (ng/mL) | 0.721 | 1.43 | 10.3 | 14.6 | 18.7 | 5.85 × 10⁴ |
| Deviation (%) | −3.9 | −4.4 | 3.1 | −2.4 | −6.5 | −22.0 |
| Between-run precision (CV (%)) | 9.6 | 12.6 | 13.3 | 15.8 | 18.7 | 8.0 |
| Within-run precision (CV (%)) | 14.8 | 7.8 | 9.8 | 14.3 | 10.2 | 5.5 |
| Total variation (CV (%)) | 17.6 | 14.9 | 16.5 | 21.3 | 21.3 | 9.7 |
| Total error | 21.5 | 19.3 | 19.6 | 23.7 | 27.8 | 31.7 |
| n | 12 | 12 | 12 | 12 | 12 | 12 |
| Number of runs | 4 | 4 | 4 | 4 | 4 | 4 |
LLOQ lower limit of quantification, LQC low quality control, MQC middle quality control, HQC high quality control, ULOQ upper limit of quantification, DIL QC dilution quality control, Conc. concentration, CV coefficient of variation
Table II.
Standard Curve Performance
| Nominal concentration (ng/mL) | Mean back calculated concentration (ng/mL) n = 4 | CV (%) | Deviation (%) |
|---|---|---|---|
| 50.0* | 48.7 | 31.6 | −2.5 |
| 20.0 | 19.1 | 11.7 | −4.7 |
| 15.0 | 14.8 | 8.9 | −1.4 |
| 10.0 | 10.4 | 7.7 | 4.5 |
| 7.50 | 7.71 | 14.6 | 2.8 |
| 5.00 | 4.99 | 2.2 | −0.2 |
| 2.50 | 2.53 | 7.3 | 1.3 |
| 1.00 | 0.974 | 8.1 | −2.6 |
| 0.750 | 0.751 | 3.3 | 0.2 |
| 0.500* | 0.513 | 8.2 | 2.5 |
Standards were diluted to the minimal required dilution (MRD) and analyzed in triplicate on the ViBE Workstation; one standard curve was used per run. The standard curve used an unweighted four-parameter logistic regression model.
CV coefficient of variation
*Anchor points
Selectivity
The ability of the assay to recover at the LLOQ of 0.750 ng/mL of drug was evaluated. Ten individual, healthy human serum samples were run unspiked, as well as spiked at the 0.750 ng/mL. All of the samples recovered < LLOQ when analyzed unspiked. When spiked at 0.750 ng/mL, 90% of the samples recovered within 20% of the nominal concentration; however, a negative bias was observed and would require additional investigation before proceeding to assay validation. Results are listed in Table III.
Table III.
Selectivity
| Unspiked | Spiked at 0.750 ng/mL | ||
|---|---|---|---|
| Sample | Mean back calculated concentration (ng/mL) | Mean back calculated concentration (ng/mL) | Deviation (%) |
| NHS1 | <LLOQ | 1.097 | 46.4 |
| NHS2 | <LLOQ | 0.634 | −15.4 |
| NHS3 | <LLOQ | 0.601 | −19.8 |
| NHS4 | <LLOQ | 0.704 | −6.2 |
| NHS5 | <LLOQ | 0.629 | −16.1 |
| NHS6 | <LLOQ | 0.647 | −13.7 |
| NHS7 | <LLOQ | 0.657 | −12.4 |
| NHS8 | <LLOQ | 0.795 | 6.0 |
| NHS9 | <LLOQ | 0.617 | −17.8 |
| NHS10 | <LLOQ | 0.817 | 8.9 |
| Control pool | <LLOQ | 0.769 | 2.5 |
NHS Normal Human Serum, LLOQ lower limit of quantification
Dilutional Linearity
Dilutional linearity was evaluated by spiking pooled human serum at the expected Cmax of 75 μg/mL. The sample was then serially diluted in human serum to produce five additional concentration levels. Two concentration levels were above the ULOQ of the assay to assess any hook effect, if present, three concentrations within the range of the assay, and one concentration below the LLOQ. All tested concentrations which fell into the range of the assay were within 15% deviation from the nominal and no hook effect was observed.
Cross-Site Testing
All experiments listed above were performed by BioScale. In order to evaluate the assay performance across laboratories, standards and QCs were prepared by BMS and two plates of accuracy and precision were analyzed by a different analyst at the BMS site using a different ViBE instrument. All QCs were within 20% deviation from the nominal concentration. Results are shown in Table IV.
Table IV.
ANOVA—Cross-site Testing
| LLOQ | LQC | MQC | HQC | ULOQ | DIL QC | |
|---|---|---|---|---|---|---|
| Nominal conc. (ng/mL) | 0.750 | 1.50 | 10.0 | 15.0 | 20.0 | 7.50 × 10⁴ |
| Mean observed conc. (ng/mL) | 0.811 | 1.67 | 9.46 | 15.8 | 19.6 | 7.90 × 10⁴ |
| Deviation (%) | 8.2 | 11.2 | −5.4 | 5.6 | −2.1 | 5.3 |
| Between-run precision (CV (%)) | 17.0 | 0.0 | 4.2 | 15.1 | 0.0 | 7.5 |
| Within-run precision (CV (%)) | 10.7 | 10.4 | 10.9 | 12.6 | 23.6 | 8.2 |
| Total variation (CV (%)) | 20.1 | 10.3 | 11.7 | 19.7 | 19.6 | 11.1 |
| Total error | 28.3 | 21.5 | 17.1 | 25.3 | 21.7 | 16.4 |
| n | 6 | 6 | 6 | 6 | 6 | 6 |
| Number of runs | 2 | 2 | 2 | 2 | 2 | 2 |
LLOQ lower limit of quantification, LQC low quality control, MQC middle quality control, HQC high quality control, ULOQ upper limit of quantification, DIL QC dilution quality control, Conc. concentration, CV coefficient of variation
DISCUSSION
As demonstrated from this evaluation, AMMP technology has the potential to provide a sensitive assay. The data also suggests the technology can meet the regulatory standards for bioanalytical assays to support PK assessments. However, the dynamic range for the assay presented here is somewhat lower (at ∼25-fold) than other technologies (i.e., electrochemiluminescence, chemiluminescence) that often achieve dynamic ranges of 100-fold or greater. In order to be used in support of sample analysis, this assay would require the samples to be diluted multiple times in order to fall within the detection range. Due to this, the assay would have been implemented only if the drug’s efficacious dose would have been found to be lower than actual. Other published data also suggests that the narrow range might be a limitation of the technology (6,7).
Even though a platform can deliver the required sensitivity, one must also take into consideration other advantages or disadvantages to the downstream application of PK sample analysis. Throughout this evaluation, we found the ViBE instrument’s capability to provide a walk-away system very useful. However, current forms of the instrument, initially designed for assay development purposes, have a limited deck capacity. The maximum amount of samples the instrument can process is three 96-well micro-titer plates per run (time varies dependent on the assay). If the instrument performs the incubations, one of the micro-titer plates must be used for the capture and detection reagents, thus only two 96 well micro-titer plates of samples can be analyzed at a time. Additionally, at the time of this evaluation, the software lacked 21 Code of Federal Regulations (CFR) Part 11 Compliance (required for regulated bioanalysis), and integration with a Laboratory Information Management System (LIMS). BioScale currently has an updated version of the software with both of these capabilities in beta testing.
CONCLUSION
The evaluation presented here demonstrates that AMMP technology has the potential to be used as an LBA platform for PK determinations of biotherapeutics. The data shows that the platform is capable of delivering a sensitive assay with good accuracy and precision. However, in this case, the sensitivity was hindered by the short dynamic range of the assay (25-fold), which would require numerous sample dilutions if implemented for PK support. The system is not currently 21 CFR Part 11 compliant which would be required to support regulated bioanalysis; however, the vendor does have this software in beta testing.
ACKNOWLEDGMENTS
The authors would like to acknowledge the work done by Murli Krishna and Holly Palmé in the oversight of reagent generation for this program. Steven Piccoli, Dharmesh Desai, Lora Hamuro, and Binodh DeSilva for review of this manuscript and Carol Gleason for statistical support.
REFERENCES
- 1.Rhyne PW, Wong OT, Zhang YJ, Weiner RS. Electrochemiluminescence in bioanalysis. Bioanalysis. 2009;1(5):919–35. doi: 10.4155/bio.09.80. [DOI] [PubMed] [Google Scholar]
- 2.Morgan E, Varro R, Sepulveda H, Ember JA, Apgar J, Wilson J, et al. Cytometric bead array: a multiplexed assay platform with applications in various areas of biology. Clin Immunol. 2004;110(3):252–66. doi: 10.1016/j.clim.2003.11.017. [DOI] [PubMed] [Google Scholar]
- 3.Verch T, Bakhtiar R. Miniaturized immunoassays: moving beyond the microplate. Bioanalysis. 2012;4(2):177–88. doi: 10.4155/bio.11.301. [DOI] [PubMed] [Google Scholar]
- 4.Soderstrom CI, Spriggs FP, Song W, Burrell S. Comparison of four distinct detection platforms using multiple ligand binding assay formats. J Immunol Methods. 2011;371(1–2):106–13. doi: 10.1016/j.jim.2011.06.020. [DOI] [PubMed] [Google Scholar]
- 5.Zambito F KA, Zhang Y, DeSilva B. Development of a PK immunoassay for a therapeutic monoclonal antibody using optimiser technology. Poster presented at: National Biotechnology Conference. 2013 May 22–23; San Diego CA.
- 6.Yan ZH, Madison LL, Burkhardt A, Yu J, Tayber O, Li Z, et al. Analysis of two pharmacodynamic biomarkers using acoustic micro magnetic particles on the ViBE bioanalyzer. Anal Biochem. 2011;410(1):13–8. doi: 10.1016/j.ab.2010.11.012. [DOI] [PubMed] [Google Scholar]
- 7.Collins CM, Yui S, Roberts CE, Kojic I. Thrombin detection using a piezoelectric aptamer-linked immunosorbent assay. Anal Biochem. 2013;443(1):97–103. doi: 10.1016/j.ab.2013.08.019. [DOI] [PubMed] [Google Scholar]