Abstract
Current multi-analytes chips are limited with requiring numbers of sensors, complex synthesis and compounds screen. It is expected to develop new principles and techniques to achieve high-performance multi-analytes testing with facile sensors. Here, we investigated the correlative multi-states properties of a photochromic sensor (spirooxazine), which is capable of a selective and cross-reactive sensor array for discriminated multi-analytes (11 metal ions) detection by just one sensing compound. The multi-testing sensor array performed in dark, ultraviolet or visual stimulation, corresponding to different molecular states of spirooxazine metal ions coordination. The facile photochromic microchip contributes a multi-states array sensing method, and will open new opportunities for the development of advanced discriminant analysis for complex analytes.
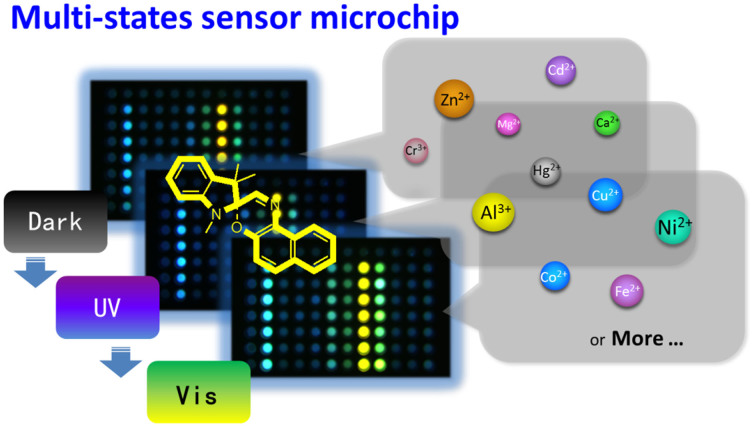
There is an increasing need of convenient, rapid, sensitive and high-throughput sensors for target multi-analytes identification in the environmental monitoring1,2,3,4, aliment safety5,6, clinical diagnoses7,8,9,10,11,12,13,14, and so on15,16. Sensor arrays are a verified valid detection method in the area of multi-analytes testing and high-throughput analysis17,18,19,20. Currently, a graphene-based ensemble aptamers were exploited to recognize molecular or cellular targets discriminatively10. Cui et al. developed a sensor array assembled from polyionic liquid inverse opaline microspheres to test five anions16. Generally, the sensor array performed the correlative differential analyzing needs large numbers of serial compounds or complicated compound with several recognition groups as sensor, which involves complicated chemical synthesizing and valid compounds screening. Examples include adopting six various 8- hydroxy-quinoline derivants to realize metal ions detection21, designing sensor combining four hydrophobic recognition groups to take molecular diagnostics22, seven sensors utilized a common calix[4]pyrrole receptor to detect 14 carboxylates23. Although the serial sensors own high sensitivity, the high production cost and challenges regarding valid compounds screen restrict their practical applications. These facts call for a reliable sensor to alleviate these concerns for general high-performance multi-analytes detection. Here, we adopt a photochromic material, spirooxazine, to multi-testing sensor array, and utilize the multi-states of the sensing array under stimulations acting the selective and cross-reactive sensing (Fig. 1). This photochromic sensor microchip can actualize eleven various metal ions detection with only one facile sensor, which offers a new strategy to design and develop high-performance multi-testing sensor array.
Figure 1. The schematic illustration of the photochromic multi-states sensing for multi-analytes metal ions detection with one spirooxazine sensor.
Three states (dark, UV irradiation and Vis irradiation) of spirooxazine-metallic coordination can be obtained by spirooxazine response with metal ions in different irradiation conditions.
Spiropyran and spirooxazine (SP), which respond to different external stimulations, such as light, proton and metal ions to undergo reversible structural interconversion accompanied the change in photophysical properties, are of interest in the emerging area of logic gates and communication networks24,25,26, molecular switches and unit27,28, data storage29, metal ions detection and other fields30,31,32,33,34,35,36,37. With different light stimulations, spiropyran and spirooxazine interconvert among the closed form to merocyanine form (MC). The merocyanine spiropyran/spirooxazine can combine with proton or metal cations to form metallic merocyanine (MMC), as shown in Fig. 224,25,26,30,31,32,33,34,35,36,37. Performing the reversible reactions between closed, MC and MMC forms of spiropyran/spirooxazine, different ions strength and light stimulations have the differential inductive effect. It gives abundant chemical information in forms of interconvert processing, which can be adopted to high-throughput and complex analysis. Since fluorescent detection owns the significant advantages of high-sensitive, quick-response and non-contacting, we choose a commercial spirooxazine: 1, 3, 3-trimethylindolinonaphthospirooxazine to build a photochromic sensor microchip for high-performance multiplex metal ions detection.
Figure 2. The interconverts of spirooxazine among the closed form, merocyanine (MC) form and metallic merocyanine (MMC) form.

Results
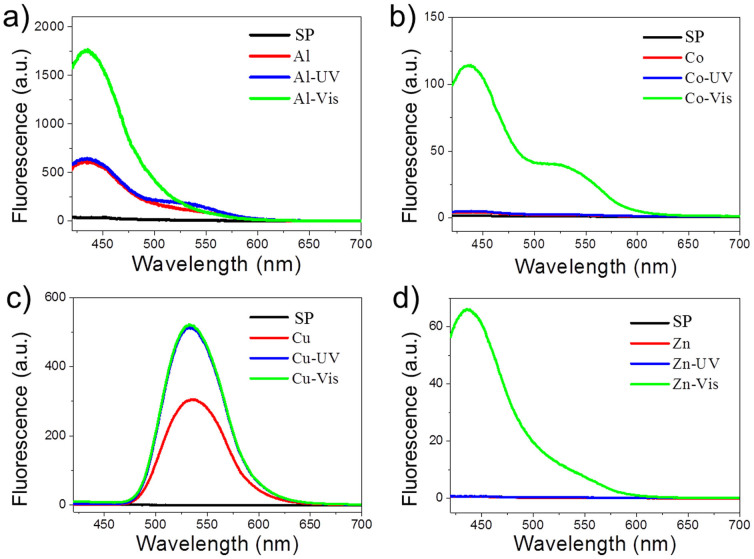
Fig. 3 displays the typical fluorescence spectra of spirooxazine in ethanol (1.0 mM) response with metal ions in different light-stimulations. Spirooxazine combining with Al3+ has obvious fluorescence increasement, ultraviolet (UV) light irradiation grows the 533 nm fluorescence and visible (Vis) light irradiation drastically increases the fluorescent peak of 435 nm. In the case of spirooxazine response with Co2+, Vis light stimulation increases the peaks of 435 and 533 nm of the fluorescent spectra. Cu2+ has the strong coordinating ability with spirooxazine/spiropyran and results in the closed form ring-open. The spirooxazine-Cu2+ coordination generates a medium fluorescence. UV and Vis irradiation further enhance the fluorescence at 533 nm. Spirooxazine-Zn2+ coordination dose not contribute the obvious fluorescence when prime stain and UV irradiation. The electron transfer from Zn2+ to organic ligand under Vis irradiation contributes a weak fluorescence emission. The change of fluorescence spectra of spirooxazine combined with Al3+, Co2+, Cu2+, Zn2+ under dark, UV and Vis irradiation are focus at the wavelength of 435 nm and 533 nm because of the light stimulations induce the merocyanine of the spirooxazine-metallic coordinations partly convert to open or closed form. Furthermore, when this sensing system was adopted in cross-reactive array sensing, fluorescent signals were collected in the same condition at the same time, which will avoid error from excitation light source glint, detector fatigue. Accurate chemical difference was present in this sensing array system. The phenomena that spirooxazine-metallic coordinations reveal various fluorescent spectra in different light stimulations demonstrate the sensing molecular spirooxazine can provide multiple fluorescent signals, which will contribute to the photochromic sensor microchip selective and cross-reactive testing.
Figure 3. The fluorescence of spirooxazine response to various metal ions with different light irradiations.
The typical fluorescent spectra of spirooxazine in ethanol (1.0 mM) response with Al3+, Co2+, Cu2+, Zn2+ (1.0 mM) in dark, after UV-light or Vis-light irradiation, respectively.
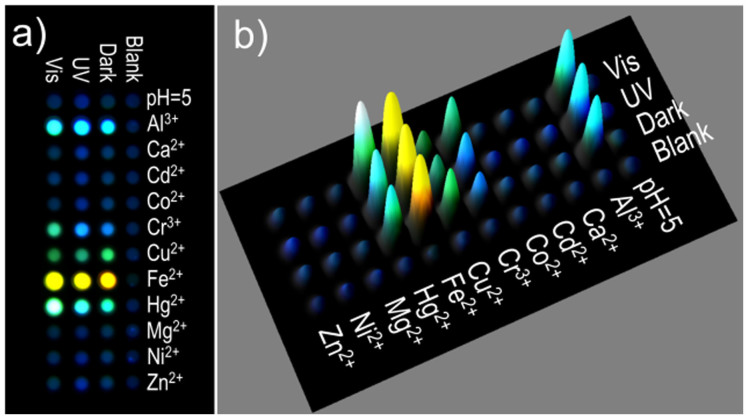
Based on the fluorescent enhancement or shift of different spirooxazine-metallic coordination states, we designed a microchip adopting spirooxazine as the only one sensor, analysing the fluorescent signals to realize multiple metal ions detection. To generate the cross-reactive SP microchip, we carried out 1.0 mM 1, 3, 3-trimethylindolinonaphthospirooxazine and thermoplastic polyurethane Tecoflex® (0.5% PU in Ethanol) solution (200 nL) pipetted onto each pixel of the microchip. Here we used PU as the interface medium for the sensing in each pixel. PU is a block polymer with terephthalic acid units and ethylene glycol units, which is solvable in ethanol and swellable in water. On this microchip, AlCl3, CaCl2, CdCl2, CoCl2, CrCl3, CuCl2, FeCl2, HgCl2, MgCl2, NiCl2 and ZnCl2 (1.0 mM in water, 200 nL, pH = 5) and pH = 5 control aqueous solutions (HCl-NaCl) were spotted on corresponding pixels in 12 rows respectively. The fluorescence responses of the photochromic spirooxazine microchip to the presence of 11 metal ions (Al3+, Ca2+, Cd2+, Co2+, Cr3+, Cu2+, Fe2+, Hg2+, Mg2+, Ni2+ and Zn2+) were recorded in 6 channels (CH 1: 450 nm, CH 2: 480 nm, CH 3: 505 nm, CH 4: 535 nm, CH 5: 570 nm and CH 6: 605 nm, with UV 365 nm excitation). The colours were generated by superimposing of the equally weighed images corresponding to RGB channels. Dark, UV and Vis stimulation resulted in the spirooxazine microchip displaying various fluorescent signals. For better comparing the fluorescent difference of dark, UV and Vis process, rows from each light irradiation steps were selected to constitute Fig. 4. The fluorescent image in Fig. 4b displays obvious different fluorescence intensity and shift for each row, which will contribute more information for high-performance multi-testing.
Figure 4.
(a) Fluorescent image and (b) 3D representation of the integrated fluorescence intensity of the photochromic SP microchip constitute from rows from each light irradiations process of the photochromic microchip. The Fluorescent image of photochromic microchip spotted by metal ions (1.0 mM in water, 200 nL), which was recorded in 6 different channels. The colours were generated by superimposing of the equally weighed images corresponding to RGB channels.
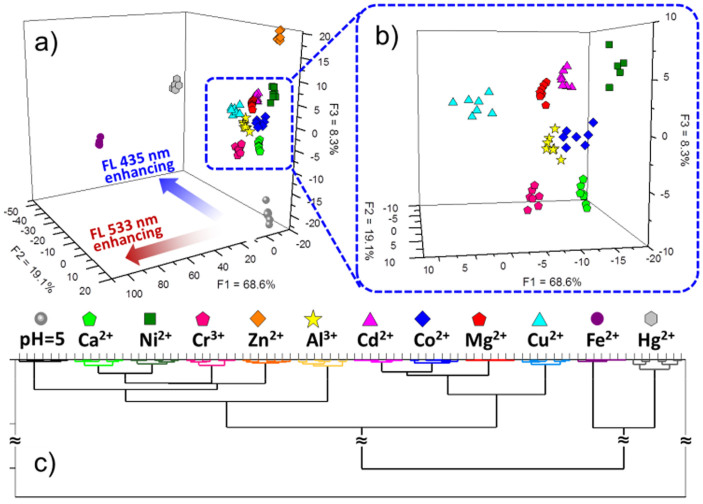
The discriminatory capability of the photochromic SP microchip can be performed using multivariate analysis. Linear discriminant analysis (LDA) was used to evaluate the similarities between the data corresponding to the same cluster by introducing the group classification38,39,40,41,42. LDA provides a graphic representation useful to gain an insight into the clustering of the response data, and to calculate classification accuracy. Fig. 5a, b represent the LDA score plot of the first three dispersion factors (F1–F3) describing of the total variance, which displays the clear clustering of the data. Since LDA trains the data to describe the best-fit parameters to separate different clusters, the distance of the cluster in spatial distribution reveals differential fluorescent signal of the metal ions. Obviously, the LDA score plot shows clustering for all 12 samples (7 trials each, 1.0 mM). It gives the 100% correct clustering of the eleven metal ion samples and one control sample water pH = 5 (Table S1, Supporting Information [SI]). The clusters were separated in the space of differential fluorescence peak (435 or 533 nm) distribution orientation. Furthermore, we also adopted hierarchical clustering analysis (HCA) to carrier out multivariate analysis. HCA performs dimensionality reduction analysis to investigate the similarity clustering of the analytes. In this work, we defined the cluster by Ward's (minimum variance) method43, which takes into consideration the minimum amount of variance between the samples. The HCA result shows a dendrogram of euclidean distance between 84 samples with ward linkage in Fig. 5c and Fig. S1. HCA graphical output displays three major groups, which indicates fluorescent variation trend of the different states of spirooxazine-metallic coordination. Overall evaluating the LDA and HCA, the results reflect the original information of sensing, which indicates subtle and accurate details for the photochromic SP microchip sensing various metal ions. The spirooxazine-metallic responses focus on the two major peaks of 435 and 533 nm on fluorescence spectra. The different fluorescence intensity ratios between 435 and 533 nm reveal various classification contributions of photochromic SP microchip in different light stimulations.
Figure 5. Fluorescent discriminant analysis of 11 metal ions on SP multi-states microchip and rational analysis.
(a, b) Graph of LDA result shows a clear clustering of the 11 metal ions analytes and its corresponding magnified image. LDA reflects analytes specific fluorescent enhancement at 435 nm or 533 nm due to various metal electropositivity. The gathering of the clusters demonstrates the good repeatability of the SP multi-states microchip for each metal ion response. (c) HCA gives the similarity clustering of the analytes based on the fluorescent variation trend of the spirooxazine-metallic coordination in three states.
Discussion
To evaluate the classification efficiency of the photochromic SP microchip with various states, we explored the LDA of SP array in dark, UV or Vis stimulation state separately (Table S2–S4). None of the single state of SP array can result in a completely correct classification individually. The LDA results showing in Table S5 displays the near and confused spatial distribution of the clusters in each single state of SP array, which reveals the small differential of fluorescent signals of the metal ions in these analysis systems. In details, the SP sensing array in dark state can discriminate Al3+, Cr3+, Cu2+, Fe2+, Hg2+, Mg2+, Ni2+ and Zn2+, and cannot correctly analysis Ca2+, Cd2+, Co2+ and pH = 5. UV state does not improve the general accuracy than dark state, but it increases the accurate rate for Ca2+ identification and help to distinguish misclassed Co2+ from control (pH = 5). In the case of Vis state, the microchip generates the clear identification of Al3+, Cd2+, Co2+, Cr3+, Cu2+, Fe2+, Hg2+, Mg2+, Zn2+ and pH = 5, only has deficiency at Ca2+ and Ni2+. The three states are highly complementary in distinguishing metal ions. It guarantees the integrated SP multi-states array to perform the 100% correct clustering of the eleven metal ion samples with one control sample.
The key point of sensor array successful in multi-targets analysis is to provide enough differential and correlative signals. However, most single sensing molecule lacks enough differential signals to correctly cluster of the multi-analytes. Previous researches usually focused on developing serial sensors to get correlatively differential messages7,8,9,10,11,12,13,14,15,16,17,18,19,20,21. The strategies usually are preparing sensor array with serial sensor compounds to plus and fold the correlative response difference, or synthesizing special and complex sensor compound to generate obviously discriminated response. Here, the single photochromic sensing compound gives a strong correlativity between the configurations interconverting under different light stimulations. The differential states under dark, UV and Vis stimulation generate differential and correlative signals, which perform as three serial sensors adopted in this sensing array and contribute to perform a correct discriminant analysis. By the well-known Kolmogorov's law of the iterated logarithm44, the relation of multi-targets analysis successful probability (P) and participant observation states (ni) can be deduced as (For the detailed deduction process, please see Supporting Information):
 |
There are many factors contribute to the probability of success of multi-targets analysis, here we focus on the influence of ni. The xij presents the classification of success. The mathematical deduction suggests the universality of the strategy applied in multi-targets analysis. It can be simply described as a monotonically increasing function. That is meaning the calculated probability of success obviously increases when the observation's number increases, which is well in agreement with experiment results. The multi-states analysis method guarantees the generated signals cross-reactive and differential, which realizes high-performed multi-analytes identification on a single sensing compound array, and avoids the complex process of serial synthesis and valid compound screening.
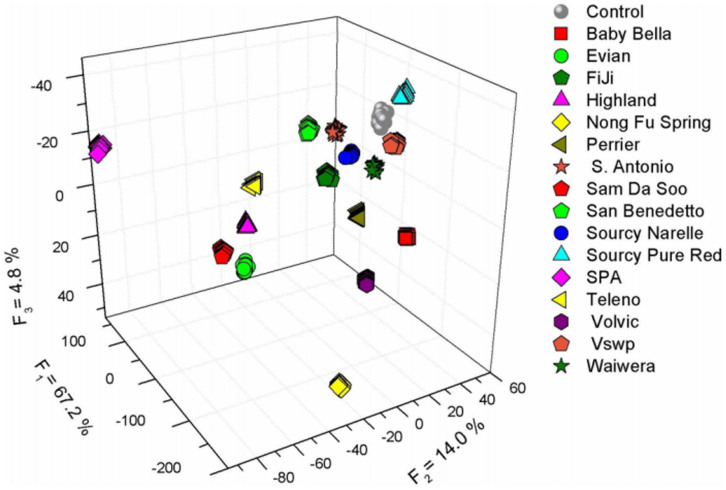
Encouraged by the results above, we explored the utility of the spirooxazine multi-states sensor array by exploring a potential application: identification of mineral and purified water (Milli-Q water) based on their cation content as shown in Fig. 6. Table 1 lists Ca2+ and Mg2+ contents for all of the mineral water brands. The pH levels of most brands are in the range of 6–7.8 (except the Sourcy pure red with pH = 4.7), where the sensor array presents a rather flat response. The list is clear that all 16 commercial potable water samples contain different concentrations of cations. LDA analysis shows a complete and clear 100% correct classification for all 255 trials (Figure S6). The study demonstrates that the photochromic SP microchip detection of metal ions can be generated into metal ions mixtures. Furthermore, we also processed the photochromic SP microchip for detecting metal ions in human serum (protein removed), and the LDA result displays 100% classification accuracy (Fig. S2, Table S7). The result suggests its potential applications in complex physiological environment.
Figure 6. LDA score plot corresponding to the response of the SP microchip to 16 kinds of natural mineral water comes from various countries.
The data set contains 16 brands and 1 control, 15 trials each. LDA shows 100% correct classification for all water brands.
Table 1. Metal ion content for different brands of mineral water samples. The samples contain different kinds and concentrations of metal ions.
| Metal Ion Content (mg/L) | |||||||
|---|---|---|---|---|---|---|---|
| Mineral Water | Ca | Mg | pH | Mineral Water | Ca | Mg | pH |
| Baby Bella | 53.3 | 14.9 | - | Evian | 80 | 26 | 7.2 |
| FIJI | 17.5 | - | 7.7 | Highland | 40 | 10.1 | 7.8 |
| Nong Fu Spring | 40 | 5 | 7.3 | Perrier | 160 | 4.2 | - |
| S. Antonio | 32.4 | 5.3 | 7.9 | Sam Da Soo | 2.9 | 1.9 | 7.7 |
| San Benedetto | 50.3 | 30.8 | 7.52 | Sourcy Naturelle | 54 | 4.5 | 7.5 |
| Sourcy Pure Red | 54 | 4.5 | 4.7 | SPA | 4.5 | 1.3 | 6 |
| Teleno | 6 | 1.2 | - | Volvic | 11.5 | 8.0 | 7 |
| Vswp | 45 | 51 | - | Waiwera | 12 | 2.6 | 7.6 |
In conclusion, utilizing interconversion of photochromic materials, we developed a high-performance multi-analytes sensor array with a single compound. Significantly, this sensor array is capable of identification of 11 metal ions, based on multi-states of spirooxazine in UV and Vis irradiations. The successful discriminating of various natural mineral water samples proves the photochromic SP microchip practical application in mixed and complicated analysis. It contributes a new idea of stimulated (photo-, electro-, magnet-, thermo-, chemo-, etc) conversion sensor array for multi-testing, which will have implicative applications in chemical, biological or medicinal samples testing. The future complex sample detections for pollution monitoring, aliment safety and clinical diagnoses will be facile, efficiency and low-cost with the high-performance sensing and analysis method.
Methods
Fluorescence testing
A UV LED lamp with the wavelength of 245 nm was used as the UV illumination source. Fluorescence measurements were performed in a Hitachi F-4500 Fluorescence Spectrophotometer. The absorption spectra were measured with a fiber optic UV-Vis-IR spectrometer (Ocean Optic HR 4000 CG).
Microchip sensing
1.0 mM 1, 3, 3-trimethylindolino-naphthospirooxazine and thermoplastic polyurethane Tecoflex® (0.5% PU in Ethanol) solution (200 nL) was pipetted onto each pixel of the microchip. The microchip was performed to the multi-analytes testing (11 metal ion plus the pH = 5 control solution). On the microchip, AlCl3, CaCl2, CdCl2, CoCl2, CrCl3, CuCl2, FeCl2, HgCl2, MgCl2, NiCl2 and ZnCl2 (1.0 mM in water, 200 nL, pH = 5) and pH = 5 control aqueous solutions (HCl-NaCl) were spotted on corresponding pixels respectively. The fluorescence responses of the microchip to different metal ions were recorded by fluorescence scanner (ChampChemi Professional+) in six channels (CH1: 450 nm, CH2: 480 nm, CH3: 505 nm, CH4: 535 nm, CH5: 570 nm and CH6: 605 nm, with 365 nm UV light excitation). The data processing consisted on the integration of the fluorescence intensity per pixel of the microchip before and after the solutions of metal ions spotted.
Data analysis
The statistical multivariate methods, LDA and HCA38,39,40,41,42 are routinely used to interpret and evaluate the responses from cross-reactive sensor arrays, providing a graphical output useful to gain an insight into the clustering of the response data, and calculate classification accuracy. The metal ion spots were formed on microchip and record in six channels by fluorescence scanner. The LDA was carried out using SYSTAT® v12.02.00 and the HCA was carried out using Minitab® v16.1.1.0.
Author Contributions
Y.H., F.L. and Y.S. conceived and designed the experiments. Y.H., F.L. and M.Q. performed the experiments. Y.H., F.L., C.Y. and W.R. analysed the data and wrote the manuscript. All authors reviewed the manuscript.
Supplementary Material
Supplementary Information
Acknowledgments
The authors thank the financial support by the National Nature Science Foundation (Grant Nos. 51203166, 51473172, 51173190, 21074139, 21073203, 91127029 and 21121001), 973 Program (Nos. 2013CB933004, 2011CB932303 and 2011CB808400), and the “Strategic Priority Research Program” of the Chinese Academy of Sciences (Grant No. XDA09020000). The Chinese Academy of Science is gratefully acknowledged.
References
- Lim S. H. et al. An optoelectronic nose for detection of toxic gases. Nat. Chem. 1, 562–567 (2009). [DOI] [PMC free article] [PubMed] [Google Scholar]
- Perry R. H. et al. Detecting reaction intermediates in liquids on the millisecond time scale using desorption electrospray ionization. Angew. Chem. Int. Ed. 50, 250–254 (2011). [DOI] [PubMed] [Google Scholar]
- Yang Y. J. et al. A highly selective low-background fluorescent imaging agent for nitric oxide. J. Am. Chem. Soc. 132, 13114–13116 (2010). [DOI] [PubMed] [Google Scholar]
- Xie Z. et al. An optical nose chip based on mesoporous colloidal photonic crystal beads. Adv. Mater. 26, 2413–2418 (2013). [DOI] [PubMed] [Google Scholar]
- Lavigne J. J. & Anslyn E. V. Sensing a paradigm shift in the field of molecular recognition: from selective to differential receptors. Angew. Chem. Int. Ed. 40, 3119–3130 (2001). [DOI] [PubMed] [Google Scholar]
- Huang Y., Li F. Y., Qin M., Jiang L. & Song Y. L. A multi-stopband photonic-crystal microchip for high-performance metal-ion recognition based on fluorescent detection. Angew. Chem. Int. Ed. 125, 7437–7440 (2013). [DOI] [PubMed] [Google Scholar]
- Buryak A. & Severin K. A chemosensor array for the colorimetric identification of 20 natural amino acids. J. Am. Chem. Soc. 127, 3700–3701 (2005). [DOI] [PubMed] [Google Scholar]
- Zaubitzer F. Buryak A. & Severin K. Cp*Rh-based indicator-displacement assays for the identification of amino sugars and aminoglycosides. Chem. Eur. J. 12, 3928–3934 (2006). [DOI] [PubMed] [Google Scholar]
- Liu W. et al. Photonic crystal encoded microcarriers for biomaterial evaluation. Small 10, 88–93 (2014). [DOI] [PubMed] [Google Scholar]
- Pei H. et al. Designed diblock oligonucleotide of DNA-gold nanoparticle nanoconjugates. J. Am. Chem. Soc. 134, 13843–13849 (2012). [DOI] [PubMed] [Google Scholar]
- Shao N. et al. A spiropyran-based ensemble for visual recognition and quantification of cysteine and homocysteine at physiological levels. Angew. Chem. Int. Ed. 45, 4944–4948 (2006). [DOI] [PubMed] [Google Scholar]
- Adams M. & Anslyn E. V. J. Am. Chem. Soc. 131, 17068–17069 (2009). [DOI] [PubMed] [Google Scholar]
- De M. et al. Sensing of proteins in human serum using nanoparticle-green fluorescent protein conjugates. Nat. Chem. 1, 461–465 (2009). [DOI] [PMC free article] [PubMed] [Google Scholar]
- Miranda O. et al. Enzyme-amplified array sensing of proteins in solution and in biofluids. J. Am. Chem. Soc. 132, 5285–5289 (2010). [DOI] [PMC free article] [PubMed] [Google Scholar]
- Grinthal A. & Aizenberg J. Adaptive all the way down: building responsive materials from hierarchies of chemomechanical feedback. Chem. Soc. Rev. 42, 7072–7085 (2013). [DOI] [PubMed] [Google Scholar]
- Cui J. et al. Inverse opal sphere based on polyionic liguids as functional microspheres with tunable optical properties and molecular recognition capabilities. Angew. Chem. Int. Ed. 53, 3844–3848 (2014). [DOI] [PubMed] [Google Scholar]
- Carey J. et al. Rapid identification of bacteria with a disposable colorimetric sensing array. J. Am. Chem. Soc. 133, 7571–7576 (2011). [DOI] [PMC free article] [PubMed] [Google Scholar]
- Bajaj A. et al. Array based sensing of normal, cancerous and metastatic cells using conjugated fluorescent polymers. J. Am. Chem. Soc. 132, 1018–1022 (2010). [DOI] [PMC free article] [PubMed] [Google Scholar]
- Greene N. & Shimizu K. D. Colorimetric molecularly imprinted polymer sensor array using dye displacement. J. Am. Chem. Soc. 127, 5695–5700 (2005). [DOI] [PubMed] [Google Scholar]
- Rochat S. et al. Cross-reactive sensor arrays for the detection of peptides in aqueous solution by fluorescence spectroscopy. Chem. Eur. J. 16, 104–113 (2010). [DOI] [PubMed] [Google Scholar]
- Palacios M. A. et al. Rational design of a minimal size sensor array for metal ion detection. J. Am. Chem. Soc. 130, 10307–10314 (2008). [DOI] [PubMed] [Google Scholar]
- Rout B., Unger L., Armony G., Iron M. A. & Margulies D. Medication detection by a combinatorial fluorescent molecular sensor. Angew. Chem. Int. Ed. 51, 12477–12481 (2012). [DOI] [PubMed] [Google Scholar]
- Liu Y. et al. Sensing of carboxylate drugs in urine by a supramolecular sensor array. J. Am. Chem. Soc. 135, 7705–7712 (2013). [DOI] [PubMed] [Google Scholar]
- Kubinyi M. et al. Metal complexes of the merocyanine form of nitrobenzospyran: structure optical spectra, stability. Journal of Molecular Structure 1000, 77–84 (2011). [Google Scholar]
- Guo X. F., Zhang D. Q. & Zhu D. B. Logic control of the fluorescence of a new dyad, spiropyran-perylene diimide-spiropyran, with light, ferric Ion, and proton: construction of a new three-input “AND” logic gate. Adv. Mater. 16, 125–130 (2004). [Google Scholar]
- Kato S. et al. Homoconjugated push-pull and spiro systems: intramolecular charge-transfer interactions and third-order optical nonlinearities. Angew. Chem. Int. Ed. 49, 6207–6211 (2010). [DOI] [PubMed] [Google Scholar]
- Tian H. et al. A single photochromic molecular switch with four optical outputs probing four inputs. Adv. Mater. 15, 2104–2107 (2003). [Google Scholar]
- Bahr L. et al. Photoswitched singlet energy transfer in a porphyrin-spiropyran dyad. J. Am. Chem. Soc. 123, 7124–7133 (2001). [DOI] [PubMed] [Google Scholar]
- Yuan W. F. et al. A novel thermally stable spironaphthoxazine and its application in rewritable high density optical data storage. Adv. Mater. 17, 156–160 (2005). [Google Scholar]
- Ren J. Q. & Tian H. Thermally stable merocyanine form of photochromic spiropyran with aluminum ion as a reversible photo-driven sensor in aqueous solution. Sensors 7, 3166–3178 (2007). [DOI] [PMC free article] [PubMed] [Google Scholar]
- Natali M. & Giordani S. Interaction studies between photochromic spirospyrans and transition metal cations: the curious case of copper. Org. Biomol. Chem. 10, 1162–1171 (2012). [DOI] [PubMed] [Google Scholar]
- Zakharova M. et al. Quantitative investigations of cation complexation of photochromic 8-benzothiazole-substituted benzopyran: towards metal-ion sensors. Photochem. Photobiol. Sci. 9, 199–207 (2010). [DOI] [PubMed] [Google Scholar]
- Fies K. et al. Spectroscopic analysis of metal ion binding in spiropyran containning copolymer thin films. Anal. Chem. 82, 3306–3314 (2010). [DOI] [PubMed] [Google Scholar]
- Fries K. et al. Fabrication of spirophyran-containning thin film sensors used for the simultaneous identification of multiple metal ions. Langmuir 27, 12253–12260 (2011). [DOI] [PubMed] [Google Scholar]
- Nishikiori H. et al. Photochromic behavior of spironaphthoxazine in metal ion-containing solutions. Journal of Photochemistry and Photobiology A: Chemistry 222, 236–240 (2011). [Google Scholar]
- Zakharova M. I. et al. Thermodynamic and kinetic analysis of metal ion complexation by photochromic spiropyrans. RUSSIAN CHEMICAL BULLETIN. 58, 1329–1337 (2009). [Google Scholar]
- Zhang H. T. et al. Interface engineering of semiconductor/dielectric heterojunctions toward functional organic thin-film transistors. Nano Lett. 11, 4939–4946 (2011). [DOI] [PubMed] [Google Scholar]
- Shabbir S. H., Regan C. J. & Anslyn E. V. A general protocol for creating high-throughput screening assays for reaction yield and enantiomeric excess applied to hydrobenzoin. Proc. Natl. Acad. Sci. U.S.A. 106, 10487–10492 (2009). [DOI] [PMC free article] [PubMed] [Google Scholar]
- Umali A. P. & Anslyn E. V. A general approach to differential sensing using synthetic molecular receptors. Curr. Opin. Chem. Biol. 14, 685–692 (2010). [DOI] [PMC free article] [PubMed] [Google Scholar]
- Beebe K. R., Pell R. J. & Seasholtz M. B. In Chemometrics: a practical guide. (Wiley: New York, 1998). [Google Scholar]
- Otto M. In Chemometrics: Statistics and computer application in analytical chemistry. (Wiley-VCH: New York, 1999). [Google Scholar]
- Jambu M. In Exploratory and MultiVariate Data Analysis. (Academic Press, San Diego, 1991). [Google Scholar]
- Ward J. H. Hierarchical grouping to optimize an objective function. J. Am. Stat. Assoc. 58, 236–244 (1963). [Google Scholar]
- Kolmogoroff A. Über das Gesetz des iterierten Logarithmus. Mathematische Annalen 101, 126–135 (1929). [Google Scholar]
Associated Data
This section collects any data citations, data availability statements, or supplementary materials included in this article.
Supplementary Materials
Supplementary Information


