Abstract
The microheterogeneity of large sugar chains in glycopeptides from S-layer glycoproteins containing up to 51 monosaccharide residues at a single O-attachment site on a 12 amino acid peptide backbone was investigated by Fourier transform ion cyclotron resonance mass spectrometry (FTICR MS). Structural elucidation of glycopeptides with the same amino acid sequence and different glycoforms, having such a high saccharide-to-peptide ratio, was achieved by applying infrared multiphoton dissociation (IRMPD) MS/MS for the first time. A 100% sequence coverage of the glycan chain and a 50% coverage of the peptide backbone fragmentation were obtained. The microheterogeneity of carbohydrate chains at the same glycosylation site, containing largely rhamnose, could have been reliably assessed.
Glycoproteins play a crucial role in recognition, signaling, and adhesion processes on the surfaces of cells. Many of these functions are mediated by the oligosaccharide chains. Glycosylated surface layer (S-layer) proteins represent one of the best-studied, prokaryotic glycoproteins.1,2 They are found in bacteria and archaea, where they form the outermost layer on the cell envelope. They are able to assemble into two-dimensional, crystalline arrays on the cell surface yielding a complete coverage of the bacterial cells. To date, about 40 different bacterial S-layer glycoprotein glycan structures are fully or at least partially elucidated. S-layer glycan chains are linear or branched homo- or heterosaccharides, which comprise 20–50 identical repeating units of 2–6 sugar residues. The monosaccharide constituents of the S-layer glycan chains include a wide range of neutral hexoses, 6-deoxyhexoses, and amino sugars.3 Interestingly, no antennary structures comparable to N-glycans present in eukaryotes have been identified so far among S-layer glycoproteins. Most of the bacterial S-layer glycoproteins follow a tripartite building plan, in which a variable carbohydrate chain is O-glycosidically linked via a core oligosaccharide to tyrosine, threonine, or serine of the S-layer polypeptide backbone. At the nonreducing end of the S-layer glycan chains of several strains, modifications such as 3-O-methyl or 2-O-methyl groups4–6 or N-acetylmuramic acid7 have been found. Nonreducing terminal modifications have recently been shown to determine the chain length of O-antigens of Escherichia coli.8
The structural architecture of S-layer glycans has been so far analyzed primarily by nuclear magnetic resonance (NMR), while electrospray ionization (ESI) quadrupole time-of-flight (QTOF) and matrix-assisted laser desorption/ionization (MALDI)TOF mass spectrometry (MS) screening was carried out mainly to confirm a general pattern of the glycan distribution.4,7 Mass spectrometry is presently the most appealing tool for biomolecular analysis due to its capability for the identification of intact ionic analyte species from biological material, either as purified samples or as complex mixtures with high sensitivity and superior accuracy. High sensitivity and provision of information on molecule identity like its sequence are the driving attributes for increased efforts toward MS-based studies in glycomics.9–15 Given the polymorphism associated with glycoprotein structures, high challenges for reliable and straightforward carbohydrate characterization have to be faced.14,15 O-linked glycans are inherently more challenging for a direct MS analysis as compared to other glycans, due to several intrinsic factors, like the absence of a general amino acid consensus sequence for the sugar attachment to the peptide chain, because of a high variety of possible carbohydrate core types at the attachment site and polymorphism of the sugar chain length and their branching patterns.14,15 In this context, an analysis by Fourier transform ion cyclotron resonance (FTICR) MS performed under high resolution and accurate mass determination can address a majority of requirements related to carbohydrate structure parameters.16–20
Apart from the accurate identification of carbohydrates present in complex biological mixtures by FTICR MS, particular efforts are focused toward exploring the best suited FTICR fragmentation methods for a full coverage of structural details. We have recently shown that nanoESI/FTICR and chip-enhanced ESI/FTICR sustained off-resonance ionization collision-induced dissociation (SORI–CID) are powerful analytical tools for characterization of sialylation pattern of glycopeptides,21,22 while by electron-capture dissociation (ECD) the formation of glycosylated peptide fragment ions leads to the determination of glycosylation sites.23–26
Within the present study an ESI/FTICR MS protocol for profiling and structural analysis of glycopeptides containing in average 48 monosaccharide residues by infrared multiphoton dissociation (IRMPD) has been developed. This first report on MS sequencing and structure determination of glycopeptides of molecular mass >8 kDa by FTICR-based methods has been exemplified by an S-layer glycopeptide preparation from Geobacillus stearothermophilus with single O-linked glycan chains with different glycoforms at Ser794.
MATERIALS AND METHODS
Reagents and Materials
Methanol, formic acid (98%), and analytical grade water were purchased from Merck (Darmstadt, Germany) and used without further purification. Aqueous solutions were dried in a SpeedVac SPD 111V evaporator (Savant, Düsseldorf, Germany). For MS investigation, a solvent system consisting of water/methanol/formic acid (49/49/2, v/v/v %) was used. Prior to analysis the sample/methanol solutions were centrifuged for 30 min in an Eppendorf model 5415 C centrifuge (Hamburg, Germany).
Sample
S-layer glycoprotein of G. stearothermophilus NRS 2004/3a was purified according to a standard procedure,27 and individual glycopeptide fractions were prepared as described previously.4 Briefly, the S-layer glycoprotein was degraded with Pronase E (Sigma Aldrich), and individual glycopeptide fractions containing a single peptide moiety were isolated by subsequent chromatography, size exclusion and ion-exchange chromatography, chromatofocussing, and semipreparative RP (C18) HPLC,4 and used for further experiments. The glycopeptide fractions were finally dried in a SpeedVac and stored at −20 °C. For the stock solution 100 μg of glycopeptides were dissolved in 20 μL of water (500 pmol μL−1). The working aliquots of 7 pmol μL−1 of the O-glycosylated peptide 790ALTLSADVIRVD801 were prepared by drying the stock solution and further dissolving in water/methanol/formic acid (49/49/2, v/v/v %).
Mass Spectrometry
Mass spectrometric experiments were performed by use of a Bruker Apex II Fourier transform ion cyclotron resonance mass spectrometer (FTICR MS) (Bruker Daltonik, Bremen, Germany) equipped with a 9.4 T superconducting actively shielded magnet (Magnex Scientific Ltd., Oxford, U.K.). Gas-phase ions were generated from the sample solution in the positive ion mode by nanoelectrospray ionization. The capillary voltage was varied within 320–850 V, and the capillary exit voltage was tuned within 35–75 V to promote efficient ionization of the glycopeptides and to enhance the detection of intact molecular ions. The drying gas (N2) was set to a flow of 20 L h−1, and the drying gas temperature was set to 70 °C for desolvation of the ions in the ESI source. The ESI-generated ions were accumulated for 2.5 s in the hexapole located after the second skimmer of the ion source and then transferred into the ICR cell. The time-of-flight delay used was set to 3.5 ms. Ions were trapped by Sidekick trapping at trapping potentials of 0.9 V (front plate) and 1.1 V (rear plate), respectively. Precursor ions were isolated by application of a broad-band excitation pulse to remove all ions except those of interest from the cell. The IRMPD MS/MS analysis was performed at 100 ms photon irradiation at 35–80% of laser power (Synrad, 48 series, 25 W, λ = 10.57–10.63 μm) to provide a fair coverage of the sequence ions. After a reaction delay of 0.5 s the fragment ions were detected. Excitation of ions within the ICR cell prior to detection was achieved by a broad-band excitation pulse with an amplitude of Vp–p = 50.2 V (pulse duration 20 μs). All mass spectra were externally calibrated by use of sodium trifluoroacetate and acquired in the broad-band mode with 1 M data points/scan. For data evaluation only those peaks exhibiting a sufficient signal-to-noise ratio to observe the corresponding isotopomeric peaks were included in the assignments. For the assignment of the species in Tables 1 and 2, respectively, the calculation of the theoretical masses has been carried out by using the values for atomic weights taken from De Laeter et al.28 and including the electron mass, cf., Mamer and Lesimple.29 Nomenclature of the glycan-containing fragment ions followed the rules established by Domon and Costello;30 for peptide fragment ions the nomenclature of Roepstorff and Fohlman31 was used.
Table 1. Most Abundant Ionic Species Detected by (+)NanoESI/FTICR MS in the S-Layer Glycopeptide Mixture and Their Corresponding Assignment.
| Ru | [M + 4H]4+ | Δm (ppm) | [M + 3H + Na]4+ | Δm (ppm) | |
|---|---|---|---|---|---|
| M1 | 14 | 1966.581 | 0.7947 | 1972.0749 | 0.0119 |
| M2 | 14 + Rha | 2003.0741 | 9.8927 | 2008.5969 | 3.7345 |
| M3 | 15 | 2076.1204 | 1.1899 | 2081.6254 | 3.3849 |
| M4 | 15 + Rha | 2112.6326 | 2.2479 | 2118.1254 | 3.5097 |
| M5 | 16 | 2191.1799 | 8.2663 | ||
| [M + 3H + K]4+ | Δm (ppm) | [M + 2H + 2Na]4+ | Δm (ppm) | ||
| M1 | 14 | 1976.0856 | 8.7004 | 1977.5629 | 3.7984 |
| M2 | 14 + Rha | 2014.0773 | 3.7671 | ||
| M3 | 15 | 2085.631 | 9.1892 | 2087.1106 | 1.5534 |
| M4 | 15 + Rha | 2122.1263 | 0.0085 | 2123.6184 | 4.6724 |
| M5 | 16 | 2196.6573 | 0.0116 | ||
| [M + H +3Na]4+ | Δm (ppm) | [M + 2H + 3Na]5+ | Δm (ppm) | ||
| M1 | 14 | 1983.0486 | 7.8962 | 1586.6549 | 0.4596 |
| M2 | 14 + Rha | 2019.5723 | 3.1875 | 1615.866 | 0.1526 |
| M3 | 15 | 2092.6077 | 0.0045 | 1674.2858 | 1.8623 |
| M4 | 15 + Rha | 2129.1197 | 1.1593 | 1703.5005 | 0.0003 |
| M5 | 16 | 1761.9200 | 2.0804 |
Table 2. Fragment Ions Detected by (+)NanoESI/FTICR–IRMPD MS/MS of the Quadruply Charged Precursor Ions of m/z 2076.120 Corresponding to the Ru = 15 Glycoform and Their Corresponding Assignmenta.
| m/z (exptl) | charge state | structure assignment | m/z (exptl) | charge state | structure assignment |
|---|---|---|---|---|---|
| 147.0649 | 1 | B1 | 1223.0664 | 2 | Y8 |
| 161.0805 | 1 | B1* | 1242.6708 | 1 | Z0 |
| 163.0598 | 1 | Y1/Y0 | 1260.6790 | 1 | Y0 |
| 169.0468 | 1 | B1# | 1296.1001 | 2 | Y9 |
| 185.0417 | 1 | Y1/Y0# | 1271.4889 | 2 | B17*# |
| 233.1127 | 1 | y2 | 1337.5090 | 1 | B9# |
| 239.0909 | 1 |
0,3X47/Y0/B46–H2O# or 3,5X48/Y0/B46–H2O# |
1344.5186 | 2 | B18*# |
| 257.1014 | 1 |
0,3X47/B46# or 3,5X48/Y0/B46# |
1351.5257 | 1 | B9*# |
| 275.1120 | 1 | B2–H2O | 1369.4503 | 2 | Y10 |
| 293.1225 | 1 | B2 | 1404.7199 | 1 | Z1 |
| 315.1045 | 1 | B2# | 1417.5810 | 2 | B19*# |
| 385.1485 | 1 |
0,3X47/Y0/B45-H2O# or 3,5X48/Y0/B45–H2O# |
1422.7299 | 1 | Y1 |
| 389.2136 | 1 | y3 | 1442.1545 | 2 | Y11 |
| 403.1591 | 1 |
0,3X47/Y0/B45 or 3,5X48/Y0/B45# |
1483.5663 | 1 | B10# |
| 439.1799 | 1 | B3 | 1490.5747 | 2 | B20*# |
| 461.1622 | 1 | B3# | 1497.5824 | 1 | B10*# |
| 475.1778 | 1 | B3*# | 1515.1197 | 2 | Y12 |
| 477.1365 | 1 | B3(K) | 1563.6388 | 2 | B21*# |
| 502.2979 | 1 | y4 | 1568.7865 | 1 | Y2 |
| 549.2166 | 1 |
0,3X47/Y0/B44# or 3,5X48/Y0/B44# |
1588.7016 | 2 | Y13 |
| 564.3231 | 2 | b11 | 1629.6243 | 1 | B11# |
| 585.2384 | 1 | B4 | 1636.6422 | 2 | B22*# |
| 601.366 | 1 | y5 | 1643.6409 | 1 | B11*# |
| 607.2200 | 1 | B4# | 1661.2169 | 2 | Y14 |
| 621.2357 | 1 | B4*# | 1710.1627 | 2 | B23*# |
| 630.8427 | 2 | Y0 | 1714.8474 | 1 | Y3 |
| 645.3495 | 2 | Y1/Y1 | 1775.6829 | 1 | B12# |
| 677.2633 | 1 |
0,3X47/Y0/B43–H2O# or 3,5X48/Y0/B43–H2O# |
1783.1948 | 2 | B24*# |
| 711.8683 | 2 | Y1 | 1789.6972 | 1 | B12*# |
| 716.3931 | 1 | y6 | 1856.2214 | 2 | B25*# |
| 731.2965 | 1 | B5 | 1860.9016 | 1 | Y4 |
| 753.2777 | 1 | B5# | 1921.7422 | 1 | B13# |
| 767.2934 | 1 | B5*# | 1929.2544 | 2 | B26*# |
| 784.8966 | 2 | Y2 | 1935.7594 | 1 | B13*# |
| 857.9263 | 2 | Y3 | 2002.2709 | 2 | B27*# |
| 877.3538 | 1 | B6 | 2006.9589 | 1 | Y5 |
| 899.3355 | 1 | B6# | 2067.7990 | 1 | B14# |
| 913.3508 | 1 | B6*# | 2081.8107 | 1 | B14*# |
| 930.9535 | 2 | Y4 | 2148.3278 | 2 | B29*# |
| 1003.9855 | 2 | Y5 | 2153.0157 | 1 | Y6 |
| 1045.3933 | 1 | B7# | 2213.8567 | 1 | B15# |
| 1059.4100 | 1 | B7*# | 2220.8808 | 2 | B30*# |
| 1077.0106 | 2 | Y6 | 2227.8723 | 1 | B15*# |
| 1150.0416 | 2 | Y7 | 2359.9124 | 1 | B16# |
| 1191.4511 | 1 | B8# | 2367.4345 | 2 | B32*# |
| 1205.4665 | 1 | B8*# | 2373.9205 | 1 | B16*# |
An asterisk
indicates fragment ions containing a methylated Rha residue; a pound sign
indicates sodiated fragment ions.
Note: “Ru” has been used to denote the number of repeating units. The peaks marked with “&” originate either from electronic noise or from detection of radio frequencies of unknown radiating sources.
RESULTS AND DISCUSSION
(+)NanoESI/FTICR MS of S-Layer Glycopeptides
The glycan chains of the S-layer glycoprotein of G. stearothermophilus NRS 2004/3a are composed of trisaccharide repeats. Primary structural analysis of its overall glycoforms performed by NMR spectroscopy4 revealed that the core unit consists of two l-rhamnoses (l-Rha), (→2)-α-l-Rhap-(1→3)-α-l-Rhap-(1→), which are O-glycosidically linked via a β-d-galactose to serine or threonine residues.32 Glycan chains were found to be composed on average of 15 identical l-rhamnose trisaccharide repeating units with the structure [→2)-α-l-Rhap-(1→3)-β-l-Rhap-(1→2)-α-l-Rhap-(1→]. The terminal rhamnose residue at the nonreducing end is modified on carbon-2 by O-methylation.4
Basic information on the glycan chain structure obtained by NMR and gel electrophoresis4 has been used to design mapping and sequencing experiments by ESI/FTICR MS. In the present study, the feasibility of this highly sensitive technique to assess the microheterogeneity of glycoforms on the same glycosylation site is based on accurate mass determination of intact ionic species, while a search for the most efficient sequencing conditions is necessary to identify the source of microheterogeneity.
The structural architecture of the S-layer glycopeptides from G. stearothermophilus NRS 2004/3a raises a particular challenge with respect to MS mapping and sequencing. The S-layer glycopeptide species chosen for MS analysis comprises 12 amino acids and on average 48 monosaccharide residues forming the neutral glycan chain. Large glycopeptides possessing a high saccharide-to-peptide ratio are expected to be highly prone to in-source decomposition by glycosidic bond cleavage and call therefore for special electrospray ionization and detection conditions. On the other hand, an efficient promotion of multiply charged ionic species is essential for their detection within a reasonable mass range of the instrument and a good resolution of the isotopic pattern as a critical issue for reliable peak deconvolution. Therefore, the ESI/FTICR MS study was designed to systematically adapt the ionization/detection parameters to favor the multiply charged ions formation of intact molecular species and consequently allow the complete glycan distribution assessment.
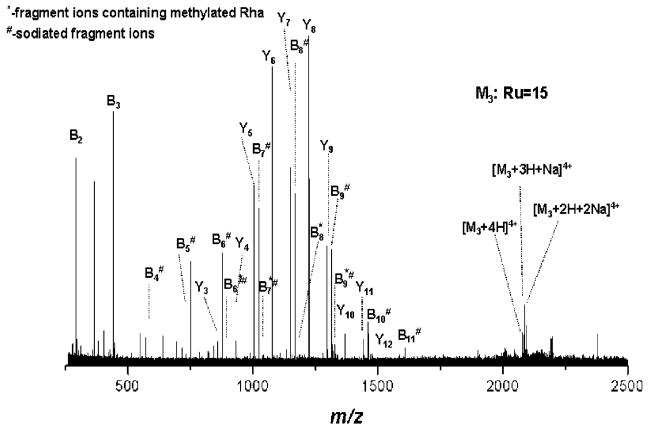
In previous ESI/FTICR MS analyses of glycopeptides in the negative ion mode we have shown that values of capillary exit voltage as high as 80 V for glycopeptides21,22 and 100–200 V for gangliosides16 were effective for a minimum in-source decay of labile attachments such as sialic acid, while for the positive ion mode detection other groups observed a capillary skimmer-induced dissociation (CSD) at values well above 100 V.19 In initial ESI/FTICR MS experiments of S-layer glycopeptides only a high degree of in-source fragmentation derived by the CSD process was observed for 70–100 V capillary exit voltage, whereas no ionic molecular species corresponding to intact glycoforms could be detected (data not shown). Obviously, to avoid the decay in the ion source the capillary exit voltage was stepwise adjusted to lower values. Variation of the hexapole accumulation time was also considered and appeared to have no contribution to reduction of the in-source glycosidic bond cleavages. In Figure 1, the (+)-nanoESI/FTICR MS of the glycopeptide mixture acquired at a capillary exit voltage of +54.4 V is presented, where the detection of the intact glycoforms was enhanced up to a certain level: the glycoform with 15 repeating units, corresponding to 14 trirhamnose repeats and a terminal O-methylated trisaccharide, was detected as quadruply charged ions along with its mono- and disodiated adducts. However, no signals of the other hypothetic homologous glycopeptides corresponding to Ru = 14 and/or Ru = 16 trirhamnose repeating units could have been detected. Interestingly, even under these relatively mild ionization conditions a high degree of CSD still occurred, as documented in the spectrum by the large number of intense singly and doubly charged species in the 200–1500 m/z range. Assignment of these peaks indicated a preferential cleavage of single glycosidic bonds, giving rise to formation of truncated glycopeptides. This aspect is clearly documented in Figure 1 by the Y-series of glycopeptide ions ranging from Y3–Y12 observed as highly abundant. A B-type ions series ranging from B2–B11 corresponding to glycan fragment ions, as well as four B-type ions carrying a methylated rhamnose residue, could be observed with lower abundance.
Figure 1.
(+)NanoESI/FTICR MS of the S-layer glycopeptide ATLTSAVDIRVD with a single glycosylation site at Ser794. Sample concentration, 7 pmol μL−1 in water/methanol/formic acid (49/49/2, v/v/v %); capillary exit voltage, 54.4 V. Beside highly abundant CSD fragment ions only quadruply charged glycopeptide species of low abundance with 15 repeat units are detected.
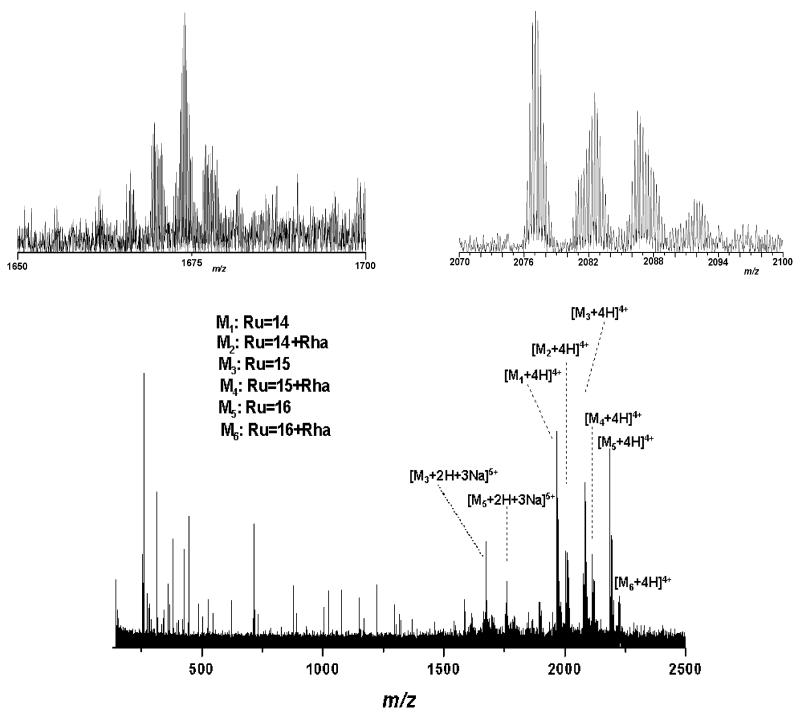
An optimum ionic yield, charge-state formation, and degree of in-source decay were obtained when decreasing the capillary exit voltage to 37.7 V (cf., Figure 2). Here, a complete distribution of the glycoforms containing Ru = 14–16 trirhamnose repeating units, represented by quadruply and quintuply charged ions, was detected. In addition, a homologous series, attributed to glycoforms with Ru = 14, 15, and 16 elongated by one rhamnose residue, could be clearly detected at high intensity and S/N ratio (Figures 2 and 3), in accordance with recently obtained data.32 The presence of this additional homologous glycopeptide series containing a chain extension by one rhamnose residue could not be deduced by NMR analysis and has been first postulated by a nanoESI/QTOF MS mapping experiment but not proved by sequencing.32 Yet, high mass accuracy is still required to unambiguously diagnose the presence of such a one rhamnose-extended glycoform series, especially for ions in the upper m/z ranges, as a glycopeptide series carrying a different peptide backbone arising from partial separation, or some other glycan modifications or adducts, can be presumably present. Accordingly, a functional approach for identification of multiple glycoforms has been provided by the ESI/FTICR MS method, where superior mass accuracy is a tool for an unambiguous evidence of the rhamnose-extended glycopeptide series (cf., Table 1). Since this variation was not recognized by an NMR experiment, the location of the additional Rha was hypothesized to be in the core rather than in the terminal unit1.32 First proof for core glycan variability was obtained from the S-layer glycoprotein of Aneurinibacillus thermoaerophilus DSM 10155 after chemical degradation of the S-layer glycopeptides glycan chains to produce short glycans and analysis by modified Edman degradation in combination with LC–MS.33
Figure 2.
(+)NanoESI/FTICR MS of the same S-layer glycopeptide (cf., Figure 1). Sample concentration, 7 pmol μL−1 in water/methanol/formic acid (49/49/2, v/v/v %); capillary exit voltage, 37.7 V. Inset: Enlarged area (2072-2100 m/z) showing the isotopic pattern of the quadruply charged ions of m/z 2076.120 corresponding the Ru = 15 glycoform and its sodiated adducts, respectively. Enlarged area (1650-1700 m/z) showing the isotopic pattern of the quintuply charged ions to the Ru = 15 glycoform. The most abundant species at m/z 1674.2858 corresponds to [M + 2H + 3Na]5+ of the Ru = 15 glycoform. The intensity of the CSD fragment ions is significantly reduced.
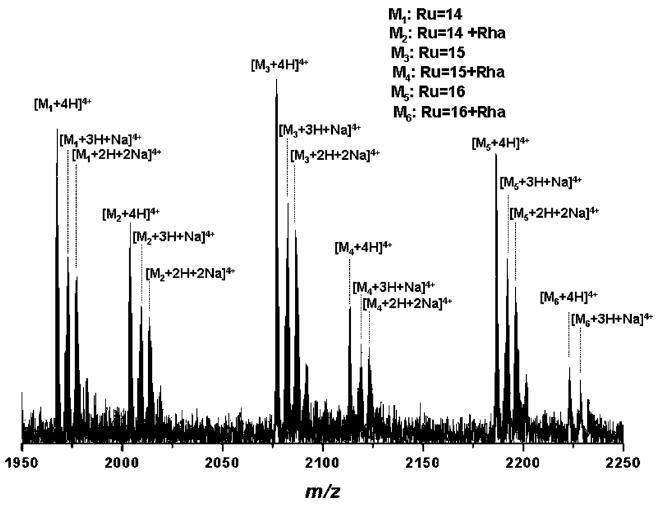
Figure 3.
Enlarged area (1950-2250 m/z) of the (+)nanoESI/FTICR MS of the same S-layer glycopeptide. Capillary exit voltage, 37.7 V.
In comparison to Figure 1, in Figure 2 a substantial decrease of the in-source decay is observed. Only up to three rhamnose residues were cleaved by in-source decay where the corresponding fragment ions are only of low abundance (Figure 2). Since the ion accumulation time in the hexapole was maintained for the spectrum in Figure 2 at the same value as in the previous experiment it is pertinent to deduce that the in-source decay obtained previously (see Figure 1) is more likely attributable to capillary exit voltage and less likely to multipole storage-assisted dissociation, occurring frequently when longer storage times in the hexapole are used.34 Fine and well-controlled tuning of ionization and detection conditions is crucial for good resolution and charge-state determination. Consequently, by accurate mass determination within 3 ppm (calibrated externally), achieved in this context for almost all species, a precise assignment of microheterogeneity could be carried out (cf., Table 1). In Figure 2, the enlarged areas of 1650–1700 m/z and 2070–2100 m/z are inserted showing the isotopic pattern of the quintuply and quadruply charged ions corresponding to the major glycoform (Ru = 15). In Figure 3, the enlarged view of 1950–2250 m/z showing the ionic distribution of the major glycoforms with Ru = 14 to 16 and Ru = 14 + Rha to 16 + Rha is presented. An aspect arising from the spectrum in Figure 3 is the shift in the ion intensity of non-sodiated versus sodiated glycoform ion species, in favor of non-sodiated species, in contrast to the spectrum shown in Figure 1. This is a direct consequence of the H+ versus Na+ cations behavior under decreased electrical field.35 As deducible from the spectrum shown in Figure 3, this feature was characteristic for all glycoforms of Ru = 14–16 and their homologous structures elongated by one rhamnose residue. Yet, this aspect was not observed for the quintuply charged ions, where the sodiated species were preferentially ionized over the non-sodiated ones.
A completely different charge-state distribution, relative ion intensity of various glycoforms, and in-source ion generation were observed at fine variation of ESI source parameters, i.e., at about 10 V for the capillary exit voltage. For values down to 45 V, a 10 V difference of the capillary exit voltage led to a preferential detection of a specific glycoform present in the mixture, while at 37.7 V, all glycoforms expected to be present4 could be detected.
(+)NanoESI/FTICR IRMPD MS of S-Layer Glycopeptides
Recently, it has been demonstrated that the IRMPD approach is advantageous and highly effective for various types of glycoconjugates, such as gangliosides,36 acidic glycopeptides and neutral oligosaccharides,37 and lipopolysaccharides19 as well as for phosphopeptide analysis and glycoproteins.26,38–40 Many of these reports claim almost 100% efficiency of the IRMPD dissociation. IRMPD was reported to circumvent the problems encountered with activation-based techniques by minimum ion loss through scattering, typically occurring in CAD methods.41
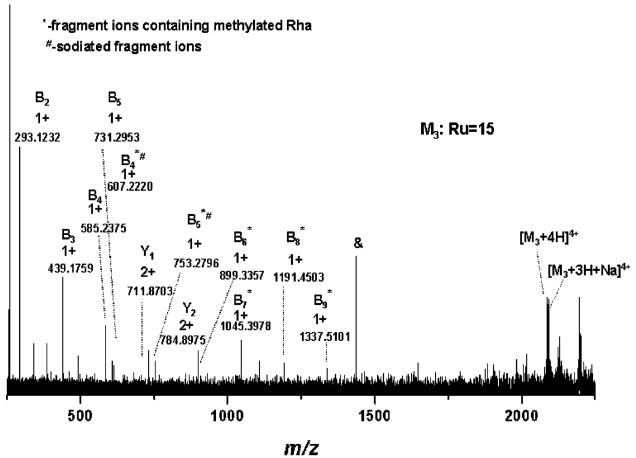
To explore the potential of ESI/FTICR IRMPD MS/MS for sequencing of glycopeptides with very large sugar chains, the quadruply charged ions of m/z 2076.120 designated to the glycoform with 15 trirhamnose repeating units has been selected as precursor ions and subsequently submitted to IRMPD fragmentation. To find the best suitable parameters for efficient fragmentation, a range of 20–80% laser power has been evaluated. At values of 50–80% laser power, complete suppression of precursor ions has been observed, while the fragmentation pattern was represented only by ions in the range of 100–450 m/z due to secondary fragmentations. At values ranging from 20% to 40%, only poor, if any, precursor ions fragmentation occurred. In Figure 4, the IRMPD MS/MS spectrum of the quadruply charged ions at m/z 2076.120 corresponding to the glycoform with 15 repeats, acquired at 40% laser power, is displayed. A complete removal of the sodiated precursor ions was not possible by the applied isolation waveform; therefore, both protonated and sodiated fragment ions were detected. Limited fragmentation efficiency could be obtained under these conditions. The B4* to B9* series of fragment ions, carrying a methylated terminal rhamnose were generated; B1–B5 sequence ions arose either by the loss of the methyl group or from double cleavage of the glycan chain. Two glycopeptides, designated as Y1 and Y2, generated by the glycosidic cleavage of the Gal-Rha entity, and of the vicinal Rha–Rha linkage of the core structure, were detected as doubly charged ions at m/z 711.870 and 784.898, respectively.
Figure 4.
(+)NanoESI/FTICR–IRMPD MS/MS of the quadruply charged precursor ions detected at m/z 2076.120. Capillary exit voltage, 37.7 V; laser power, 40%.
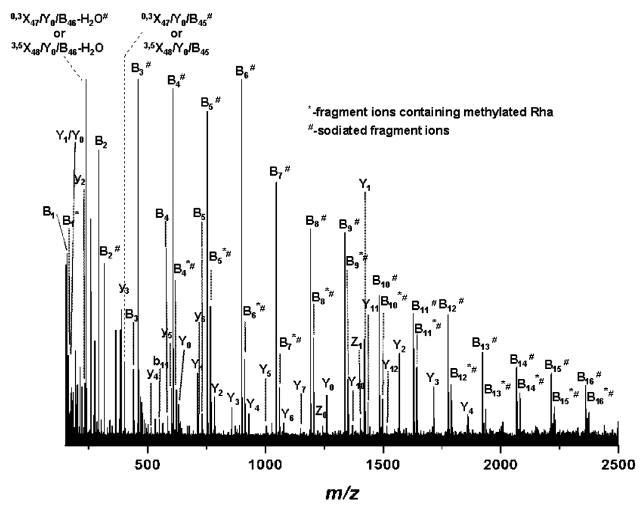
Significant improvement of fragment ions formation was obtained by fine-tuning of the laser power within a 40–50% range: at 43.5% laser power (Figure 5) a total number of 100 sequence ions of high S/N ratio (Table 2) could be generated and detected and assigned with an average mass accuracy of 3 ppm. The prevalent peaks correspond to glycan-containing fragment ions, which do not comprise the terminal methylated rhamnose: B1–B16. These fragment ions could arise either from the loss of the methyl group from their corresponding O-Me-Rha-containing counterpart or from double cleavage within the glycan chain. According to our experience, the first hypothesis is less probable, since methylation is a stable modification of the sugar.9–11,13,15 For ease of spectrum illustration, they were assigned as B-type ions generated by single glycosidic cleavage. Thirty-one fragment ions carrying O-Me Rha were detected as singly and doubly charged ions. Since in the particular case of this S-layer glycopeptide only the terminal rhamnose carries an O-Me group, these ions are clearly formed by subsequent cleavage of the glycosidic bond from the nonreducing end, being thus designated as B* ions. Terminal modifications on S-layer glycan chains were suggested to function as termination signals in glycan chain biosynthesis.8 In this view, the detection of fragment ions carrying the modification motif (i.e., methylation) is essential for determination and/or discrimination of the nonreducing end modification-(s). Notably, also fragment ions formed by ring cleavages were detected under the present experimental conditions (cf., Figure 5 and Table 2). This characteristic of the IRMPD method has been observed for other types of glycoconjugates as well.18,37,42,43 According to structure evaluation the ring cleavages that would deliver these m/z values (Table 2) could only occur within the core region or in its proximity, as they necessarily must contain either a ring-cleaved Gal or the entire Gal residue (Table 2). A direct rationalization of the formation of cross-ring cleavages in the particular case of S-layer glycopeptides or similarly structured glycopeptides cannot be readily made, since a systematic study of ring-cleavage occurrence in glycopeptides comprising linear or branched glycan chains was not carried out so far and neither was fragment ions formation by ring cleavages reported for glycopeptides investigated by IRMPD.26,38 However, it is pertinent here to emphasize that the formation of fragment ions by cross-ring cleavages was observed only for sodiated species. This behavior is similar to the one described by other groups for oligosaccharides, where metal adducts were shown to beneficially influence cross-ring cleavages.18,42,43
Figure 5.
(+)NanoESI/FTICR–IRMPD MS/MS of the quadruply charged precursor ions detected at m/z 2076.120. Capillary exit voltage, 37.7 V; laser power, 43.5%.
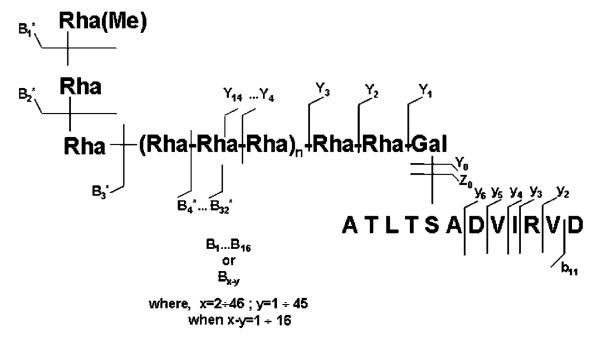
A relatively high number of ions containing the intact peptide backbone but carrying sugar residues was obtained as well. The series of glycopeptide fragment ions ranging from O-galactosylated peptide (Y1) to 13 Rha-containing galactosylated peptide (Y14) is observed in the spectrum (Figure 5). The generation/detection of glycosylated peptide ions is, in general, crucial for defining glycoform heterogeneity at single glycosylation sites in proteins.11,14,15 The carbohydrate fragment ions generated by ring cleavage together with the glycopeptide fragment ions, i.e., Y1, yield deep insights into the core region of the O-glycan attachment site, generally essential in the case of unknown glycopeptides. The fragment ions corresponding to the entire peptide backbone were detected at m/z 630.843, designated as Y0 ions, while the fragmentation of the amide bonds of the peptide chain gave rise to the y1−y6 and b11 peptide sequence ions. The fragmentation pattern resulted from the spectrum in Figure 5 is illustrated in Scheme 1. All together, the B-series of ions carrying methylated Rha (B*1−B*31) at the nonreducing end combined with the Y1–Y14 ions, and the ions generated by the double cleavage of the glycan chain, represent complete sequence coverage of the glycan structure. These results clearly document the potential of the IRMPD approach to provide full sequence information upon the glycoform identity within a peptide region or at a single glycosylation site. While complete sequencing of the peptide could not be achieved, the y1−y6, b11, and Y0 set of ions provide almost 50% of structural information on the peptide motif. Arguably, such an extensive fragmentation of both glycosidic and peptide bonds for largely sized substrates might render difficulties in data assignment and interpretation. However, we consider that when such a pattern is featured in the context of high resolution and accuracy of detection of fragment ions, unambiguous data interpretation can be achieved for known and also unknown components. Moreover, this high sequence coverage within a single experiment is particularly beneficial for characterization of minute amounts of samples, where application of several stages of fragmentation for complete structure determination is restricted by the available amount of sample. Thus, obtaining in a single experiment a full set of information on substrate structure at high resolution, accuracy, and sensitivity of detection becomes advantageous for investigation of biological samples.
Scheme 1. Fragmentation Pattern of the Quadruply Charged Precursor Ions of m/z 2076.120 Corresponding to the Ru = 15 Glycoform.
In the recent studies upon IRMPD of glycopeptides, Hakansson and co-workers26,38 showed that different types of glycopeptides give rise to distinct fragmentation patterns. In the case of high-mannose-type glycopeptides the glycan chain and peptide backbone compete for cleavage regardless the size of the glycopeptide.26,38 Xylose-containing N-glycopeptides exhibit different fragmentation pattern than high-mannose-type glycopeptides, represented by extensive cleavage of the glycan chains but no peptide backbone cleavage. In none of the cases were fragment ions generated by ring cleavage reported.26,38 On the other hand, fragmentation efficiency of IRMPD varies with the size, type, and branching degree of oligosaccharide chains as shown by Lebrilla’s group.44,45 For O-linked mucin-type oligosaccharide IRMPD fragmentation efficiency increases with the size of the sugar chain beyond m/z 2000, and cross-ring cleavages were observed with sulfated oligosaccharides as well.44 More recently the same group investigated the behavior of complex, hybrid, and high-mannose-type N-linked oligosaccharides under IRMPD versus CID events and compared IRMPD of similarly sized N- and O-linked oligosaccharides.45 It was found that IRMPD yields a more prolific fragmentation pattern than CID in terms of both glycosidic bond and cross-ring cleavages, while N-linked glycans exhibit richer fragmentation than a similarly sized O-glycan by showing multiple cross-ring cleavages. In addition, it was postulated that cross-ring cleavages occur preferentially at the branching mannose residues, while linear mannoses do not readily exhibit this behavior.45
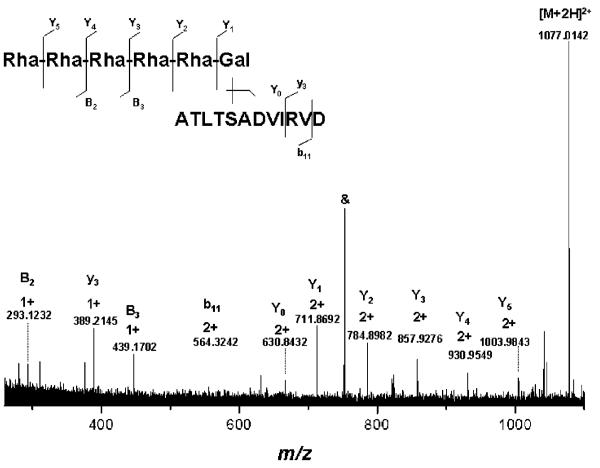
In order to assess whether the IRMPD method yields here a different fragmentation pattern with respect to the size of the glycan chain, a shorter S-layer glycopeptide species represented by the doubly charged ions at m/z 1077.014 (Figure 1) arising from in-source decay has been isolated and subsequently submitted to IRMPD MS/MS. Thus, this fragmentation is basically a virtual MS3. In Figure 6, the spectrum delivered by the IRMPD MS/MS event of the ions at m/z 1077.014 illustrates a full coverage of the Y-type ions Y0–Y5, two B ions (B2, B3), and two peptide bond cleavages (y3 and b11). The fragmentation pathway is rather consistent with the one obtained from the intact glycopeptide in terms of coverage of the glycosylation status of the precursor ions and, to a lower extent, information on the peptide backbone. However, in contrast to the spectrum in Figure 5, formation of Y-type ions was prevalent over the B-type ions as only two, i.e., B2 and B3, were here detected. Additionally, no ring cleavage could be here observed as compared to the spectrum in Figure 5 where considerable cross-ring cleavages occurred. This observation leads us to the conclusion that in this particular case of glycopeptides the IRMPD fragmentation efficiency varies with the size of the glycan chain unlike for other types of glycopeptides26,38 and rather in a similar fashion with O-linked mucin-type oligosaccharides.44 Nevertheless, such an experiment might be of particular interest in the case of unknown glycopeptides, where structural information upon a region of glycopeptide species are required, more frequently on the glycosylation site, core, and its vicinal glycans.
Figure 6.
(+)NanoESI/FTICR–IRMPD MS/MS of the doubly charged ion of m/z 1077.014 resulted by in-source decay. Sample concentration, 7 pmol μL−1 in water/methanol/formic acid (49/49/2, v/v/v %); capillary exit voltage, 54.4 V; laser power, 40%. Inset: Fragmentation scheme of the (Rha)5Gal-ATLTSADVIRVD.
The potential IRMPD MS/MS method was extended here to permit a high sequence coverage of such large glycopeptides at high mass accuracy and resolution of detection, giving rise to a complete set of structural elements characteristic for the glycan heterogeneity at single glycosylation sites.
CONCLUSIONS
An approach using ESI/FTICR MS for the structural elucidation of glycopeptides containing up to 51 rhamnose residues derived from an S-layer glycoprotein is described. The ionization and detection of intact glycopeptides exhibiting heterogeneity in the glycan chain length ranging from 14 to 16 trirhamnose repeating units could be achieved with high mass accuracy provided by the ICR mass analyzer used.
The IRMPD MS/MS technique was adapted to gather a large set of fingerprint ions for a reliable identification of molecular structure. Both glycosidic bond and peptide backbone cleavages as well as cross-ring cleavages could be efficiently generated in a single IRMPD experiment, thus providing a wealthy inventory of structural information on glycopeptide species at high sensitivity. In the context of high resolution and accuracy of detection, straightforward data assignment and eventually structure determination could be achieved. Combined accurate mass determination of intact molecular species with high sequence coverage enabled by the IRMPD method is considered to represent a prerequisite for glycoproteomic studies.
The ESI/FTICR MS and IRMPD sequencing approach described here is asserted as an efficient tool for determination and structural characterization of large glycopeptides, which might lead to further developments of top-down glycoproteomics.
ACKNOWLEDGMENT
The FTICR instrument was purchased with a Grant from the Deutsche Forschungsgemeinschaft (Pe 415/14-1) to J.P.-K. Financial support for this work was provided by Deutsche Forschungsgemeinschaft within Sonderforschungsbereich 492, Project Z2, to J.P.-K. This work was additionally supported by the Austrian Science Fund Projects P18013-B10 to P.M and P19047-B12 to C.S.
References
- (1).Schäffer C, Messner P. Biochimie. 2001;83:591–599. doi: 10.1016/s0300-9084(01)01299-8. [DOI] [PubMed] [Google Scholar]
- (2).Messner P, Schäffer C. Progress in the Chemistry of Organic Natural Products. Springer-Verlag; Wien, Austria: 2003. pp. 51–124. [DOI] [PubMed] [Google Scholar]
- (3).Schäffer C, Messner P. Glycobiology. 2004;14:31R–42R. doi: 10.1093/glycob/cwh064. [DOI] [PubMed] [Google Scholar]
- (4).Schäffer C, Wugeditsch T, Kählig H, Scheberl A, Zayni S, Messner P. J. Biol. Chem. 2002;277:6230–39. doi: 10.1074/jbc.M108873200. [DOI] [PubMed] [Google Scholar]
- (5).Bock K, Schuster-Kolbe J, Altman E, Allmaier G, Stahl B, Christian R, Sleytr UB, Messner P. J. Biol. Chem. 1994;269:7137–44. [PubMed] [Google Scholar]
- (6).Schäffer C, Müller N, Christian R, Graninger M, Wugeditsch T, Scheberl A, Messner P. Glycobiology. 1999;9:407–14. doi: 10.1093/glycob/9.4.407. [DOI] [PubMed] [Google Scholar]
- (7).Kählig H, Kolarich D, Zayni S, Scheberl A, Kosma P, Schäffer C, Messner P. J. Biol. Chem. 2005;280:20292–99. doi: 10.1074/jbc.M501724200. [DOI] [PubMed] [Google Scholar]
- (8).Clarke BR, Cuthbertson L, Whitfield C. J. Biol. Chem. 2004;279:35709–18. doi: 10.1074/jbc.M404738200. [DOI] [PubMed] [Google Scholar]
- (9).Zaia J. Mass Spectrom. Rev. 2004;23:161–227. doi: 10.1002/mas.10073. [DOI] [PubMed] [Google Scholar]
- (10).Peter-Katalinić J. Mass Spectrom. Rev. 1994;13:77–98. [Google Scholar]
- (11).Harvey DJ. Expert Rev. Proteomics. 2005;2:87–101. doi: 10.1586/14789450.2.1.87. [DOI] [PubMed] [Google Scholar]
- (12).Reinhold VN, Reinhold BB, Costello CE. Anal. Chem. 1995;67:1772–84. doi: 10.1021/ac00107a005. [DOI] [PubMed] [Google Scholar]
- (13).Mechref Y, Novotny MV. Chem. Rev. 2002;102:321–69. doi: 10.1021/cr0103017. [DOI] [PubMed] [Google Scholar]
- (14).Morelle W, Canis K, Chirat F, Faid V, Michalski JC. Proteomics. 2006;6:3993–4015. doi: 10.1002/pmic.200600129. [DOI] [PubMed] [Google Scholar]
- (15).Peter-Katalinić J. Methods Enzymol. 2005;405:139–71. doi: 10.1016/S0076-6879(05)05007-X. [DOI] [PubMed] [Google Scholar]
- (16).Vukelić ž., Zamfir A, Bindila L, Froesch M, Peter-Katalinić J, Ususki S, Yu RK. J. Am. Soc. Mass Spectrom. 2005;16:571–80. doi: 10.1016/j.jasms.2005.01.013. [DOI] [PubMed] [Google Scholar]
- (17).O’Connor PB, Mirgorodskaya E, Costello CE. J. Am. Soc. Mass Spectrom. 2002;13:402–7. doi: 10.1016/S1044-0305(02)00351-3. [DOI] [PubMed] [Google Scholar]
- (18).Park Y, Lebrilla CB. Mass Spectrom. Rev. 2005;24:232–64. doi: 10.1002/mas.20010. [DOI] [PubMed] [Google Scholar]
- (19).Kondakova AN, Vinogradov EV, Knirel YA, Lindner B. Rapid Commun. Mass Spectrom. 2005;19:2343–49. doi: 10.1002/rcm.2064. [DOI] [PubMed] [Google Scholar]
- (20).Vakhrushev SY, Mormann M, Peter-Katalinić J. Proteomics. 2006;6:983–992. doi: 10.1002/pmic.200500051. [DOI] [PubMed] [Google Scholar]
- (21).Froesch M, Bindila L, Zamfir A, Peter-Katalinić J. Rapid Commun. Mass Spectrom. 2003;17:2822–32. doi: 10.1002/rcm.1273. [DOI] [PubMed] [Google Scholar]
- (22).Froesch M, Bindila L, Baykut G, Allen M, Peter-Katalinić J, Zamfir A. Rapid Commun. Mass Spectrom. 2004;18:3084–92. doi: 10.1002/rcm.1733. [DOI] [PubMed] [Google Scholar]
- (23).Mormann M, Paulsen H, Peter-Katalinić J. Eur. J. Mass Spectrom. 2005;11:497–511. doi: 10.1255/ejms.738. [DOI] [PubMed] [Google Scholar]
- (24).Mirgorodskaya E, Roepstorff P, Zubarev R. Anal. Chem. 1999;71:4431–36. doi: 10.1021/ac990578v. [DOI] [PubMed] [Google Scholar]
- (25).Mormann M, Maček B, Gonzalez de Peredo A, Hofsteenge J, Peter-Katalinić J. Int. J. Mass Spectrom. 2004;234:11–21. [Google Scholar]
- (26).Adamson JT, Hakansson K. J. Proteome Res. 2006;5:493–501. doi: 10.1021/pr0504081. [DOI] [PubMed] [Google Scholar]
- (27).Messner P, Christian R, Neuninger C, Schulz G. J. Bacteriol. 1995;177:2188–93. doi: 10.1128/jb.177.8.2188-2193.1995. [DOI] [PMC free article] [PubMed] [Google Scholar]
- (28).De Laeter JR, De Bievre P, Hidaka H, Peiser HS, Rosman KJR, Taylor PDP. Pure Appl. Chem. 2003;75:683. [Google Scholar]
- (29).Mamer OA, Lesimple A. J. Am. Soc. Mass Spectrom. 2004;4:626. doi: 10.1016/j.jasms.2003.12.010. [DOI] [PubMed] [Google Scholar]
- (30).Domon B, Costello C. Glycoconjugate J. 1988;5:397–409. [Google Scholar]
- (31).Roepstorff P, Fohlman J. Biomed. Mass Spectrom. 1984;11:601. doi: 10.1002/bms.1200111109. [DOI] [PubMed] [Google Scholar]
- (32).Steiner K, Pohlentz G, Dreisewerd K, Berkenkamp S, Messner P, Peter-Katalinić J, Schäffer C. J. Bacteriology. 2006;188:7914–21. doi: 10.1128/JB.00802-06. [DOI] [PMC free article] [PubMed] [Google Scholar]
- (33).Wugeditsch T, Zachara NE, Puchberger M, Kosma P, Godey AA, Messner P. Glycobiology. 1999;9:787–950. doi: 10.1093/glycob/9.8.787. [DOI] [PubMed] [Google Scholar]
- (34).Hakansson K, Axelsson J, Palmblad M, Hakansson P. J. Am. Soc. Mass Spectrom. 2000;11:210–7. doi: 10.1016/S1044-0305(99)00144-0. [DOI] [PubMed] [Google Scholar]
- (35).Miao X-S, Metcalfe CD, Hao C, March RE. J. Mass Spectrom. 2002;37:495–506. doi: 10.1002/jms.309. [DOI] [PubMed] [Google Scholar]
- (36).McFarland MA, Marshall AG, Hendrickson GL, Nillson C. J. Am. Soc. Mass Spectrom. 2005;16:752–62. doi: 10.1016/j.jasms.2005.02.001. [DOI] [PubMed] [Google Scholar]
- (37).Froesch M, Bindila L, Peter-Katalinić J. Manuscript in preparation. 2007.
- (38).Hakansson K, Cooper HJ, Emmet MR, Costello CE, Marshall AG, Nilsson CL. Anal. Chem. 2001;73:4530–6. doi: 10.1021/ac0103470. [DOI] [PubMed] [Google Scholar]
- (39).Renfrow MB, Cooper HJ, Tomana M, Kulhavy R, Hiki Y, Toma K, Emmett MR, Mestecky J, Marshall AG, Novak J. J. Biol. Chem. 2005;280:19136–45. doi: 10.1074/jbc.M411368200. [DOI] [PubMed] [Google Scholar]
- (40).Zhang J, Schubothe K, Li B, Russell S, Lebrilla CB. Anal. Chem. 2005;77:208–14. doi: 10.1021/ac0489824. [DOI] [PubMed] [Google Scholar]
- (41).Jebanathirajah JA, Pittman JL, Thomson BA, Budnik BA, Kaur P, Rape M, Kirschner M, Costello CE, O’Connor PB. J. Am. Soc. Mass Spectrom. 2005;16:1985–99. doi: 10.1016/j.jasms.2005.08.008. [DOI] [PubMed] [Google Scholar]
- (42).Cancilla MT, Wong AW, Voss RL, Lebrilla CB. Anal. Chem. 1999;71:3206–18. doi: 10.1021/ac9813484. [DOI] [PubMed] [Google Scholar]
- (43).Hofmeister GE, Zhou Z, Leary JA. J. Am. Chem. Soc. 1991;113:5964–70. [Google Scholar]
- (44).Zhang J, Schubothe K, Li B, Russel S, Lebrilla CB. Anal. Chem. 2005;77:208–14. doi: 10.1021/ac0489824. [DOI] [PubMed] [Google Scholar]
- (45).Lancaster KS, Joo An H, Li B, Lebrilla CB. Anal. Chem. 2006;78:4990–97. doi: 10.1021/ac0600656. [DOI] [PubMed] [Google Scholar]


