

Abstract
The shell colour of many pulmonate land snail species is highly diverse. Besides a genetic basis, environmentally triggered epigenetic mechanisms including stress proteins as evolutionary capacitors are thought to influence such phenotypic diversity. In this study, we investigated the relationship of stress protein (Hsp70) levels with temperature stress tolerance, population structure and phenotypic diversity within and among different populations of a xerophilic Mediterranean snail species (Xeropicta derbentina). Hsp70 levels varied considerably among populations, and were significantly associated with shell colour diversity: individuals in populations exhibiting low diversity expressed higher Hsp70 levels both constitutively and under heat stress than those of phenotypically diverse populations. In contrast, population structure (cytochrome c oxidase subunit I gene) did not correlate with phenotypic diversity. However, genetic parameters (both within and among population differences) were able to explain variation in Hsp70 induction at elevated but non-pathologic temperatures. Our observation that (1) population structure had a high explanatory potential for Hsp70 induction and that (2) Hsp70 levels, in turn, correlated with phenotypic diversity while (3) population structure and phenotypic diversity failed to correlate provides empirical evidence for Hsp70 to act as a mediator between genotypic variation and phenotype and thus for chaperone-driven evolutionary capacitance in natural populations.
Keywords: COI, Eco-devo, Evolutionary capacitance, Hsp70, Xeropicta derbentina
Introduction
Moderate stress is essential for healthy growth and development of organisms (Müller 2003) and, under stressful conditions, organisms tend to increase their phenotypic variation (Waddington 1942; Jablonka et al. 1995; Badyaev 2005). In contrast to the traditional point of view, that only gene-based differences in organisms determine their fitness, there is now increasing evidence that organisms are able to adaptively modify their developmental program according to the environment (Dusheck 2002; Sultan 2007; Bolker 2012). Stressful environments can influence ontogenetic pathways and therefore may initiate the induction of particular phenotypes. Organisms with a high phenotypic plasticity, that is the capacity to change their phenotype in response to environmental changes (Price et al. 2003), benefit from being more adaptive.
Various authors have investigated in respect to how phenotypic diversity in polymorphic snail populations are influenced by genetic traits and environmental conditions (Jones et al. 1982; Baur 1988; Baur and Raboud 1988; Cowie 1990; Johnson 2011; Di Lellis et al. 2012; Köhler et al. 2013). Shell colour and pattern are highly variable in pulmonate snail species such as Xeropicta derbentina (Krynicki, 1836) and Theba pisana (Müller, 1774) (Johnson 1981; Cowie 1990; Köhler et al. 2009). They are known for their great range of morphs, the frequency of which can be associated with different microgeographical specifics (Mazek-Fialla 1934). Yet the combination of factors determining this diversity is still not fully understood. Several gene loci primarily control shell colour, presence or absence of shell banding, intensity of pigmentation, et cetera (Jones et al. 1982; Cowie 1984). Habitat structure (such as shaded/exposed) and ambient temperature influence the composition of phenotypes in snail populations (Johnson 2011; Köhler et al. 2013). These conditions, in turn, might also be reflected in their population structure (as inferred from their genotypic diversity). Thus genes that echo a population’s phylogeographical and demographic history could be informative, even though not directly coding for shell colour/pattern. This might be particularly true for populations subjected to strong bottle-necks caused by, for example, high ambient temperatures. In T. pisana, high temperatures emerged either as a selective force or an epigenetically acting component of the environment (Johnson 2011, 2012; Köhler et al. 2013): organisms possess various mechanisms to deal with high temperatures.
The expression of heat shock proteins (Hsps), for example, is part of the cellular heat response and directly associated with thermal tolerance (Feder and Hofmann 1999; Pörtner and Farrell 2008). Particularly, Hsp70 chaperones own abilities that make them indispensable in the physiological stress response (Lindquist and Craig 1988; Bukau and Horwich 1998). In addition to their function in the process of re-folding damaged proteins, compensating for proteotoxic effects (Gething and Sambrook 1992; Köhler et al. 1992; Parsell and Lindquist 1993; Feder and Hofmann 1999; Lewis et al. 1999; Köhler et al. 2000), they assist in folding and stabilizing nascent protein chains. The structure of Hsp70 is phylogenetically highly conserved, even though the capacities for its induction may vary considerably among populations of the same species (Köhler et al. 2000). Differences in Hsp70 levels can directly account for stress tolerance (Köhler et al. 1992; Dahlgaard et al. 1998; Feder and Hofmann 1999; Köhler et al. 2000), which often is influenced by microgeographical selection processes. Since the production of stress proteins, however, is energy consuming, it is reasonable to assume that Hsp induction trades off against other fitness parameters because of constraints in energy allocation (Krebs and Loeschcke 1994; Silbermann and Tatar 2000; Kristensen et al. 2008). On the other hand, a high capacity to transiently elevated chaperoning activity may guarantee survival during short periods of extreme heat. In this context, a combination of a low constitutive (basic) level and a high induction capacity would allow low energy expenditure but high short-term stress tolerance. Several studies have revealed selection for reduced base Hsp expression in highly thermo- or metal-tolerant species or populations (Krebs and Feder 1997; Bettencourt et al. 1999; Köhler et al. 1999, 2000; Sørensen et al. 1999, 2001; Zatsepina et al. 2001; Arts et al. 2004; Haap and Köhler 2009). Mizrahi et al. (2009) also showed a delayed induction of Hsp70 and Hsp90 in a highly thermotolerant desert-dwelling snail species, which enhanced small Hsp molecules (sHsps) under thermal stress that are more efficient in production due to their molecular size.
Heat stress can influence phenotypic variation (Child et al. 1940; Imasheva et al. 1997; Royer et al. 2009; Sisodia and Singh 2009; Hansen et al. 2011; Crichigno et al. 2012) and chaperones were suggested to canalize phenotypic development and, therefore, to act as capacitors of phenotypic variation (Rutherford and Lindquist 1998; Roberts and Feder 1999; Queitsch et al. 2002; Rutherford 2003). Thus, it seems reasonable to hypothesize that they also participate in the regulation of phenotypic variation in natural populations of polymorphic land snails. Specifically, Hsp70 can suppress effects of gene-based mutations in proteins in order to preserve their function and, therefore, is thought to function as a capacitor (Roberts and Feder 1999; Mayer and Bukau 2005). Capacitoring, however, has so far almost exclusively been studied in model organisms, and its role in ecology and evolution of natural populations is still unclear. The first indirect evidence for an association of Hsps with capacitoring of phenotypic variation in natural populations was provided by Manitasevic et al. (2007) for Hsp90 and Köhler et al. (2009) for Hsp70.
However, the hypothesis that high stress protein levels confer high capacitoring potential and, therefore, low phenotypic variation has not been tested in a larger number of natural populations. To address this hypothesis, we investigated the correlation of shell colouration diversity, population structure and the capacity to induce Hsp70 in ten populations of the Mediterranean hygromiid snail X. derbentina. More specifically, the following questions were asked: Do snail populations differ in their constitutive Hsp70 levels under stress-free conditions, in their maximum induction levels and in their capacity to induce Hsp70? Do Hsp70 levels correspond to phenotypic variation within and among the investigated populations, and does population structure reflect the variation in shell colour? To what extent does genotypic diversity correspond to the capacity to induce Hsp70?
Material and methods
Test organisms
X. derbentina is a xerophilic species widespread in the circum-Mediterranean region. It originates in the eastern Mediterranean and the Middle East but is also abundant in southern France (Aubry et al. 2005; Kiss et al. 2005). The shell of adult individuals is 10–16 mm in diameter. On hot days, individuals climb up vertical objects to escape the heat near the ground, seal their shell aperture and remain inactive (Mazek-Fialla 1934; Machin 1968; Aubry et al. 2005). During the night when temperatures are lower and humidity higher, they are active and feed.
Overall, ten populations were sampled in the Vaucluse department, Provence, Southern France (Table 1) in May 2010 and June 2012. Identification was based on morphological traits and a fragment of the mitochondrial cytochrome c oxidase subunit I (COI) gene. Since X. derbentina is annual in Southern France and only few individuals (which are easily identified by their size) live for 2 years (Dieterich et al. 2013), all tested individuals had hatched in early spring and, therefore, were of about the same age.
Table 1.
Investigated X. derbentina populations (Pop. no.), respective sampling sites in Provence, France, and recorded data on phenotypic diversity (Hs), constitutive (Hsp70 const.) and maximum (Hsp70 max) stress protein levels and population structure (π, F ST and H MH). Note that the latter two parameters were obtained by estimating the average pairwise distances between the population of concern and all other populations in the dataset
| Pop. no. | Sampling date | Locality | Hs (n) | Hsp70 const. | Hsp70 max | Hsp70 cap% | π | F ST | H MH |
|---|---|---|---|---|---|---|---|---|---|
| 1 | May 2010 | Modène Mazzia | 0.72 (282) | 0.643 | 0.851 | 132 | 2.24 | 0.10 | 0.07 |
| 2 | May 2010 | Modène wine yard | 1.19 (282) | 0.620 | 0.779 | 126 | 1.67 | 0.07 | 0.07 |
| 3 | May 2010 | Modène West | 0.80 (282) | 0.627 | 0.978 | 156 | 1.64 | 0.07 | 0.07 |
| 4 | May 2010 | St Pierre | 0.51 (282) | 0.567 | 0.607 | 107 | 2.50 | 0.32 | 0.32 |
| 5 | May 2010 | Mazan South | 1.22 (282) | 0.534 | 0.763 | 143 | 2.10 | 0.13 | 0.13 |
| 6 | May 2010 | Bon Remède | 1.04 (282) | 0.532 | 1.031 | 194 | 1.13 | 0.08 | 0.08 |
| 7 | May 2010 | Mazan North | 0.20 (282) | 0.687 | 0.961 | 140 | 0.00 | 0.17 | 0.17 |
| 8 | June 2012 | la Roque sur Pernes | 0.26 (154) | 1.042 | 1.539 | 148 | 2.18 | 0.07 | 0.07 |
| 9 | June 2012 | Voie St. Didier | 0.00 (142) | 1.345 | 1.615 | 120 | 0.40 | 0.12 | 0.12 |
| 10 | June 2012 | Malaucène | 0.29 (184) | 0.769 | 1.352 | 176 | 1.71 | 0.07 | 0.10 |
Snails were brought to the laboratory and kept in plastic boxes (20.5 × 30 × 19.5 cm) on moist terrarium ground-covering material (JBL TerraBasis, Neuhofen, Germany) under a light regime of 12 h/12 h and a constant room temperature of 25 °C. As recommended by Cowie and Cain (1983), they were fed baby porridge (HIPP Gute Nacht Bio-Milchbrei, Hafer & Apfel, Pfaffenhofen, Germany) and cuttlebone.
Heat exposure
After 2 weeks of laboratory acclimation, snails from each of the ten populations were exposed to heat stress. The experiments were carried out in heating cabinets using plastic boxes (6.5 × 18 × 13 cm) with moist tissue paper as ground cover, each box containing ten individuals. Snails were exposed to 25 (control), 33, 38, 40, 43, 45, 48 °C and, in populations 1–7, additionally 50 °C and 52 °C for a duration of 8 h to measure the base (at 25 °C) and maximum level of stress protein induction. Finally, they were individually shock frozen in liquid nitrogen and stored in a freezer (−25 °C) until Hsp70 and genetic analyses were done.
At temperatures ≥50 °C snails became immobile indicating severe detrimental impact. We therefore omitted data from these temperatures from the analysis.
Hsp70 stress protein analysis
Individual snails were mechanically homogenized, centrifuged and the total protein concentration in the supernatant determined according to Bradford (1976). For each sample, 40 μg of total protein were analyzed by minigel SDS-PAGE and semi-dry Western blotting according to Köhler et al. (2005) using a monoclonal α-Hsp70 antibody (Dianova, Hamburg, Germany) that cross-reacted with both constitutive and inducible stress protein isoforms. The optical volumes of the individual Hsp70 bands (a single band per sample, comprising all isoforms) were quantified with the E.A.S.Y. Win 32 densitometric image analysis program (Herolab, Wiesloch, Germany). All samples were quantified relative to a standard prepared from full body homogenate of T. pisana, which was run twice on each gel, to ensure comparability among all samples (Fig. 1). This assay displayed a methodological variance of ±2.7 % from the mean (Köhler et al. 2005).
Fig. 1.

Representative Western blot for Hsp70 in snails exposed to either 25 °C (5 bands on the left side of the blot) or 33 °C (5 bands on the right side). All samples were quantified relative to a standard sample, which was run twice on each gel. The α-Hsp70 antibody was cross-reactive with all isoforms of Hsp70 and detected both constitutive and inducible proteins within a single band per sample
Phenotypic diversity
For each snail population, the shell pigmentation pattern was categorized according to the classification system of Köhler et al. (2009) (for the number of replicates see Table 1): 1 = white; 2 = white with a single pale band; 3 = grayish with several light bands; 4 = dark with lots of intense bands (Fig. 2). To assess the level of phenotypic variation within each population, we calculated Shannon-Wiener-Indices (Hs) from the shell colour categories of all available individuals from each locality (142 ≤ n ≤ 282).
Fig. 2.
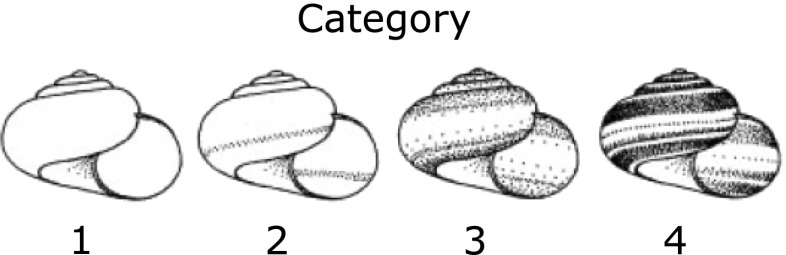
Classification system to determine the shell coloration pattern, according to Köhler et al. (2009) modified
Genotyping
Genomic DNA from the foot tissue of 15–20 specimens of each population was isolated using the DNeasy Blood & Tissue Kit (QIAGEN, Inc., Mississauga, Ontario, Canada). Amplification of a 700 base pair long fragment (excluding primer sequence) of the mitochondrial COI gene was carried out using the universal forward primer LCO1490 (Folmer et al. 1994) and a newly developed reverse primer HeliR2 5′-CCTAAAATATGWGAAAYAATACCAAA-3′. Sequencing was performed in both directions by LGC Genomics (Berlin, Germany) using an ABI 3730 XL DNA Analyzer. Consensus sequences were aligned in BioEdit 7.0.9.0 (Hall 1999) and deposited in GenBank (KF734452-KF734589 and 426529-KJ426573).
Statistical analyses
For testing whether genetic parameters of the populations studied significantly reflect mean differences in cellular and biochemical heat stress response, three population indices were calculated from the COI dataset. They comprised within-site (‘diversity’) and between-site (‘divergence’) parameters. The first parameter was nucleotide diversity π (average number of nucleotide differences within populations based on the K2P model of sequence evolution), estimated in Arlequin 3.5.1.2 (Excoffier et al. 2005). The two divergence parameters were Nei’s (1973) pairwise fixation index (FST) and haplotype divergence (HMH) based on the Morisita-Horn index (Horn 1966), both calculated in the R 2.15 statistical environment (R Development Core Team 2011). For the former index, we used the adegenet package (version 1.3-6, Jombart 2008); for the latter, we treated haplotypes as species (Helmus et al. 2007; Schrader et al. 2013) and estimated the dissimilarity between the haplotype structures of two groups with the vegan package (version 2.0-5, Oksanen et al. 2012).
To detect differences in constitutive Hsp70 levels at 25 °C and maximum induction levels among populations, we conducted analyses of variance (Welch-ANOVA) subsequent to checking data for normal distribution (visual inspection of histograms in addition to Shapiro-Wilk tests with α = 0.05) and for homoscedasticity (Levene’s test). Subsequently, linear least squares regression analyses (basic Hsp70 levels vs. Hs, maximum Hsp70 levels vs. Hs, π vs. Hs) were conducted. For all these statistical procedures, we used JMP, version 9 (SAS Institute Inc., Cary, NC).
We then used generalized additive models (GAM) in order to examine the relationship between Hsp70 level, temperature and population structure. GAMs are often used in case of non-linear relationships between the dependent and independent variables by fitting a polynomial function. Moreover, being an extension of generalized linear models, they allow the use of a gamma error distribution, which in turn prevents the occurrence of any modelled Hsp response below 0. All regression analyses were conducted using the R 2.15 and the mgcv 1.7.22 package (Wood 2011). Hsp70 data consisted of expression measurements from ten individuals for each of seven temperatures (25, 33, 38, 40, 43, 45 and 48 °C). Preliminary analyses indicated k = 6 (basis dimensions) to be optimal for temperature. To facilitate interpretation, three basis dimensions were chosen for the other independent variables.
Finally, we applied structural-equation modelling using lavaan (Rosseel 2012) 0.5-13 for R 2.15 in order to test simultaneously our hypothesized causal assumptions that Hsp70 levels depend on ambient temperature and population structure, and that phenotypic diversity is driven by Hsp70 levels.
Results
Hsp70 induction profiles
With the exception of population 4, all populations showed stress protein induction kinetics to follow an optimum curve in response to elevated temperature regimes. At moderately elevated temperatures, Hsp70 was induced, followed by a decline of the Hsp70 level at high temperatures, when the maximum response level had been surpassed. Most populations (Figs. 3P1-3, P5–10) showed a clear stress protein induction with a maximum induction capacity of 120–194 % compared to the control level at 25 °C. The highest mean Hsp70 induction was always at either 38 or 40 °C, except in population 4 (Fig. 3), in which the Hsp70 level reached a maximum of just 107 % of the constitutive level, at 33 °C.
Fig. 3.

Hsp70 responses in X. derbentina to elevated temperatures. Means and SD. P1 to P10 refer to the respective population numbers. Bottom right Correlation analyses for X. derbentina populations. Constitutive Hsp70 level vs. maximum Hsp70 level. Dotted lines indicate 95 % confidence interval of the linear regression curve
Both constitutive and maximum induction Hsp70 levels differed significantly among populations (Welch-ANOVA; P < 0.0001, F1,9: 13.3387 and P < 0.0001, F1,9: 24.5448, respectively) but were positively correlated with one another (P = 0.0009; R2 = 0.7650) (Fig. 3).
In addition to the maximum of induction, the majority of all populations (1–5, 7, 8) exhibited a second, smaller Hsp70 peak or at least a plateau (6, 9) after the stress protein level had decreased from maximal induction. This phenomenon occurred always in response to 45–48 °C treatment. No mortality was recorded in the experiments ≤48 °C.
Phenotypic diversity and population structure
Phenotypic diversity differed remarkably among populations. While population 9 was uniformly white, populations 2 and 5 showed rather high Shannon-Wiener indices of about 1.2 (Table 1, Fig. 4).
Fig. 4.

Correlation analyses for X. derbentina populations. a Constitutive Hsp70 level vs. phenotypic diversity. b Maximum Hsp70 level vs. phenotypic diversity (Hs). Dotted lines indicate 95 % confidence interval of the linear regression curve
Genetic diversity within populations (π) was generally low (all <3.0), with the highest diversity in populations 4 and 1; population 7 was homogeneous (Table 1). Genetic divergences among populations, expressed by FST and HMH, were also low. The only exception was population 4, which had relatively high values for both FST and HMH, indicating that it was most dissimilar from all other populations (Table 1).
Correlation of Hsp70 levels and phenotypic diversity
Regression analyses revealed significant negative correlations between both constitutive and maximum induced Hsp70 levels and phenotypic diversity (Hs) (P = 0.0139, R2: 0.5515; and P = 0.0324, R2: 0.4552, respectively) (Fig. 4).
Correlation of population structure and phenotypic diversity
Neither the diversity parameter π (P = 0.25, R2 = 0.16) nor the two divergence parameters FST and HMH (P = 0.59, R2 = 0.004 and P = 0.86, R2 = 0.004, respectively) were significantly correlated with Hs values.
Correlation of Hsp70 levels and population structure
Based on the corrected Akaike information criterion (AICc), selecting the best generalized additive model of all possible combinations of temperature, mean population divergence (FST and HMH) and population diversity (π), resulted in a GAM incorporating all four variables (Table 2). For the seven temperature treatments with ten individuals each for each of the ten populations, 37.4 % of the variance in Hsp70 level was explained by this model. The analysis also showed that Hsp70 expression depends mostly on temperature: expression increased up to 40 °C and subsequently declined (Fig. 5). Hsp70 levels first decrease with increasing genetic diversity and increase again at π values > 1.4. In contrast, mean genetic divergence (FST) shows the opposite pattern with intermediate differentiation coinciding with the highest Hsp70 levels (figure not shown here). For the second divergence index, mean HMH, low values caused an increase in Hsp70 expression. Overall, the fit of the prediction varied for the temperature treatments (Table 3). However, the best fit was observed for non-harmful temperatures (i.e., up to 40 °C).
Table 2.
Estimated degrees of freedom (edf), F statistic and respective P values of the GAM model for Hsp70 expression based on temperature and genetic parameters. Population divergence was estimated by the mean of F ST and H MH indices, and population diversity measured by genetic diversity (π). Adjusted R 2 of the full model was 37.4 % and corrected AICc 127.4. ∆AICc shows the variable importance by the decrease in quality of the regression model when the respective variable is omitted
| edf | F | P value | ∆AICc | |
|---|---|---|---|---|
| Temperature | 4.965 | 42.95 | <2e−16 | 204.76 |
| π | 1.973 | 45.00 | <2e−16 | 81.48 |
| Mean F ST | 1.954 | 29.36 | 5.64e−13 | 54.56 |
| Mean H MH | 1.999 | 24.03 | 7.83e−11 | 47.94 |
Fig. 5.

GAM based prediction for the relationship between Hsp70 expression levels, genetic diversity (π), and ambient temperature
Table 3.
“Goodness of fit” for the GAM model for Hsp70 expression including temperature and genetic parameters. Pseudo R 2 are given for temperatures of 25–48 °C based on comparisons of measured vs. GAM predicted Hsp70 data
| Temperature (°C) | Pseudo R 2 |
|---|---|
| 25 | 0.327 |
| 33 | 0.402 |
| 38 | 0.409 |
| 40 | 0.394 |
| 43 | −0.130 |
| 45 | 0.166 |
| 48 | −0.058 |
Structural-equation modelling
Our model, used to simultaneously test the causal assumptions that Hsp70 levels depend on ambient temperature and population structure, and that phenotypic diversity is driven by Hsp70 levels, is not rejected (χ2 = 4.7, df = 3, P = 0.20). This indicates a reasonable approximation of the causal pathways (Fig. 6).
Fig. 6.

Structural-equation model for causal assumptions of Hsp70 levels, ambient temperature, population structure, and phenotypic diversity. For each path the significant (α ≤ 0.05) standardized regression coefficients are given. Population structure is a latent variable (shown as ellipse) because it cannot be measured directly and is estimated by its indicators population divergence and diversity. Measured variables are displayed in rectangles including the coefficient of determination for the dependent variables. Dashed lines indicate non-significant relationships
Discussion
Our study revealed differences in phenotypic diversity, population structure and in susceptibility of the Hsp70 system to heat stress among populations of X. derbentina. In this species, high constitutive and high maximum levels of Hsp70 were significantly associated with low phenotypic variation in shell colouration, which is in accordance with the capacitoring concept, while population structure was not correlated with phenotypic diversity but with Hsp70 expression levels. This main finding of the study strongly supports the assumption that evolutionary capacitance, originally found in model species and laboratory studies, also applies to natural populations. In comparison to earlier field-oriented work of Manitasevic et al. (2007) and Köhler et al. (2009), our present study provides a much larger dataset and, therefore, stronger evidence for a contribution of stress proteins to the capacitoring of phenotypic variation under natural conditions (Fig. 6).
While Manitasevic et al. (2007) and the present study have focused on actual levels of stress proteins, Köhler et al. (2009) used the ‘Hsp70 induction capacity’ (ratio between the constitutive Hsp70 level at 25 °C and the highest measured Hsp70 level at elevated temperature) as a proxy for potential capacitoring and provided data for four snail populations from different species. Supplementing the dataset of Köhler et al. (2009) by data on ‘induction capacities’ calculated from the present ten X. derbentina populations plus another 6 French helicoid snail populations (A.P., S.L., P.A., unpublished) revealed also negative but just weakly significant correlation between the phenotypic diversity of snail populations and the ‘Hsp70 induction capacity’ (P = 0.0474, df = 18, R2 = 0.2010) irrespective of species and habitat. In this context, the positive association between constitutive and maximum stress protein levels, however, results in a loss of information when data on constitutive and maximum stress protein levels are transformed into ‘induction capacities’. On the basis of the results of the present study, we therefore give preference to actual constitutive and maximum Hsp70 levels as measures of capacitoring capability.
This contrasts with what should be expected for the hypothetical, ideal strategy (a low constitutive Hsp70 level, but a high potential to induce Hsp70). Presumably based on mechanistic constraints, independent selection for low constitutive Hsp70 levels on the one hand and high Hsp70 induction capacities on the other does not seem to be possible here and, consequently, selection for low constitutive Hsp levels seems to confer also a low potential of Hsp induction. Consequently, X. derbentina populations either follow the strategy of expressing high constitutive and maximum Hsp70 levels, resulting in high energy expenditure and the consequent low phenotypic variation, or reduce constitutive and maximum Hsp70 levels for the benefit of low energy requirements and at the consequence of high phenotypic variation. While the first strategy requires a continuous and sufficient energy supply (probably reducing the stressfulness of extreme environmental conditions), the latter strategy leads to limitations in the biochemical response to stressful conditions and increases evolvability resulting from display of previously hidden phenotypic diversity, which is particularly evolutionarily appropriate for populations under stress. Our results are in accordance with the findings of Norris and Hightower (2000), who found a direct correlation between Hsp70 levels and survival at elevated temperature as a test of phenotypic diversity in acquired thermotolerance in Poeciliopsis, a genus of subtropical fish. The analogy between helicoid snails and poeciliid fish complements our findings and suggests they may be extended to other organisms than Mediterranean pulmonates.
Regarding their biochemical stress response, our microallopatric populations of X. derbentina differed not only in their stress protein induction profiles, but also in their Hsp70 levels under stress-free control conditions and in their maximum induction levels under elevated heat stress. Despite this substantial variation in the intensity of Hsp70 basic levels and induction capacities, the general pattern of a maximum stress response at about 40 °C and, in most cases, a second, smaller peak or saddle point at 48 °C, was the same in all populations. Whereas the Hsp70 maximum at 40 °C corresponds to a high but environmentally relevant temperature in the Mediterranean, the 48 °C peak may be the result of a last rearing up of individuals against extreme heating. Our study showed the Hsp70 variation at T ≤ 40 °C to be reasonably well explained by population structure. The stress response patterns probably resulted from selection of efficient strategies to meet the challenges resulting from elevated and nontransient environmental temperatures (up to 40 °C) on the one hand and from occasional heat pulses, exerted by, e.g. accidental contact to the soil surface (48 °C) on the other hand. For these snails, it remains unknown how the capacity to upregulate stress proteins (by Hsp induction) and the constitutive level of these proteins (eventually dominated by cognate gene products) correspond mechanistically. Nevertheless, the population structure preferentially explained Hsp70 levels, when they were high (indicating selection pressure for high induction capacities in some habitats, e.g. those of populations 6 and 10) and constitutive Hsp70 levels to a much lesser extent (Table 3).
The only snail population, which displayed high π, FST and HMH values for population structure indicating a high dissimilarity to the other populations and a correspondingly low Hsp70 induction from the constitutive level was population 4. This population was abundant close to a glass containerization site and, therefore, may be subjected to frequent specimen exchange by container replacement. On the basis of a consistent interchange of individuals and the observation that selection has favored at least a moderate Hsp70 induction capacity in all other investigated populations, an incomplete adaption to its microhabitat can be proposed for this population.
Phenotypic shell variation among populations was correlated with both the constitutive and maximum Hsp70 induction level. In contrast, population structure as represented by diversity and divergence parameters was not signi-ficantly correlated with phenotypic diversity. Whereas p-distances (π values) of COI are a reliable and readily interpretable proxy for genetic diversity (Kartavtsev and Lee 2006), the power of COI genotypic diversity to explain phenotypic variation in the shell pattern of X. derbentina is rather limited (Fig. 6). Consequently, epigenetic mechanisms that can modify the genotype within the range of phenotypic plasticity have to be proposed for these snails.
Populations of X. derbentina in the Vaucluse area with low phenotypic (but not necessarily low genotypic) variation are dominated by plain white (category 1) morphs. The question therefore arises of how high Hsp70 levels may be able to favour the emergence of non-melanized individuals. Since melanin synthesis, the ultimate cause of dark shell colouration, involves multi-step pathways with pleiotropic impact (Rebeiz et al. 2009), Hsp70 might operate in various ways. In mouse melanoma cells, in vitro as well as in vivo increased Hsp70 levels led to suppression in melanin production with two possible explanations (Hoshino et al. 2010). Firstly, Hsp70 might affect intracellular trafficking of melanosomes, since it affects intracellular traffic of vesicles (Bukau and Horwich 1998). Second, it influences the expression and activity of tyrosinase, a rate-limiting enzyme in melanin synthesis, by binding to microphthalmia-associated transcription factors (MITF) with subsequent inhibition of the promoter of the tyrosinase gene in the nucleus. Even though mechanisms of gene activation have not been investigated in X. derbentina, it cannot be excluded that the snail populations with predominantly white shells and, therefore, comparably low phenotypic variation are influenced by similar Hsp70 action on melanin synthesis as mammals.
Conclusion
In X. derbentina, genetic analyses that reflect the demographic structure of populations could not directly be related to phenotype assemblages in these populations. The observations that, on the contrary, haplotype-based genetic parameters could well explain variation in Hsp70 responses to elevated temperature and that, in parallel, constitutive and, partly, induced levels of Hsp70 correlate significantly with phenotypic variation, substantiates the theory of stress proteins acting as environmentally driven capacitors of morphological development.
Acknowledgments
We are grateful to Tim Triebskorn, Nik Triebskorn, and Thierry Desmarest for their help with the field work. François Leboulenger provided valuable information on the distribution of land snails in France. This study was financed by the German Research Council, DFG (KO 1978/5-3 and WI 1902/10-3).
Contributor Information
Maddalena A. Di Lellis, Maddalena.DiLellis@googlemail.com
Heinz-R. Köhler, Email: heinz-r.koehler@uni-tuebingen.de
References
- Arts M-JSJ, Schill RO, Knigge T, Eckwert H, Kammenga JE, Köhler H-R. Stress proteins (hsp70, hsp60) induced in isopods and nematodes by field exposure to metals in a gradient near Avonmouth, UK. Ecotoxicology. 2004;13:739–755. doi: 10.1007/s10646-003-4473-5. [DOI] [PubMed] [Google Scholar]
- Aubry S, Labaune C, Magnin F, Kiss L. Habitat and integration within indigenous communities of Xeropicta derbentina (Gastropoda: Hygromiidae), a recently introduced land snail in South-Eastern France. Divers Distrib. 2005;11:539–547. doi: 10.1111/j.1366-9516.2005.00189.x. [DOI] [Google Scholar]
- Badyaev AV. Stress-induced variation in evolution: from behavioural plasticity to genetic assimilation. Proc R Soc B. 2005;272:877–886. doi: 10.1098/rspb.2004.3045. [DOI] [PMC free article] [PubMed] [Google Scholar]
- Baur B. Microgeographical variation in shell size of the land snail Chondrina clienta. Biol J Linn Soc. 1988;35:247–259. doi: 10.1111/j.1095-8312.1988.tb00469.x. [DOI] [Google Scholar]
- Baur B, Raboud C. Life history of the land snail Arianta arbustorum along an altitudinal gradient. J Anim Ecol. 1988;57:71–87. doi: 10.2307/4764. [DOI] [Google Scholar]
- Bettencourt BR, Feder FE, Cavicchi S. Experimental evolution of Hsp70 expression and thermotolerance in Drosophila melanogaster. Evolution. 1999;53:484–492. doi: 10.2307/2640784. [DOI] [PubMed] [Google Scholar]
- Bolker J. There’s more to life than rats and flies. Nature. 2012;491:31–33. doi: 10.1038/491031a. [DOI] [PubMed] [Google Scholar]
- Bradford M. A rapid and sensitive method for the quantitation of microgram quantities of protein utilizing the principles of protein-dye binding. Anal Biochem. 1976;72:248–254. doi: 10.1016/0003-2697(76)90527-3. [DOI] [PubMed] [Google Scholar]
- Bukau B, Horwich AL. The Hsp70 and Hsp60 chaperone machines. Cell. 1998;92:351–366. doi: 10.1016/S0092-8674(00)80928-9. [DOI] [PubMed] [Google Scholar]
- Child GP, Blanc R, Plough HH. Somatic effects of temperature on development in Drosophila melanogaster. Physiol Zool. 1940;13:56–64. [Google Scholar]
- Cowie RH. Ecogenetics of Theba pisana (Pulmonata: Helicidae) at the northern edge of its range. Malacology. 1984;25:361–380. [Google Scholar]
- Cowie RH. Climatic selection on body colour in the land snail Theba pisana (Pulmonata: Helicidae) Heredity. 1990;65:123–126. doi: 10.1038/hdy.1990.78. [DOI] [Google Scholar]
- Cowie RH, Cain AJ. Laboratory maintenance and breeding of land snails, with an example of Helix aspersa. J Molluscan Stud. 1983;49:176–179. [Google Scholar]
- Crichigno SA, Battini MA, Cussac VE. Early morphological variation and induction of phenotypic plasticity in Patagonian pejerrey. Neotropical Ichthyol. 2012;10:341–348. doi: 10.1590/S1679-62252012005000007. [DOI] [Google Scholar]
- Dahlgaard J, Loeschcke V, Michalak P, Justesen J. Induced thermotolerance and associated expression of the heat shock protein Hsp70 in adult Drosophila melanogaster. Funct Ecol. 1998;12:786–793. doi: 10.1046/j.1365-2435.1998.00246.x. [DOI] [Google Scholar]
- Di Lellis MA, Seifan M, Troschinski S, Mazzia C, Capowiez Y, Triebskorn R, Köhler H-R. Solar radiation stress in climbing snails: behavioural and intrinsic features define the Hsp70 level in natural populations of Xeropicta derbentina (Pulmonata) Cell Stress Chaperones. 2012;17:717–727. doi: 10.1007/s12192-012-0344-4. [DOI] [PMC free article] [PubMed] [Google Scholar]
- Dieterich A, Fischbach U, Ludwig M, Di Lellis MA, Troschinski S, Gärtner U, Triebskorn R, Köhler H-R. Daily and seasonal changes in heat exposure and the Hsp70 level of individuals from a field population of Xeropicta derbentina (Krynicki 1836) (Pulmonata, Hygromiidae) in Southern France. Cell Stress Chaperones. 2013;18:405–414. doi: 10.1007/s12192-012-0393-8. [DOI] [PMC free article] [PubMed] [Google Scholar]
- Dusheck J. It’s the ecology, stupid! Nature. 2002;418:578–579. doi: 10.1038/418578a. [DOI] [PubMed] [Google Scholar]
- Excoffier L, Laval G, Schneider S. Arlequin vers. 3.0: an integrated software package for population genetics data analysis. Evol Bioinformatics Online. 2005;1:47–50. [PMC free article] [PubMed] [Google Scholar]
- Feder ME, Hofmann GE. Heat-shock proteins, molecular chaperones, and the stress response: evolutionary and ecological physiology. Annu Rev Physiol. 1999;61:243–282. doi: 10.1146/annurev.physiol.61.1.243. [DOI] [PubMed] [Google Scholar]
- Folmer O, Black M, Hoeh W, Lutz R, Vrijenhoek R. DNA primers for amplification of mitochondrial cytochrome c oxidase subunit I from diverse metazoan invertebrates. Mol Mar Biol Biotechnol. 1994;3:294–299. [PubMed] [Google Scholar]
- Gething M-J, Sambrook J. Protein folding in the cell. Nature. 1992;355:33–45. doi: 10.1038/355033a0. [DOI] [PubMed] [Google Scholar]
- Haap T, Köhler H-R. Cadmium tolerance in seven Daphnia magna clones is associated with reduced hsp70 baseline levels and induction. Aquat Toxicol. 2009;94:131–137. doi: 10.1016/j.aquatox.2009.06.006. [DOI] [PubMed] [Google Scholar]
- Hall T. BioEdit: a user-friendly biological sequence alignment editor and analysis program for Windows 95/98/NT. Nucleic Acids Symp Ser. 1999;41:95–98. [Google Scholar]
- Hansen LR, Soylu S, Kotaki Y, Moestrup Ø, Lundholm N. Toxin production and temperature-induced morphological variation of the diatom Pseudo-nitzschia seriata from the Arctic. Harmful Algae. 2011;10:689–696. doi: 10.1016/j.hal.2011.05.004. [DOI] [Google Scholar]
- Helmus MR, Bland TJ, Williams CK, Ives AR. Phylogenetic measures of biodiversity. Am Nat. 2007;169:E68–E83. doi: 10.1086/511334. [DOI] [PubMed] [Google Scholar]
- Horn HS. Measurement of “overlap” in comparative ecological studies. Am Nat. 1966;100:419–424. doi: 10.1086/282436. [DOI] [Google Scholar]
- Hoshino T, Matsuda M, Yamashita Y, Takehara M, Fukuya M, Mineda K, Maji D, Ihn H, Adachi H, Sobue G, Funasaka Y, Mizushima T. Suppression of melanin production by expression of Hsp70. J Biol Chem. 2010;285:13254–13263. doi: 10.1074/jbc.M110.103051. [DOI] [PMC free article] [PubMed] [Google Scholar]
- Imasheva AG, Loeschcke V, Zhivotovsky LA, Lazebny OE. Effect of extreme temperatures on phenotypic variation and developmental stability in Drosophila melanogaster and Drosophila buzzatii. Biol J Linn Soc. 1997;61:117–126. [Google Scholar]
- Jablonka E, Oborny B, Molnar I, Kisdi E, Hofbauer J, Czaran T. The adaptive advantage of phenotypic memory in changing environments. Phil Trans R Soc B. 1995;350:133–141. doi: 10.1098/rstb.1995.0147. [DOI] [PubMed] [Google Scholar]
- Johnson MS. Effects of migration and habitat choice on shell banding frequencies in Theba pisana at a habitat boundary. Heredity. 1981;47:121–133. doi: 10.1038/hdy.1981.65. [DOI] [Google Scholar]
- Johnson MS. Thirty-four years of climatic selection in the land snail Theba pisana. Heredity. 2011;106:741–748. doi: 10.1038/hdy.2010.114. [DOI] [PMC free article] [PubMed] [Google Scholar]
- Johnson MS. Epistasis, phenotypic disequilibrium and contrasting associations with climate in the land snail Theba pisana. Heredity. 2012;108:229–235. doi: 10.1038/hdy.2011.62. [DOI] [PMC free article] [PubMed] [Google Scholar]
- Jombart T. Adegenet: a R package for the multivariate analysis of genetic markers. Bioinformatics. 2008;24:1403–1405. doi: 10.1093/bioinformatics/btn129. [DOI] [PubMed] [Google Scholar]
- Jones JS, Selander RK, Schnell GD. Patterns of morphological and molecular polymorphism in the land snail Cepaea nemoralis. Biol J Linn Soc. 1982;14:359–387. doi: 10.1111/j.1095-8312.1980.tb00114.x. [DOI] [Google Scholar]
- Kartavtsev YP, Lee JS. Analysis of nucleotide diversity at the cytochrome b and cytochrome oxidase 1 genes at the population, species, and genus levels. Russ J Genet. 2006;42:341–362. doi: 10.1134/S1022795406040016. [DOI] [PubMed] [Google Scholar]
- Kiss L, Labaune C, Magnin F, Aubry S. Plasticity of the life cycle of Xeropicta derbentina (Krynicki, 1836), a recently introduced snail in Mediterranean France. J Molluscan Stud. 2005;71:221–231. doi: 10.1093/mollus/eyi030. [DOI] [Google Scholar]
- Köhler H-R, Triebskorn R, Stöcker W, Kloetzel PM, Alberti G. The 70kD heat shock protein (Hsp 70) in soil invertebrates: a possible tool for monitoring environmental toxicants. Arch Environ Contam Toxicol. 1992;22:334–338. doi: 10.1007/BF00212095. [DOI] [PubMed] [Google Scholar]
- Köhler H-R, Eckwert H, Triebskorn R, Bengtsson G. Interaction between tolerance and 70 kD stress protein (Hsp70) induction in collembolan populations exposed to long-term metal pollution. Appl Soil Ecol. 1999;11:43–52. doi: 10.1016/S0929-1393(98)00127-9. [DOI] [Google Scholar]
- Köhler H-R, Zanger M, Eckwert H, Einfeldt I. Selection favours low Hsp70 levels in chronically metal-stressed soil arthropods. J Evol Biol. 2000;13:569–582. doi: 10.1046/j.1420-9101.2000.00210.x. [DOI] [Google Scholar]
- Köhler H-R, Alberti G, Seniczak S, Seniczak A. Lead-induced hsp70 and hsp60 pattern transformation and leg malformation during postembryonic development in the oribatid mite, Archegozetes longisetosus Aoki. Comp Biochem Physiol C. 2005;141:398–405. doi: 10.1016/j.cbpc.2005.09.003. [DOI] [PubMed] [Google Scholar]
- Köhler H-R, Lazzara R, Dittbrenner N, Capowiez Y, Mazzia C, Triebskorn R. Snail phenotypic variation and stress proteins: do different heat response strategies contribute to Waddington’s Widget in field populations? J Exp Zool B Mol Dev Evol. 2009;312B:136–147. doi: 10.1002/jez.b.21253. [DOI] [PubMed] [Google Scholar]
- Köhler H-R, Schultz C, Scheil AE, Triebskorn R, Seifan M, Di Lellis MA. Historic data analysis reveals ambient temperature as a source of phenotypic variation in snail populations. Biol J Linn Soc. 2013;119:241–256. doi: 10.1111/bij.12035. [DOI] [Google Scholar]
- Krebs RA, Feder ME. Deleterious consequences of Hsp70 overexpression in Drosophila melanogaster larvae. Cell Stress Chaperones. 1997;2:60–71. doi: 10.1379/1466-1268(1997)002<0060:DCOHOI>2.3.CO;2. [DOI] [PMC free article] [PubMed] [Google Scholar]
- Krebs RA, Loeschcke V. Costs and benefits of activation of the heat shock response in Drosophila melanogaster. Funct Ecol. 1994;8:730–737. doi: 10.2307/2390232. [DOI] [Google Scholar]
- Kristensen TN, Hoffmann AA, Overgaard J, Sorensen JG, Hallas R, Loeschcke V. Costs and benefits of cold acclimation in field-released Drosophila. Proc Natl Acad Sci U S A. 2008;105:216–221. doi: 10.1073/pnas.0708074105. [DOI] [PMC free article] [PubMed] [Google Scholar]
- Lewis S, Handy RD, Cordi B, Billinghurst Z, Depledge MH. Stress proteins (Hsps): methods of detection and their use as an environmental biomarker. Ecotoxicology. 1999;8:351–368. doi: 10.1023/A:1008982421299. [DOI] [Google Scholar]
- Lindquist S, Craig EA. The heat shock proteins. Ann Rev Genet. 1988;22:631–677. doi: 10.1146/annurev.ge.22.120188.003215. [DOI] [PubMed] [Google Scholar]
- Machin J. The permeability of the epiphragm of terrestrial snails to water vapor. Biol Bull Mar Biol Lab Woods Hole. 1968;134:87–95. doi: 10.2307/1539969. [DOI] [Google Scholar]
- Manitasevic S, Dunderski J, Matic G, Tucic B. Seasonal variation in heat shock proteins Hsp70 and Hsp90 expression in an exposed and a shaded habitat of Iris pumila. Plant Cell Environ. 2007;30:1–11. doi: 10.1111/j.1365-3040.2006.01596.x. [DOI] [PubMed] [Google Scholar]
- Mayer MP, Bukau B. Hsp70 chaperones: cellular functions and molecular mechanism. Cell Mol Life Sci. 2005;62:670–684. doi: 10.1007/s00018-004-4464-6. [DOI] [PMC free article] [PubMed] [Google Scholar]
- Mazek-Fialla K. Die Lebensweise xerophiler Schnecken Syriens, Griechlands, Dalmatiens und der Türkei und die Beschaffenheit ihrer subepithelialen Drüsen. Z Morphol Okol Tiere. 1934;28:445–468. doi: 10.1007/BF00408297. [DOI] [Google Scholar]
- Mizrahi T, Heller J, Goldenberg S, Arad Z. Heat shock proteins and resistance to desiccation in congeneric land snails. Cell Stress Chaperones. 2009;15:351–363. doi: 10.1007/s12192-009-0150-9. [DOI] [PMC free article] [PubMed] [Google Scholar]
- Müller GB. Embryonic motility: environmental influences and evolutionary innovation. Evol Dev. 2003;5:56–60. doi: 10.1046/j.1525-142X.2003.03009.x. [DOI] [PubMed] [Google Scholar]
- Nei M. Analysis of gene diversity in subdivided populations. Proc Natl Acad Sci U S A. 1973;70:3321–3323. doi: 10.1073/pnas.70.12.3321. [DOI] [PMC free article] [PubMed] [Google Scholar]
- Norris CE & Hightower LE (2000) The heat shock response of tropical and desert fish (genus Poeciliopsis). Environmental Stressors and Gene Responses. In: Storey KB & Storey JM (Eds) Elsevier Science, Series: Cell and Molecular Responses to Stress, pp 231–244
- Oksanen J, Guillaume Blanchet F, Kindt R, Legendre P, Minchin PR, O’Hara RB, Simpson GL, Solymos P, Henry M, Stevens H & Wagner H (2012) vegan: Community Ecology Package R package version 2.0-5 http://CRAN.R-project.org/package=vegan
- Parsell DA, Lindquist S. The function of heat-shock proteins in stress tolerance: degradation and reactivation of damaged proteins. Annu Rev Genet. 1993;27:437–496. doi: 10.1146/annurev.ge.27.120193.002253. [DOI] [PubMed] [Google Scholar]
- Pörtner HO, Farrell AP. Ecology: physiology and climate change. Science. 2008;322:690–692. doi: 10.1126/science.1163156. [DOI] [PubMed] [Google Scholar]
- Price TD, Qvarnström A, Irwin DE. The role of phenotypic plasticity in driving genetic evolution. Proc R Soc Lond B. 2003;270:1433–1440. doi: 10.1098/rspb.2003.2372. [DOI] [PMC free article] [PubMed] [Google Scholar]
- Queitsch C, Sangster TA, Lindquist S. Hsp90 as a capacitor of phenotypic variation. Nature. 2002;417:618–624. doi: 10.1038/nature749. [DOI] [PubMed] [Google Scholar]
- R Development Core Team (2011) R: A Language and Environment for Statistical Computing. R Foundation for Statistical Computing, Vienna, Austria. ISBN 3-900051-07-0 http://www.R-project.org
- Rebeiz M, Pool JE, Kassner VA, Aquadro CF, Carroll SB. Stepwise modification of a modular enhancer underlies adaptation in a Drosophila population. Science. 2009;326:1663–1667. doi: 10.1126/science.1178357. [DOI] [PMC free article] [PubMed] [Google Scholar]
- Roberts SP, Feder ME. Natural hyperthermia and expression of the heat shock protein Hsp70 affect developmental abnormalities in Drosophila melanogaster. Oecologia. 1999;121:323–329. doi: 10.1007/s004420050935. [DOI] [PubMed] [Google Scholar]
- Rosseel Y (2012) lavaan: An R package for structural equation modeling. J Stat Softw 48:1--16
- Royer DL, Meyerson LA, Robertson KM, Adams JM. Phenotypic plasticity of leaf shape along a temperature gradient in Acer rubrum. PLoS ONE. 2009;4:e7653. doi: 10.1371/journal.pone.0007653. [DOI] [PMC free article] [PubMed] [Google Scholar]
- Rutherford SL. Between genotype and phenotype: protein chaperones and evolvability. Nat Rev Genet. 2003;4:263–274. doi: 10.1038/nrg1041. [DOI] [PubMed] [Google Scholar]
- Rutherford SL, Lindquist S. Hsp90 as a capacitor for morphological evolution. Nature. 1998;396:336–342. doi: 10.1038/24550. [DOI] [PubMed] [Google Scholar]
- Schrader M, Hauffe T, Zhang Z, Davis GM, Jopp F, Remais JV, Wilke T. Spatially explicit modeling of schistosomiasis risk in Eastern China based on a synthesis of epidemiological, environmental and intermediate host genetic data. PLoS Negl Trop Dis. 2013;7:e2327. doi: 10.1371/journal.pntd.0002327. [DOI] [PMC free article] [PubMed] [Google Scholar]
- Silbermann R, Tatar M. Reproduction costs of heat shock protein in transgenic Drosophila melanogaster. Evolution. 2000;54:2038–2045. doi: 10.1111/j.0014-3820.2000.tb01247.x. [DOI] [PubMed] [Google Scholar]
- Sisodia S, Singh BN. Variations in morphological and life-history traits under extreme temperatures in Drosophila ananassae. J Biosci. 2009;34:263–274. doi: 10.1007/s12038-009-0030-6. [DOI] [PubMed] [Google Scholar]
- Sørensen JG, Michalak P, Justesen J, Loeschcke V. Expression of the heat shock protein HSP70 in Drosophila buzzatii lines selected for thermal resistance traits. Hereditas. 1999;131:155–164. doi: 10.1111/j.1601-5223.1999.00155.x. [DOI] [PubMed] [Google Scholar]
- Sørensen JG, Dahlgaard J, Loeschcke V. Genetic variation in thermal tolerance among natural populations of Drosophila buzzatii: down regulation of Hsp70 expression and variation in heat stress resistance traits. Funct Ecol. 2001;15:289–296. doi: 10.1046/j.1365-2435.2001.00525.x. [DOI] [Google Scholar]
- Sultan SE. Development in context: the timely emergence of eco-devo. Trends Ecol Evol. 2007;22:575–582. doi: 10.1016/j.tree.2007.06.014. [DOI] [PubMed] [Google Scholar]
- Waddington CH. Canalization of development and the inheritance of acquired characters. Nature. 1942;150:563–565. doi: 10.1038/150563a0. [DOI] [PubMed] [Google Scholar]
- Wood SN. Fast stable restricted maximum likelihood and marginal likelihood estimation of semiparametric generalized linear models. J R Stat Soc B. 2011;73(1):3–36. doi: 10.1111/j.1467-9868.2010.00749.x. [DOI] [Google Scholar]
- Zatsepina OG, Velikodvorskaia VV, Molodtsov VB, Garbuz D, Lerman DN, Bettencourt BR, Feder ME, Evgenev MB. A Drosophila melanogaster strain from sub-equatorial Africa has exceptional thermotolerance but decreased Hsp70 expression. J Exp Biol. 2001;204:1869–1881. doi: 10.1242/jeb.204.11.1869. [DOI] [PubMed] [Google Scholar]