Abstract
Background
Mixed lineage kinase domain-like protein (MLKL) is a necrosome component mediating programmed necrosis that may be an important determinant of cancer cell death. The goal of the current study was to evaluate the prognostic value of MLKL expression in patients with pancreatic adenocarcinoma (PAC).
Methods
Tissue from 80 patients was collected from a prospectively maintained database of patients with PAC who underwent pancreaticoduodenectomy between January 2000 and October 2008. Immunohistochemistry analysis was performed and scored using an established scoring system. Kaplan-Meier survival curves were generated for recurrence-free survival (RFS) and overall survival (OS) for all patients and for patients receiving adjuvant chemotherapy. MLKL scores were correlated with RFS and OS using univariate and multivariate Cox regression analyses incorporating clinically relevant covariates.
Results
The median age of the patients was 63 years and 53% were men. Low MLKL expression was associated with decreased OS (6 months vs 17 months; P=.006). In the subset of 59 patients who received adjuvant chemotherapy, low MLKL expression was associated with decreased RFS (5 months vs 15 months; P=.006) and decreased OS (6 months vs 19 months; P<.0001). On multivariate analysis, low MLKL expression was associated with poor OS in all patients (hazards ratio, 4.6 [95% confidence interval, 1.6-13.8]; P=.006) and in patients receiving adjuvant chemotherapy (hazards ratio, 8.1 [95% confidence interval, 2.2-29.2]; P=.002).
Conclusions
Low expression of MLKL is associated with decreased OS in patients with resected PAC and decreased RFS and OS in the subset of patients with resected PAC who receive adjuvant chemotherapy. The use of this biomarker in patients with PAC may provide important prognostic information.
Keywords: mixed lineage kinase domain-like protein (MLKL), pancreatic cancer, biomarker, necrosis, necroptosis
Introduction
Pancreatic adenocarcinoma (PAC) is the fourth leading cause of cancer-related mortality in the United States, with a 5-year survival rate of 6% for all patients.1 In 2012, there were 43,920 new diagnoses of PAC and 37,390 deaths attributed to the disease.1 Patients who have early-stage resectable PAC have significantly improved outcomes. Treatment for these patients includes surgical resection and adjuvant therapy, of which gemcitabine remains the primary chemotherapeutic agent.2,3 However, the 5-year survival rate for these patients is still only approximately 20%, with a wide range of clinical outcomes.4 PAC is a genetically heterogeneous disease and as such, determining genetic biomarkers with prognostic and predictive value may play a critical role in determining the best course of therapy for patients with early-stage PAC.
Necrosis is a form of cell death characterized morphologically by cell rounding, cell volume increase, organelle swelling, nuclear membrane dilation, chromatin condensation, disruption of the cytoplasmic membrane, and a lack of caspase activation. Necrosis is a common feature of tumors and is often observed in their centers, and many cancer treatments, including chemotherapy and radiation, induce necrotic cell death.5-7 In contrast to apoptosis, necrosis has traditionally been thought of as a passive, unregulated process; however, emerging evidence has shown that necrosis can also occur in a regulated and controlled manner.8 The initiation of necroptosis or programmed necrosis requires activation of the receptor-interacting protein 1(RIP1) and receptor-interacting protein 3 (RIP3) kinases. RIP3 interacts with and phosphorylates mixed lineage kinase domain-like protein (MLKL) to promote necrosis, thus identifying MLKL as a key down-stream effector of necroptosis signaling.9,10 MLKL depletion in cancer cells also leads to the spontaneous phosphorylation of H2AX,11 an early marker for DNA damage, and a G2/M-cell cycle checkpoint deficit after ionizing radiation treatment,12 suggesting that MLKL may play a critical role in the response to DNA damage. Collectively, these findings suggest that MLKL may be an important determinant of cancer cell death, response to therapy, and outcome in patients with cancer. The prognostic value of MLKL and more generally of necroptosis in cancer is not known. Despite this, MLKL was demonstrated to be above the 90th percentile for differential expression in pancreatic cancer cell lines and patient samples through mining published data sets, indicating its potential role as a biomarker.13,14 The aim of the current study was to investigate the prognostic value of MLKL expression in patients with early-stage, resected PAC.
Materials and Methods
Patient Selection
Our institution has previously reported on a group of 95 patients from a prospectively maintained database of resected early-stage pancreatic cancer.15,16 Eighty patients for whom adequate tumor tissue remained were selected for further analysis. These patients underwent pancreaticoduodenectomy between January 2000 and October 2008. Recurrence-free survival (RFS) was measured based on surveillance imaging obtained at regular intervals after surgical resection. Overall survival (OS) was calculated from the date of surgery. Tumor characteristics and patient treatment characteristics were based on chart review and previous analysis of the database. Permission was obtained from the Institutional Review Board and patient confidentiality was maintained according to the Health Insurance Portability and Accountability Act (HIPAA) of 1996.
Immunohistochemical Analysis
Formalin-fixed paraffin-embedded slides were used to identify representative sections of tumor and normal tissue. The tissue was stained using anti-MLKL antibody monoclonal mouse antibody (ab118348; Abcam, Cambridge, Mass) at a concentration of 1:50. An expression score was calculated using a previously defined scoring system.15,17 After examining a 4-level model for MLKL expression (Fig. 1), the extreme outliers for MLKL expression were chosen by dividing the overall score into low-expression (≤ 1) and high-expression (> 1) groups.
Figure 1.
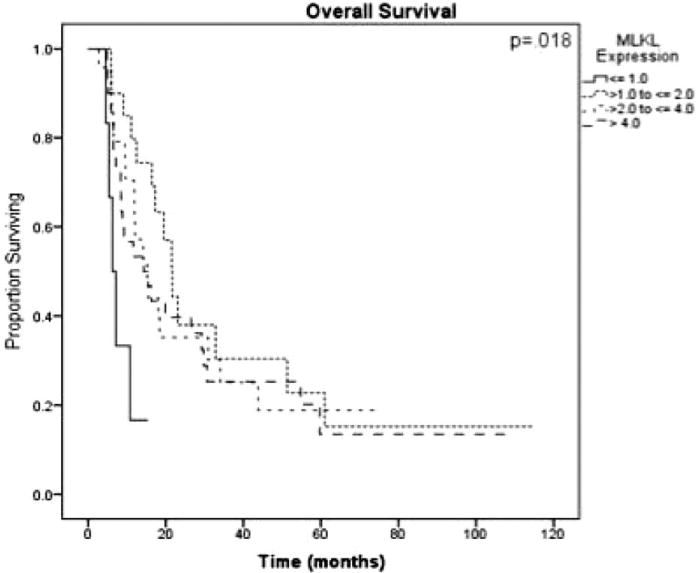
Kaplan-Meier log-rank survival analysis for mixed lineage kinase domain-like protein (MLKL) expression in patients undergoing adjuvant therapy (n = 59) is shown, demonstrating the extreme outliers found in the group of patients with the lowest MLKL expression (those with an expression score < 1).
Statistical Analysis
Kaplan-Meier log-rank survival analysis was performed to determine prognostic factors for RFS and OS. Univariate and multivariate Cox regression analyses were performed for all patients to examine the impact of MLKL expression on both RFS and OS. Factors examined on univariate analysis included age, sex, ethnicity, receipt of adjuvant and neoadjuvant therapy, tumor size, surgical margin status, grade, lymph node status, perineural invasion, lymphovascular invasion, receipt of radiotherapy, CA 19-9 levels, and type of adjuvant chemotherapy administered. Clinically relevant covariates significant to a level of P < .2 on univariate analysis for either RFS or OS were included in the multivariate model; these included tumor size, surgical margin status, lymph node status, perineural invasion, lymphovascular invasion, and tumor grade. Subset analyses were performed for patients receiving any adjuvant therapy and patients receiving gemcitabine therapy using the same methodology of Kaplan-Meier survival analysis followed by univariate and multivariate Cox regression analyses. Data were analyzed using the Statistical Package for the Social Sciences software (version 19.0 for Windows; SPSS Inc, Chicago, Ill).
Results
The demographic, pathologic, and treatment characteristics of the patient population in the current study are summarized in Table 1. Forty-two of the 80 patients (52.5%) included in the current analysis were men and 59 (73.8%) were white. Tumor size ranged from 1 cm to 6 cm, with a median of 3.3 cm. Twenty patients (25%) had positive surgical margins and 48 (60%) had positive lymph nodes. There was no 30-day mortality. The median follow-up for survivors was 53 months (range, 6 months-114 months). At the time of last follow-up, 77.5% of patients had died and 17.5% had no evidence of disease. The median RFS for all patients was 9.3 months (range, 0.6 months-119.8 months) and the median OS for all patients was 15.4 months (range, 2.8 months-114.6 months). Two patients received neoadjuvant therapy; 59 (73.8%) patients received adjuvant therapy. The most common chemotherapy agent used was gemcitabine (41 of 59 patients treated with adjuvant therapy; 69.5%) and the majority of patients who received adjuvant chemotherapy also received radiotherapy (39 of 59 patients; 66.1%).
Table 1. Patient Demographics, Tumor Characteristics, and Treatment Characteristics for All Patients (n = 80).
| No. of Patients | Percentage | ||
|---|---|---|---|
| Patient Demographics | |||
| Male sex | 42 | 52.5 | |
| Ethnicity | |||
| Asian | 2 | 2.5 | |
| Black | 15 | 18.8 | |
| White | 59 | 73.8 | |
| Median age (range), y | 63.1 (37-84) | ||
| Median OS (range), mo | 15.4 (2.8-114.6) | ||
| Median RFS (range), mo | 9.3 (0.6-119.8) | ||
| Tumor Characteristics | |||
| Positive surgical margins | 20 | 25.0 | |
| Grade | |||
| 1 | 5 | 6.3 | |
| 2 | 46 | 57.5 | |
| 3 | 28 | 35.0 | |
| Positive lymph nodes | 48 | 60.0 | |
| PNI | 70 | 87.5 | |
| LVI | 38 | 47.5 | |
| High MLKL expression | 74 | 92.5 | |
| Median tumor size | 3.3 (1-6) | ||
| (range), cm | |||
| Treatment Characteristics | |||
| Neoadjuvant therapy | 2 | 2.5 | |
| Radiotherapy | 39 | 48.8 | |
| Received gemcitabine | 41 | 51.3 |
Abbreviations: LVI, lymphovascular invasion; MLKL, mixed lineage kinase domain-like protein; OS, overall survival; PNI, perineural invasion; RFS, recurrence-free survival.
MLKL Expression
According to our definition of high-expression and low-expression groups, 74 patients (92.5%) exhibited high tumoral MLKL expression. Thirty-nine patients (48.8%) had > 80% of cells staining for MLKL and the intensity of staining was recorded as high in 13 of the 80 samples (16.3%). Examples of typical high and low staining patterns for MLKL are shown in Figure 2.
Figure 2.
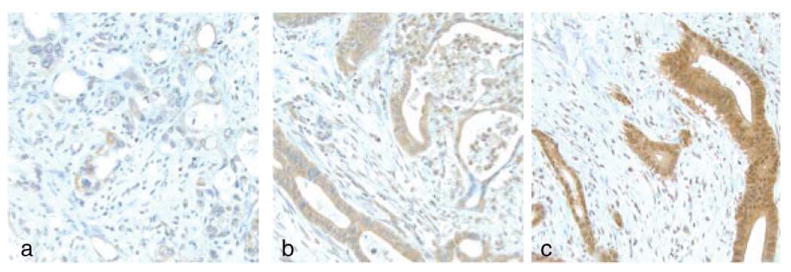
Immunohistochemical expression of mixed lineage kinase domain-like protein (MLKL) in tumor tissue is shown. The intensity of the cytoplasmic expression of MLKL in tumor cells was graded as (A) low, (B) medium, or (C) high.
Survival Analyses: All Patients
Kaplan-Meier survival analyses for all 80 patients demonstrated no association between MLKL expression and RFS (5.3 months vs 15 months; P = .214) (Fig. 3A), but low MLKL expression was found to be significantly associated with decreased OS (6.3 months vs 17.3 months; P = .006) (Fig. 3B). Table 2 shows the factors found to be significantly associated with OS and RFS on univariate and multivariate) Cox regression analysis. Low MLKL expression was associated with decreased OS on both univariate (hazards ration [HR] 4.6 [95% confidence interval (95% CI), 1.6-13.8]; P = .01) and multivariate (HR, 3.6 [95% CI, 1.6-13.8]; P = .006) analysis.
Figure 3.
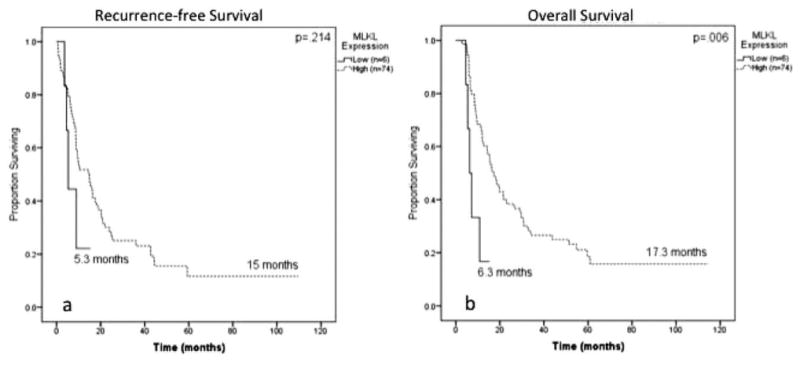
Kaplan-Meier log-rank survival analysis is shown for mixed lineage kinase domain-like protein (MLKL) expression in all patients (n = 80). (A) The effect of MLKL expression on recurrence-free survival is shown. (B) The effect of MLKL expression on overall survival is shown.
Table 2. Univariate and Multivariate Cox Regression Analyses for All Patients (n = 80).
| Outcome | RFS | OS | ||||||
|---|---|---|---|---|---|---|---|---|
|
|
|
|||||||
| Univariate | Multivariatea | Univariate | Multivariatea | |||||
|
|
|
|
|
|||||
| HR (95% CI) | Pb | HR (95% CI) | P | HR (95% CI) | P | HR (95% CI) | P | |
| Tumor size | 1.3 (1.0-1.6) | .02 | 1.3 (1.0-1.6) | .04 | 1.3 (1.0-1.6) | .02 | 1.2 (1.0-1.6) | 0.1 |
| Positive surgical margins | 1.8 (1.1-3.0) | .02 | 1.4 (0.8-2.4) | 0.3 | 1.7 (1.1-2.8) | .03 | 1.2 (0.7-2.1) | 0.4 |
| Positive lymph nodes | 1.8 (1.0-3.0) | .04 | 1.5 (0.8-2.9) | 0.2 | 2.0 (1.1-3.4) | .01 | 1.6 (0.8-2.9) | 0.2 |
| PNI | 1.0 (0.5-2.1) | 0.9 | 0.9 (0.4-1.9) | 0.7 | 3.9 (1.2-12.4) | .02 | 4.4 (1.3-15) | .02 |
| LVI | 1.5 (0.9-2.5) | 0.1 | 1.3 (0.7-2.3) | 0.4 | 2.0 (1.2-3.3) | .01 | 1.4 (0.8-1.8) | 0.3 |
| Higher grade | 1.3 (0.9-2.0) | 0.2 | 1.2 (0.8-1.9) | 0.4 | 1.3 (0.8-1.9) | 0.3 | 1.1 (0.7-1.8) | 0.7 |
| MLKL scorec | 2 (0.7-5) | 0.2 | 1.4 (0.5-5) | 0.6 | 4.6 (1.6-13.8) | .01 | 3.6 (1.6-13.8) | .006 |
Abbreviations: 95% CI, 95% confidence interval; HR, hazards ratio; LVI, lymphovascular invasion; MLKL, mixed lineage kinase domain-like protein; OS, overall survival; PNI, perineural invasion; RFS, recurrence-free survival.
Multivariate analysis includes all clinically relevant covariates found to have a P value < .2 on univariate analysis.
Bold type denotes statistical significance.
MLKL score is decreasing from high expression to low expression.
Subset Analyses: Patients Receiving Adjuvant Therapy
In the subset of patients receiving adjuvant therapy (n = 59), low MLKL expression was associated with decreased RFS (4.5 months vs 15 months; P=.006) (Fig. 4A) and decreased OS (6.3 months vs 18.4 months; P<.0001) (Fig. 4B). This relationship persisted on multivariate analysis for RFS (HR, 4.7 [95% CI, 1.3-16.4]; P=.016) and OS (HR, 8.1 [95% CI, 2.2-29.2]; P = .002). The multivariate Cox regression analysis for patients receiving adjuvant therapy is shown in Table 3.
Figure 4.
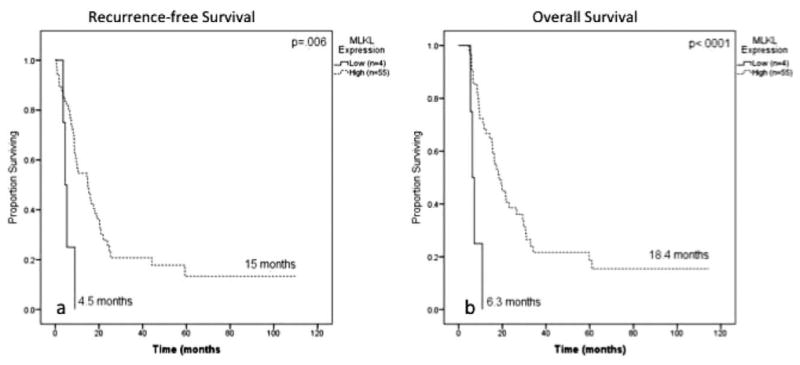
Kaplan-Meier log-rank survival analysis for mixed lineage kinase domain-like protein (MLKL) expression is shown in patients receiving adjuvant therapy (n = 59). (A) The effect of MLKL expression on recurrence-free survival is shown. (B) The effect of MLKL expression on overall survival is shown.
Table 3. Multivariatea Cox Regression Analyses for Patients Treated With Adjuvant Therapy (n = 59).
| Outcome | RFS | OS | ||||
|---|---|---|---|---|---|---|
|
|
|
|||||
| HR | 95% CI | Pb | HR | 95% CI | P | |
| Tumor size | 1.545 | 1.195-1.999 | .001 | 1.374 | 1.042-1.812 | .024 |
| Positive surgical margins | 0.880 | 0.434-1.785 | .724 | 0.892 | 0.435-1.831 | .756 |
| Higher grade | 0.857 | 0.464-1.580 | .620 | 0.866 | 0.465-1.613 | .651 |
| Positive lymph nodes | 1.849 | 0.898-3.804 | .095 | 1.747 | 0.856-3.566 | .125 |
| PNI | 0.408 | 0.160-1.043 | .061 | 1.682 | 0.501-5.652 | .400 |
| LVI | 0.834 | 0.410-1.697 | .617 | 0.960 | 0.478-1.929 | .910 |
| MLKL expressionc | 4.7 | 1.3-16.4 | .016 | 8.1 | 2.2-29.2 | .002 |
Abbreviations: 95% CI, 95% confidence interval; HR, hazards ratio; LVI, lymphovascular invasion; MLKL, mixed lineage kinase domain-like protein; OS, overall survival; PNI, perineural invasion; RFS, recurrence-free survival.
Multivariate analysis includes all clinically relevant covariates found to have a P value <.2 on univariate analysis.
Bold type denotes statistical significance.
MLKL score is decreasing from high expression to low expression.
A second subset analysis was performed in patients receiving only gemcitabine-based therapy (n=31). On Kaplan-Meier analysis, low MLKL expression remained associated with poor OS (7.2 months vs 17.3 months; P=.024) (Fig. 5). Although the multivariate analysis was limited by sample size, low MLKL expression remained associated with poor RFS (HR, 6.4 [95% CI, 1.2-34.0]; P=.03) and poor OS (HR, 3.9 [95% CI, 1.01-27.7]; P=048) (Table 4) after accounting for other adverse tumor factors.
Figure 5.
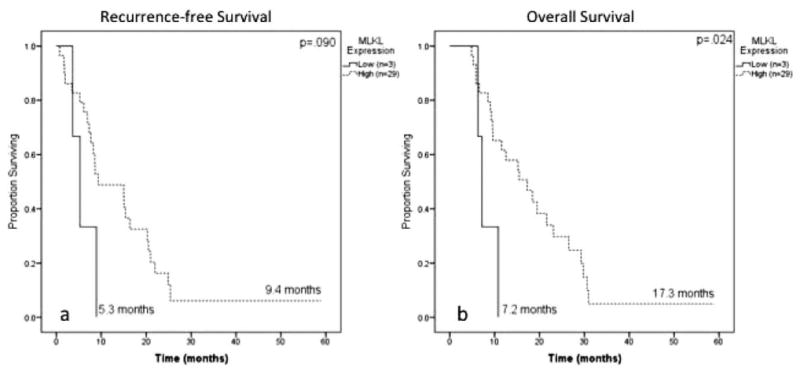
Kaplan-Meier log-rank survival analysis for mixed lineage kinase domain-like protein (MLKL) expression is shown in patients receiving gemcitabine therapy (n = 32). (A) The effect of MLKL expression on recurrence-free survival is shown. (B) The effect of MLKL expression on overall survival is shown.
Table 4. Multivariatea Cox Regression Analyses for Patients Treated With Gemcitabine Only (n = 31).
| Outcome | RFS | OS | ||||
|---|---|---|---|---|---|---|
|
|
|
|||||
| HR | 95% CI | Pb | HR | 95% CI | P | |
| Tumor size | 1.301 | 0.923-1.834 | .133 | 1.161 | 0.783-1.722 | .458 |
| Positive surgical margins | 0.216 | 0.043-1.089 | .063 | 0.246 | 0.048-1.263 | .093 |
| Higher grade | 0.797 | 0.320-1.984 | .626 | 0.969 | 0.428-2.193 | .940 |
| Positive lymph nodes | 2.057 | 0.844-5.013 | .113 | 1.931 | 0.772-4.827 | .159 |
| PNI | 0.373 | 0.095-1.458 | .156 | 0.945 | 0.221-4.041 | .940 |
| LVI | 0.593 | 0.206-1.708 | .333 | 1.107 | 0.394-3.108 | .847 |
| MLKL expressionc | 6.4 | 1.2-34.0 | .030 | 3.9 | 1.01-27.7 | .048 |
Abbreviations: 95% CI, 95% confidence interval; HR, hazards ratio; LVI, lymphovascular invasion; MLKL, mixed lineage kinase domain-like protein; OS, overall survival; PNI, perineural invasion; RFS, recurrence-free survival.
Multivariate analysis includes all clinically relevant covariates found to have a P value <.2 on univariate analysis.
Bold type denotes statistical significance.
MLKL score is decreasing from high expression to low expression.
MLKL Interaction With ERCC1 and RRM2
High expression of 2 biomarkers, excision repair cross-complementing gene-1 (ERCC1) and ribonucleotide reductase subunit M2 (RRM2), has previously been shown to be associated with poor RFS and OS in this patient population.7,18 After accounting for ERCC1 and RRM2 expression, low MLKL expression remained a significant independent negative prognostic factor for OS in all patients (HR, 11.4 [95% CI, 3.4-27.9]; P < .001); high ERCC1 expression (HR, 4.1 [95% CI, 2.0-8.6]; P<.001) and high RRM2 expression (HR, 3.3 [95% CI, 1.6-6.9]; P=.001) also remained significant (Table 5).
Table 5. Multivariatea Cox Regression Analyses for MLKL, ERCC1 and RRM2 Expression in All Patients (n = 80).
| Outcome | OS | ||
|---|---|---|---|
|
| |||
| HR | 95% CI | Pb | |
| Tumor size | 1.032 | 0.789-1.350 | .818 |
| Positive surgical margins | 1.447 | 0.889-2.355 | .138 |
| Higher grade | 1.174 | 0.727-1.894 | .512 |
| Positive lymph nodes | 1.619 | 0.866-3.028 | .132 |
| PNI | 5.947 | 1.693-20.895 | .005 |
| LVI | 1.331 | 0.734-2.412 | .346 |
| MLKL expressionc | 11.4 | 3.4-27.9 | <.001 |
| ERCC1 expression | 4.100 | 1.951-8.615 | <.001 |
| RRM2 expression | 3.314 | 1.589-6.910 | .001 |
Abbreviations: 95% CI, 95% confidence interval; ERCC1, excision repair cross-complementing gene-1; HR, hazards ratio; LVI, lymphovascular invasion; MLKL, mixed lineage kinase domain-like protein; OS, overall survival; PNI, perineural invasion; RRM2, ribonucleotide reductase subunit M2.
Multivariate analysis includes all clinically relevant covariates found to have a P value <.2 on univariate analysis.
Bold type denotes statistical significance.
MLKL score is decreasing from high expression to low expression. ERCC1 and RRM2 expression are increasing from low overall score to high overall score.
Discussion
The results of the current study demonstrate that MLKL expression is a prognostic biomarker in patients with early-stage PAC, thereby providing to the best of our knowledge the first scientific evidence that expression of a necroptosis protein has prognostic value in patients with cancer. In the current study, low MLKL expression was associated with decreased OS regardless of whether adjuvant therapy was received, and the prognostic value was found to be strengthened in the subset of patients receiving adjuvant therapy, in whom low MLKL expression was associated with both decreased RFS and OS, even after adjusting for other adverse prognostic factors. The HR for death associated with low MLKL expression became stronger in the group of patients treated with adjuvant therapy than in all patients, and was strongest in those patients receiving gemcitabine chemotherapy, suggesting that MLKL expression may be worth evaluating as a predictive biomarker for gemcitabine sensitivity. The prognostic value of MLKL expression was also evaluated against 2 established biomarkers with prognostic value, ERCC1 and RRM2 expression,15,16 and MLKL expression remained a significant independent predictor of OS.
The finding that low MLKL expression was associated with worse prognosis in patients with early-stage PAC may be a result of decreased necroptosis signaling in these patients and suggests that necroptosis is an important determinant of cancer cell death and outcome in patients with PAC. In this regard, those proteins involved in apoptosis, tumor growth, angiogenesis, invasion and metastasis, and chemotherapy metabolism have been identified as prognostic biomarkers in patients with PAC.19,20 The results of the current study extend these data and have now demonstrated that expression of a protein involved in necroptosis signaling is also prognostic in patients with PAC.
Given the evidence that patients with low tumoral MLKL expression have a poor prognosis, it is possible that adjuvant therapy regimens could be tailored to individualize patient treatment based on MLKL expression. Patients with early-stage resected PAC with low MLKL expression may be less likely to benefit from the morbidity of adjuvant chemotherapy given the limited 2-month survival advantage of patients treated with adjuvant chemotherapy. Thus, these patients may benefit from more aggressive chemotherapy regimens or participation in clinical trials. The usefulness of MLKL expression as a prognostic and potentially predictive biomarker requires validation in prospective studies. Several trials of various prognostic biomarkers in the adjuvant setting have already been completed, including a large secondary analysis of the Radiation Therapy Oncology Group (RTOG) 97-04 study, a randomized trial of adjuvant prechemotherapy and postchemoradiotherapy gemcitabine versus 5-fluoruracil, in which high human equilibrative nucleoside transporter 1 (hENT1) expression was associated with increased survival only in the patients receiving gemcitabine, demonstrating predictive value for response to gemcitabine therapy in the adjuvant setting.21 Recently at our institution, Fisher et al16 demonstrated significant clinical prognostic value for ERCC1 and RRM2, both of which have demonstrated an association between protein overexpression and chemotherapy resistance and cellular invasiveness18,22 and have been implicated in other gastrointestinal can-cers.23,24 Other reported prognostic markers in the adjuvant setting in PAC include C-X-C chemokine receptor type 4 (CXCR4), chemokine (C-X3-C motif) ligand 1 (CX3CL1)/CX3C chemokine receptor 1 (CX3CR1), DPC4/SMAD4, and nuclear factor kappa B (NF-kappaB).25-28 Future prospective studies may focus on the identification of a prognostic panel incorporating multiple prognostic biomarkers.
Limitations of the current study include small patient numbers, the inherent biases of a retrospective study design, and heterogeneity of treatment regimens. Nevertheless, the data demonstrate a novel association between low MLKL expression and worse prognosis in patients with early-stage resected PAC. The heterogeneity of adjuvant regimens in our patient population precludes us from evaluating MLKL as a predictive biomarker for response to gemcitabine. However, the evidence presented provides hypothesis-generating momentum to study MLKL expression in future prospective studies of patients undergoing adjuvant therapy for PAC. In addition, MLKL may play an important role as a component of a genetic panel that incorporates multiple biomarkers in an effort to improve our ability both to prognosticate outcome and to predict response to therapy. In future studies, we plan to confirm this pilot data by using a larger patient cohort as a validation set, thereby increasing the cohort of patients with low MLKL expression and determining whether a multiple gene expression signature has greater prognostic value than MLKL alone.
In the current study, we identified MLKL expression as an independent prognostic biomarker for patients with early-stage resected PAC, even after accounting for adverse tumor characteristics and other known prognostic biomarkers. These findings suggest that although MLKL expression may be a useful prognostic marker, it needs to be validated in other patient populations and in larger studies. Future studies should also examine the role of MLKL in predicting response to gemcitabine therapy. In addition, given the remaining ambiguity of the role of MLKL in the necroptosis pathway, future studies should examine its mechanism and pathway of action, including potential drug targets. The potential exists for clinicians to use biomarkers such as MLKL to better select patients to receive adjuvant therapy.
Acknowledgments
Funding Support: Supported by the National Center for Advancing Translational Sciences of the National Institutes of Health under award numbers ULl TR000454 to Dr. Colbert and Dr. Fisher and TLlTR000456 to Dr. Colbert and Pancreatic Cancer Action Network (Pan-CAN)&solAmerican Association for Cancer Research (AACR) award 16982, Department of Defense (DOD)/ Peer Reviewed Cancer Research Program (PRCRP) award CA110535, and Georgia Cancer Coalition award 11072, all to Dr. Yu.
Footnotes
Conflict of interest disclosures: the authors made no disclosures.
References
- 1.Siegel R, Naishadham D, Jemal A. Cancer statistics, 2012. CA Cancer J Clin. 2012;62:10–29. doi: 10.3322/caac.20138. [DOI] [PubMed] [Google Scholar]
- 2.Oettle H, Post S, Neuhaus P, et al. Adjuvant chemotherapy with gemcitabine vs observation in patients undergoing curative-intent resection of pancreatic cancer: a randomized controlled trial. JAMA. 2007;297:267–277. doi: 10.1001/jama.297.3.267. [DOI] [PubMed] [Google Scholar]
- 3.Heinemann V, Haas M, Boeck S. Systemic treatment of advanced pancreatic cancer. Cancer Treat Rev. 2012;38:843–853. doi: 10.1016/j.ctrv.2011.12.004. [DOI] [PubMed] [Google Scholar]
- 4.Yeo CJ, Cameron JL, Lillemoe KD, et al. Pancreaticoduodenectomy for cancer of the head of the pancreas. 201 patients Ann Surg. 1995;221:721–731. doi: 10.1097/00000658-199506000-00011. discussion 731-733. [DOI] [PMC free article] [PubMed] [Google Scholar]
- 5.Vanlangenakker N, Vanden Berghe T, Vandenabeele P. Many stimuli pull the necrotic trigger, an overview. Cell Death Differ. 2012;19:75–86. doi: 10.1038/cdd.2011.164. [DOI] [PMC free article] [PubMed] [Google Scholar]
- 6.Tenev T, Bianchi K, Darding M, et al. The Ripoptosome, a signaling platform that assembles in response to genotoxic stress and loss of IAPs. Mol Cell. 2011;43:432–448. doi: 10.1016/j.molcel.2011.06.006. [DOI] [PubMed] [Google Scholar]
- 7.Coupienne I, Fettweis G, Piette J. RIP3 expression induces a death profile change in U2OS osteosarcoma cells after 5-ALA-PDT. Lasers Surg Med. 2011;43:557–564. doi: 10.1002/lsm.21088. [DOI] [PubMed] [Google Scholar]
- 8.Vandenabeele P, Declercq W, Van Herreweghe F, Vanden Berghe T. The role of the kinases RIP1 and RIP3 in TNF-induced necrosis. Sci Signal. 2010;3:re4. doi: 10.1126/scisignal.3115re4. [DOI] [PubMed] [Google Scholar]
- 9.Sun L, Wang H, Wang Z, et al. Mixed lineage kinase domain-like protein mediates necrosis signaling downstream of RIP3 kinase. Cell. 2012;148:213–227. doi: 10.1016/j.cell.2011.11.031. [DOI] [PubMed] [Google Scholar]
- 10.Zhou Z, Han V, Han J. New components of the necroptotic pathway. Protein Cell. 2012;3:811–817. doi: 10.1007/s13238-012-2083-9. [DOI] [PMC free article] [PubMed] [Google Scholar]
- 11.Paulsen RD, Soni DV, Wollman R, et al. A genome-wide siRNA screen reveals diverse cellular processes and pathways that mediate genome stability. Mol Cell. 2009;35:228–239. doi: 10.1016/j.molcel.2009.06.021. [DOI] [PMC free article] [PubMed] [Google Scholar]
- 12.Cotta-Ramusino C, McDonald ER, 3rd, Hurov K, Sowa ME, Harper JW, Elledge SJ. A DNA damage response screen identifies RHINO, a 9-1-1 and TopBP1 interacting protein required for ATR signaling. Science. 2011;332:1313–1317. doi: 10.1126/science.1203430. [DOI] [PMC free article] [PubMed] [Google Scholar]
- 13.Maupin KA, Sinha A, Eugster E, et al. Glycogene expression alterations associated with pancreatic cancer epithelial-mesenchymal transition in complementary model systems. PLoS One. 2010;5:e13002. doi: 10.1371/journal.pone.0013002. [DOI] [PMC free article] [PubMed] [Google Scholar]
- 14.Pei H, Li L, Fridley BL, et al. FKBP51 affects cancer cell response to chemotherapy by negatively regulating Akt. Cancer Cell. 2009;16:259–266. doi: 10.1016/j.ccr.2009.07.016. [DOI] [PMC free article] [PubMed] [Google Scholar]
- 15.Maithel SK, Coban I, Kneuertz PJ, et al. Differential expression of ERCC1 in pancreas adenocarcinoma: high tumor expression is associated with earlier recurrence and shortened survival after resection. Ann Surg Oncol. 2011;18:2699–2705. doi: 10.1245/s10434-011-1610-x. [DOI] [PubMed] [Google Scholar]
- 16.Fisher SB, Patel SH, Bagci P, et al. An analysis of human equilibrative nucleoside transporter-1, ribonucleoside reductase subunit M1, ribonucleoside reductase subunit M2, and excision repair cross-complementing gene-1 expression in patients with resected pancreas adenocarcinoma: implications for adjuvant treatment. Cancer. 2013;119:445–453. doi: 10.1002/cncr.27619. [DOI] [PubMed] [Google Scholar]
- 17.Basturk O, Singh R, Kaygusuz E, et al. GLUT-1 expression in pancreatic neoplasia: implications in pathogenesis, diagnosis, and prognosis. Pancreas. 2011;40:187–192. doi: 10.1097/MPA.0b013e318201c935. [DOI] [PMC free article] [PubMed] [Google Scholar]
- 18.Liu X, Lai L, Wang X, et al. Ribonucleotide reductase small subunit M2B prognoses better survival in colorectal cancer. Cancer Res. 2011;71:3202–3213. doi: 10.1158/0008-5472.CAN-11-0054. [DOI] [PMC free article] [PubMed] [Google Scholar]
- 19.Jamieson NB, Carter CR, McKay CJ, Oien KA. Tissue biomarkers for prognosis in pancreatic ductal adenocarcinoma: a systematic review and meta-analysis. Clin Cancer Res. 2011;17:3316–3331. doi: 10.1158/1078-0432.CCR-10-3284. [DOI] [PubMed] [Google Scholar]
- 20.Ansari D, Rosendahl A, Elebro J, Andersson R. Systematic review of immunohistochemical biomarkers to identify prognostic subgroups of patients with pancreatic cancer. Br J Surg. 2011;98:1041–1055. doi: 10.1002/bjs.7574. [DOI] [PubMed] [Google Scholar]
- 21.Farrell JJ, Elsaleh H, Garcia M, et al. Human equilibrative nucleoside transporter 1 levels predict response to gemcitabine in patients with pancreatic cancer. Gastroenterology. 2009;136:187–195. doi: 10.1053/j.gastro.2008.09.067. [DOI] [PubMed] [Google Scholar]
- 22.Duxbury MS, Ito H, Zinner MJ, Ashley SW, Whang EE. RNA interference targeting the M2 subunit of ribonucleotide reductase enhances pancreatic adenocarcinoma chemosensitivity to gemcitabine. Oncogene. 2004;23:1539–1548. doi: 10.1038/sj.onc.1207272. [DOI] [PubMed] [Google Scholar]
- 23.Metzger R, Bollschweiler E, Holscher AH, Warnecke-Eberz U. ERCC1: impact in multimodality treatment of upper gastrointestinal cancer. Future Oncol. 2010;6:1735–1749. doi: 10.2217/fon.10.140. [DOI] [PubMed] [Google Scholar]
- 24.Denlinger CS, Cohen SJ. Progress in the development of prognostic and predictive markers for gastrointestinal malignancies. Curr Treat Options Oncol. 2007;8:339–351. doi: 10.1007/s11864-007-0045-x. [DOI] [PubMed] [Google Scholar]
- 25.Xu X, Wang Y, Chen J, et al. High expression of CX3CL1/CX3CR1 axis predicts a poor prognosis of pancreatic ductal adenocarcinoma. J Gastrointest Surg. 2012;16:1493–1498. doi: 10.1007/s11605-012-1921-7. [DOI] [PubMed] [Google Scholar]
- 26.Iacobuzio-Donahue CA, Fu B, Yachida S, et al. DPC4 gene status of the primary carcinoma correlates with patterns of failure in patients with pancreatic cancer. J Clin Oncol. 2009;27:1806–1813. doi: 10.1200/JCO.2008.17.7188. [DOI] [PMC free article] [PubMed] [Google Scholar]
- 27.Bachet JB, Marechal R, Demetter P, et al. Contribution of CXCR4 and SMAD4 in predicting disease progression pattern and benefit from adjuvant chemotherapy in resected pancreatic adenocarcinoma. Ann Oncol. 2012;23:2327–2335. doi: 10.1093/annonc/mdr617. [DOI] [PubMed] [Google Scholar]
- 28.Asano T, Yao Y, Zhu J, Li D, Abbruzzese JL, Reddy SA. The PI 3-kinase/Akt signaling pathway is activated due to aberrant Pten expression and targets transcription factors NF-kappaB and c-Myc in pancreatic cancer cells. Oncogene. 2004;23:8571–8580. doi: 10.1038/sj.onc.1207902. [DOI] [PubMed] [Google Scholar]


