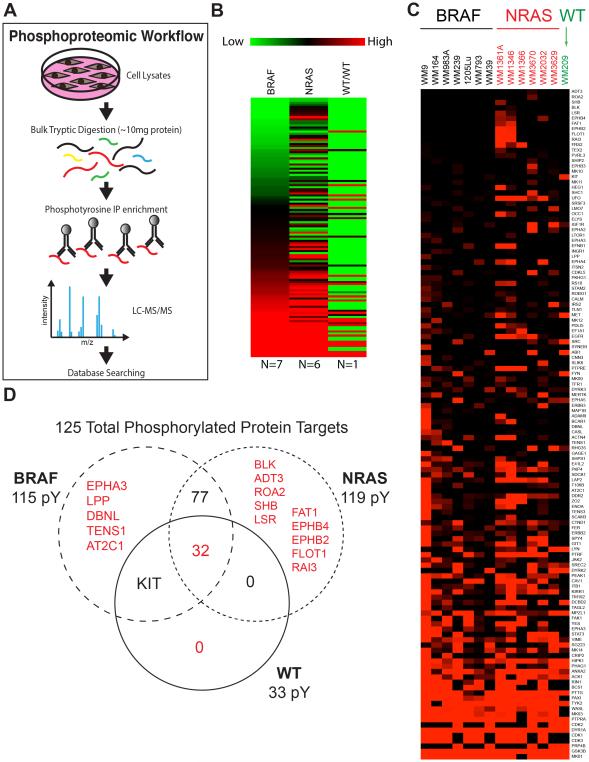
Figure 1. Phosphoproteomic analysis of melanoma cell lines based on genotype.
A: Workflow of the phosphoproteomic experiment. B: Heat map showing average pY intensities summarized for three melanoma cell line genotypes. Seven BRAF-mutant melanoma cell lines include WM9, WM164, WM983A, WM239, 1205Lu, WM793, and WM39. Six NRAS-mutant melanoma cell lines include WM1361A, WM1346, WM1366, WM3670, WM2032, and WM3629. One cell line, WM209, with wild type NRAS and BRAF was analyzed. C: Heat map showing average pY intensities for each cell line. D: Venn diagram depicts the breakdown of the number of phosphorylated proteins that are unique to each genotype and common among genotypes.

