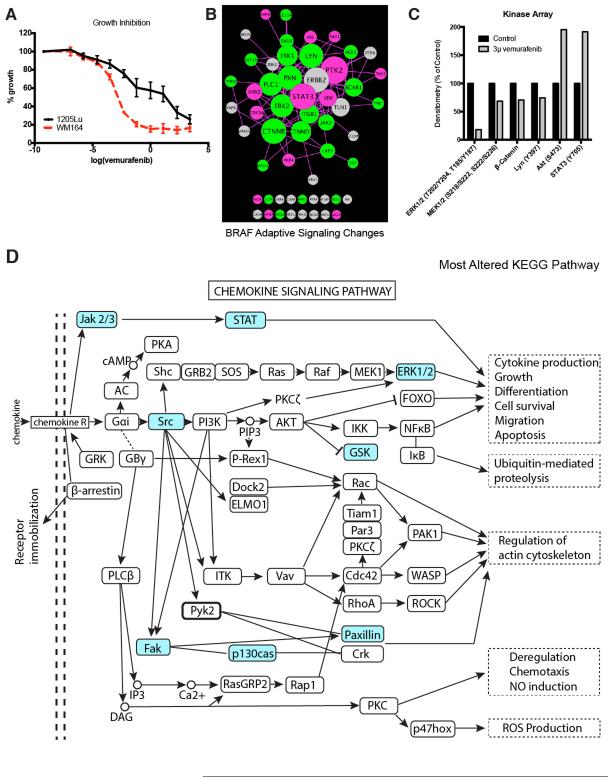
Figure 4. Adaptive signaling in BRAF-mutant melanoma cell line.
A: Treatment of WM164 (sensitive) and 1205Lu (partly resistant) BRAF-mutant melanoma cell lines with vemurafenib leads to the inhibition of growth. Cells were treated with drug for 72 hours before being analyzed using the MTT assay. B: The 1205Lu BRAFV600E melanoma cell line was treated with 3μM vemurafenib for 24 hours, then analyzed by phosphoproteomics and compared against the basal signaling in the same cells. The signaling network was visualized using Cytoscape based on degree of connectivity (node size), and average fold change in pY intensity (node color, brighter = higher intensity values). Fold changes less than 0.8 are denoted in green (pY more prominent in basal), and fold changes greater than 1.2 are denoted in pink (pY more prominent in treated cells). C: Validation of the MS data from (B) using a kinome array. 1205Lu cells were treated with 3μM vemurafenib for 24 hrs. before phosphorylation levels of ERK, MEK, β-catenin, Ly, AKT and STAT3 were quantified using the kinome array. D: Kyoto Encyclopedia of Genes and Genomes (KEGG) pathway analysis on proteins characterized as greatly altered identified chemokine signaling pathway to be most affected by vemurafenib treatment. Proteins identified to have a change in pY that are 0.8-fold and less, or those that are 1.2-fold or higher were categorized as altered (highlighted in blue).

