Abstract
The perceptual effects of electrode spanning (i.e., the use of nonadjacent return electrodes) in partial tripolar (pTP) mode were tested on a main electrode EL8 in five cochlear implant (CI) users. Current focusing was controlled by σ (the ratio of current returned within the cochlea), and current steering was controlled by α (the ratio of current returned to the basal electrode). Experiment 1 tested whether asymmetric spanning with α = 0.5 can create additional channels around standard pTP stimuli. It was found that in general, apical spanning (i.e., returning current to EL6 rather than EL7) elicited a pitch between those of standard pTP stimuli on main electrodes EL8 and EL9, while basal spanning (i.e., returning current to EL10 rather than EL9) elicited a pitch between those of standard pTP stimuli on main electrodes EL7 and EL8. The pitch increase caused by apical spanning was more salient than the pitch decrease caused by basal spanning. To replace the standard pTP channel on the main electrode EL8 when EL7 or EL9 is defective, experiment 2 tested asymmetrically spanned pTP stimuli with various α, and experiment 3 tested symmetrically spanned pTP stimuli with various σ. The results showed that pitch increased with decreasing α in asymmetric spanning, or with increasing σ in symmetric spanning. Apical spanning with α around 0.69 and basal spanning with α around 0.38 may both elicit a similar pitch as the standard pTP stimulus. With the same σ, the symmetrically spanned pTP stimulus was higher in pitch than the standard pTP stimulus. A smaller σ was thus required for symmetric spanning to match the pitch of the standard pTP stimulus. In summary, electrode spanning is an effective field-shaping technique that is useful for adding spectral channels and handling defective electrodes with CIs.
Keywords: cochlear implants, electrode spanning, current steering, current focusing, tripolar mode
INTRODUCTION
Current cochlear implants (CIs) use 12–22 electrodes implanted in a patient’s cochlea to encode speech information. However, CI users have been shown to receive only 4–8 channels of spectral information (e.g., Fishman et al. 1997; Friesen et al. 2001). This is likely because the commonly used monopolar (MP) stimulation delivers current from an intracochlear electrode to an extracochlear ground and has a large spread of excitation with the long current pathway, leading to strong neural interactions between channels. The limited spectral resolution with CIs may be enough for the recognition of simple sentences in quiet, but not for more complex materials or in noisy environments (Shannon et al. 2004).
One way to improve spectral resolution with CIs is to make electric stimulation more focused by using bipolar (BP) or tripolar (TP) mode. The idea is to reduce the spread of excitation by returning current fully to an intracochlear adjacent electrode (either apical or basal to the main electrode) in BP mode, or equally in halves to both adjacent electrodes in TP mode. Psychophysical studies (e.g., Kwon and van den Honert 2006) found that BP mode does not necessarily have narrower excitation patterns than MP mode. Although TP stimulation has been shown to have higher spatial selectivity and less channel interaction than BP or MP stimulation (e.g., Kral et al. 1998; Bierer and Middlebrooks 2004; Snyder et al. 2004; Bierer 2007), it may not always reach adequate loudness levels within the compliance limits of CIs due to higher current requirements.
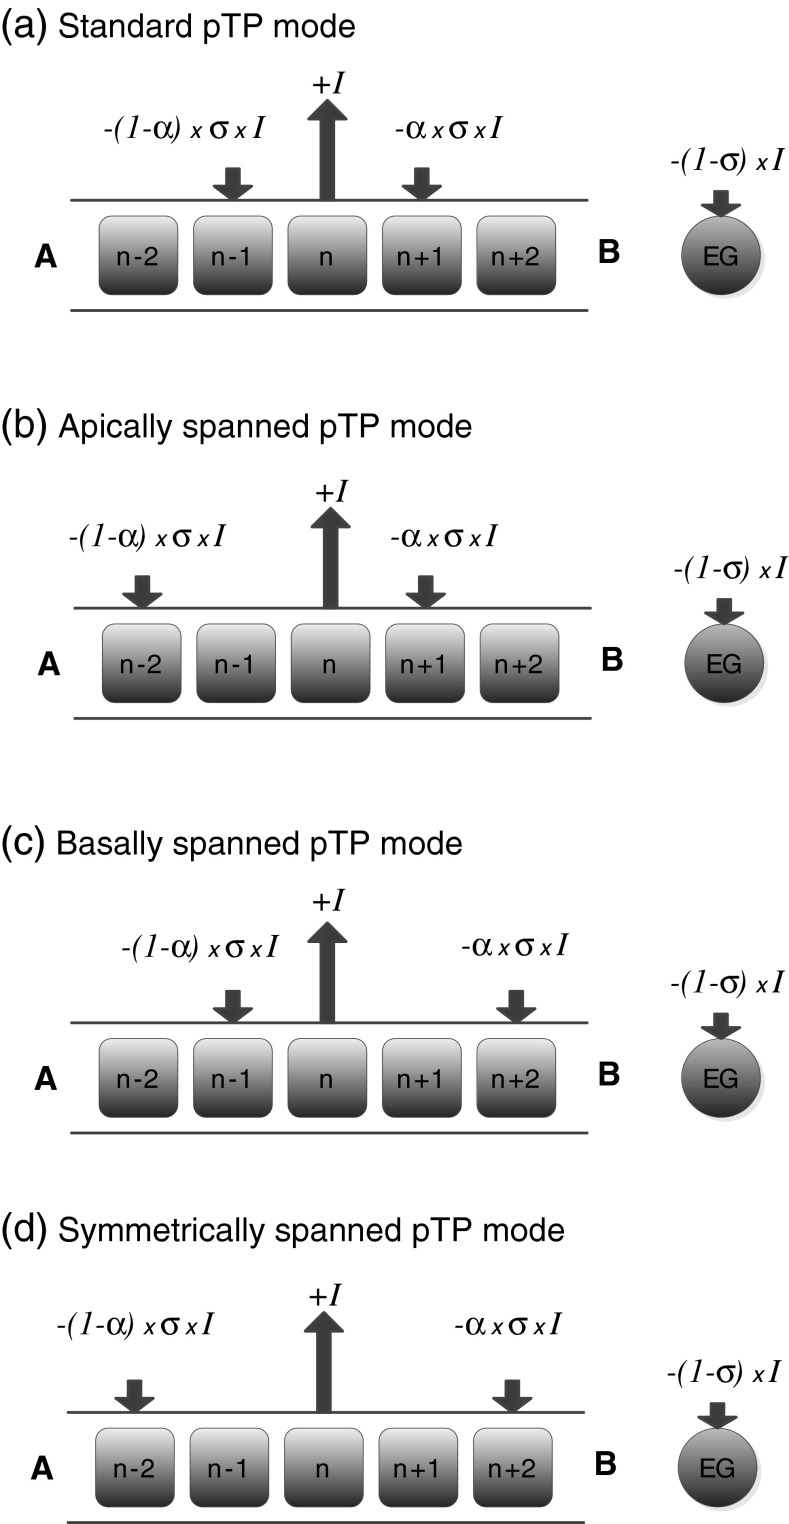
Partial tripolar (pTP) mode (Fig. 1a with α = 0.5) was thus proposed to provide a trade-off between current focusing and loudness growth. It returns only a fraction (σ) of current to the intracochlear adjacent electrodes, and the rest (1-σ) to the extracochlear ground. The compensation coefficient σ can be varied from 0 (MP mode) to 1 (TP mode) to regulate the spread of excitation. At equal loudness, only pTP mode with σ > 0.5 might have narrower spread of excitation than MP mode in some CI users (Landsberger et al. 2012). A pTP strategy with σ fixed at 0.75 did significantly improve speech recognition in noise over a MP strategy that was matched in parameters such as the number of main electrodes and the rate of stimulation (Srinivasan et al. 2013). On average, there was no significant difference in performance with the pTP strategy and with subjects’ clinical strategies. Note that the clinical strategies may have had some advantages over the pTP strategy, because CI users experienced the pTP strategy only acutely. To reach the most comfortable level, the pTP strategy had to use a much longer pulse width than clinical strategies, leading to a much lower stimulation rate and possibly degraded temporal resolution. In addition, the most apical and basal electrodes could not be used as the main electrodes in pTP mode, because they do not have either an apical or a basal adjacent electrode for current return. Additional spectral channels are needed for the pTP strategy to compensate for the loss of the most apical and basal channels so that CI performance can be further improved.
FIG. 1.
Schematic illustration of various partial tripolar (pTP) stimulation modes with a fixed current level I on the main electrode ELn. A fraction of the current (σ × I) is split and returned to two intracochlear electrodes with varying ratios (α and 1-α for the basal and apical return electrodes, respectively), while the rest [(1-σ) × I] to the extracochlear ground (EG). The arrowhead direction indicates the phases of biphasic current pulses (upward: cathodic-leading; downward: anodic-leading), while the arrow length indicates the current level. A and B stand for apex and base, respectively. Note that α is fixed at 0.5 for the named pTP modes in Fig. 1. When current steering is used, α can vary between 0 and 1.
To increase the number of spectral channels with focused excitation patterns, Wu and Luo (2013) proposed to incorporate current steering into pTP mode (Fig. 1a) by varying the proportions of current returned to the basal and apical adjacent electrodes (α and 1-α, respectively). Subjects generally perceived a lowering of pitch as the steering coefficient α increased from 0 to 1, which was consistent with the apical shifts of centroid of neural excitation pattern in a computational model (Goldwyn et al. 2010). However, the pitch-ranking results of pTP-mode current steering varied across subjects, with one out of six subjects exhibiting pitch reversals. Similar pitch reversals were also seen in phantom electrode or partial BP (pBP) stimuli with an increasing amount of current returned to the basal adjacent electrode alone (Saoji and Litvak 2010). For those who are less sensitive to the pitch changes caused by the different distributions of return current, alternative ways to create additional spectral channels in pTP mode may be necessary.
This study tested if moving the apical or basal return electrode away from the main electrode in pTP mode (i.e., apical or basal electrode spanning; Fig. 1b, c, respectively, with α = 0.5) may also elicit distinctive pitch percepts and create additional spectral channels. The asymmetrically spanned pTP stimuli can be viewed as quadrupolar virtual channel (QPVC) stimuli (Landsberger and Srinivasan 2009) with only a single activated main electrode. QPVCs generally stimulate four adjacent electrodes at the same time, using two middle electrodes as the main electrodes for current steering and two outer electrodes as the return electrodes for current focusing. QPVCs have been shown to reduce current spread and improve pitch discrimination in either a single- or multichannel context than MP virtual channels (Landsberger and Srinivasan 2009; Srinivasan et al. 2010, 2012). The increased number of discriminable pitches with QPVCs may be partially due to a larger steering range caused by the asymmetric current distribution when either main electrode is activated alone. This possibility was tested in this study by comparing the pitches of standard and asymmetrically spanned pTP stimuli on the same main electrode. Basal electrode spanning has been used in the technique of phantom electrode, which stimulates the most apical electrode in pBP mode. When a fraction of current was returned to the adjacent basal electrode, the neural excitation pattern was pushed apically (Saoji et al. 2013), resulting in a pitch lower than that of MP stimulation (Saoji and Litvak 2010). In addition, pitch generally decreased as the spatial separation between the main and basal return electrodes increased up to 2–3 mm or there were 1–2 intermediate electrodes. Compared to the adjacent basal return electrode, the nonadjacent (or spanned) basal return electrode may have further reduced the spread of excitation towards the basal end and pushed the neural excitation pattern more apically. Based on these results, basal electrode spanning in pTP mode was expected to elicit lower pitch percepts, while apical electrode spanning may elicit higher pitch percepts. Experiment 1 tested these hypotheses using both the computational model of Goldwyn et al. (2010) and human CI users.
From another perspective, electrode spanning may be inevitable when realizing a pTP strategy in CI users with a defective electrode. According to Hughes et al. (2004), 10–15 % of CI users have at least one defective electrode. Note that when one electrode (e.g., EL9) is defective, three (rather than one) pTP channels are not available, including one using the defective electrode as the main electrode (e.g., pTP(8,9,10)) and two using the defective electrode as the apical or basal return electrode (e.g., pTP(7,8,9) and pTP(9,10,11)). The pTP channel with a defective main electrode may be replaced using quadrupolar-mode current steering (Landsberger and Srinivasan 2009) between two nonadjacent main electrodes on both sides of the defective electrode. It is possible to generate the same pitch percept as the intermediate defective electrode when current is evenly distributed in phase to the two nonadjacent main electrodes. Similar electrode spanning has been successfully used in MP-mode current steering to recover missing MP channels (Snel-Bongers et al. 2011) and restore speech performance with the HiRes-120 processing strategy (Frijns et al. 2013).
This study focused on alternate ways to replace the pTP channel with a defective return electrode. As hypothesized earlier, simply spanning the defective return electrode may vary the perceived pitch. The current steering technique in Wu and Luo (2013) may be applied to the apically or basally spanned pTP channel (Fig. 1b and c with various α) to approximate the pitch of the missing standard pTP channel, or to create a more discriminable channel from the neighboring available standard pTP channels. Another way to replace the pTP channel with a defective return electrode is to move both return electrodes away from the main electrode. The symmetric electrode spanning (Fig. 1d with α = 0.5) may change the width but not the centroid of the neural excitation pattern. The compensation coefficient σ may thus need to be adjusted for the symmetrically spanned pTP channel to approximate the pitch of the missing standard pTP channel. Experiments 2 and 3 tested these two methods separately, using both the model of Goldwyn et al. (2010) and human CI users.
EXPERIMENT 1: ASYMMETRIC ELECTRODE SPANNING
For brevity, pTP(ELa, ELn, ELb), α = α1 denotes a general form of pTP stimulation on the main electrode ELn with the apical return electrode ELa, the basal return electrode ELb, and the steering coefficient α = α1. For example, a standard pTP stimulus on the main electrode EL8 would be denoted by pTP(7,8,9), α = 0.5. The compensation coefficient σ, not shown in this form, was customized for each subject to be the highest value that allowed for full loudness growth within the compliance limits of CIs (see below for details).
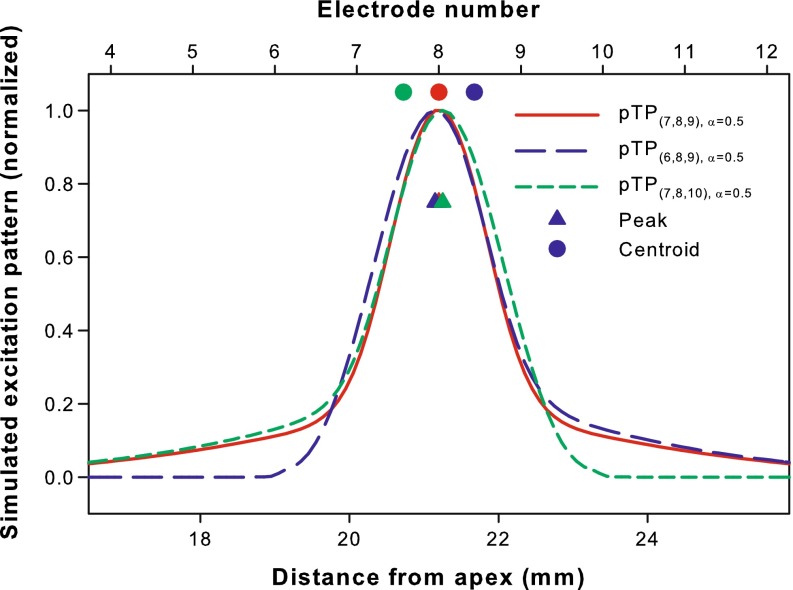
Saoji et al. (2013) have shown that for phantom electrode stimuli, the centroid of forward-masking pattern shifted in directions consistent with the pitch changes. Similarly, a computational model (Goldwyn et al. 2010) has been successfully used in Wu and Luo (2013) to predict the relative pitch changes of pTP-mode current steering based on the shifts of centroid (rather than peak) of simulated neural excitation pattern (i.e., the number of activated neurons as a function of cochlear position). In this study, the model with the same parameters (e.g., full neural survival and a fixed electrode-neuron distance of 1.3 mm) and assumptions (e.g., a total of 1,000 activated neurons corresponds to equal loudness at most comfortable level or MCL) was used to simulate the neural excitation patterns. Figure 2 shows the normalized neural excitation patterns for the standard, apically spanned, and basally spanned pTP stimuli (i.e., pTP(7,8,9), α = 0.5, pTP(6,8,9), α = 0.5, and pTP(7,8,10), α = 0.5, respectively). Although their excitation peaks (triangles) all remained near the main electrode EL8, the excitation centroids (circles) of asymmetrically spanned pTP stimuli shifted away from EL8. As shown in Figure 2, pTP(6,8,9), α = 0.5 (blue curve) had similar spread of excitation as pTP(7,8,9), α = 0.5 (red curve) on the basal side of EL8, but less excitation around the nonadjacent return electrode EL6. As such, the excitation centroid of pTP(6,8,9), α = 0.5 (blue circle) shifted towards the base by 0.41 mm and was located between EL8 and EL9. The pitch of pTP(6,8,9), α = 0.5 was thus predicted to be between those of standard pTP stimuli on main electrodes EL8 and EL9. The model also predicted that the excitation centroid of pTP(7,8,10), α = 0.5 (green circle) would shift towards the apex by the same amount and elicit a pitch between those of standard pTP stimuli on main electrodes EL7 and EL8. However, the model had inherently simplified assumptions and uncertainties in results. For example, it did not consider the different sensitivity of auditory neurons to cathodic- and anodic-leading pulses on the main and return electrodes, respectively (e.g., Macherey et al. 2008). Also, the uniform electrode-neuron distance, neural survival, and impedance along the cochlea, as well as the fixed compensation coefficient σ (0.75) may have had great quantifiable effects on the side lobes and centroid shifts of simulated excitation patterns.
FIG. 2.
Simulated neural excitation patterns for pTP(7,8,9), α = 0.5 (red curve), pTP(6,8,9), α = 0.5 (blue curve), and pTP(7,8,10), α = 0.5 (green curve). The number of activated neurons is normalized and shown as a function of the distance from the apex of cochlea (bottom abscissa) or electrode number (top abscissa). For each pTP mode, the centroid (circle) and peak (triangle) of excitation are shown in the corresponding color. The compensation coefficient σ is fixed at 0.75 for all the simulations.
To study the effects of asymmetric electrode spanning on pitch perception in CI users, apically or basally spanned pTP stimuli on the main electrode EL8 were compared in pitch to standard pTP stimuli on main electrodes from EL6 to EL10. As a prerequisite, pitch ranking of standard pTP stimuli on main electrodes from EL6 to EL10 was first tested to make sure that distinctive pitches in tonotopic order were elicited by standard pTP stimuli on these main electrodes. Results of electrode ranking in standard pTP mode may also indicate the place-pitch sensitivity of individual CI subjects.
Methods
Subjects
Five postlingually deafened female adult CI users participated in this study. One subject (S3) had bilateral implants and was tested in each ear separately. Table 1 shows CI subject demographics. All subjects used the Advanced Bionics HiRes 90K implant, which can stimulate multiple electrodes simultaneously to deliver various types of pTP stimuli. The HiFocus1J electrode array with an electrode spacing of 1.1 mm was used by all subjects. This study was reviewed and approved by the Purdue IRB committee. All subjects provided informed consent and were compensated for their time.
TABLE 1.
Subject demographics
| Subject | Age (years) | Etiology | Processing strategy | Years with prosthesis | HINT scoresa (%) |
|---|---|---|---|---|---|
| S1 | 84 | Sudden hearing loss | HiRes-P Fidelity 120 | 4 | 96 |
| S2 | 42 | Meningitis | HiRes-P Fidelity 120 | 8 | 94 |
| S3L | 64 | Hereditary deafness | HiRes-P | 2 | N/A |
| S3R | 64 | Hereditary deafness | HiRes-P | 7 | 94 |
| S4 | 70 | NF2 tumor | HiRes-S Fidelity 120 | 4 | 7 |
| S5 | 63 | Unknown | HiRes-S Fidelity 120 | 4 | 91 |
aThe Hearing in Noise Test (HINT) sentences were tested in quiet at 60 dB SPL
Pitch Ranking of Standard pTP Stimuli
Each main electrode from EL6 to EL10 was stimulated with 300 ms, 1,000-Hz pulse trains in standard pTP mode. The symmetric biphasic pulses were cathodic-leading on the main electrode and anodic-leading on the return electrodes. A phase duration (226 μs) longer than those in clinical strategies was used so that the experimental pTP stimuli can reach the upper loudness limit within the compliance limits of CIs (i.e., the voltage on each electrode should be lower than 8 V and the surface charge density should be lower than 100 μC/cm2; Saoji and Litvak 2010). The Bionic Ear Data Collection System (BEDCS; Advanced Bionics, Sylmar, CA) was used to bypass the clinical processors and directly present the experimental stimuli.
For the standard pTP stimulus on each main electrode, the highest compensation coefficient σmax that allowed for full loudness growth within the compliance limits was first found using a binary search algorithm (Wu and Luo 2013). For each subject, the smallest σmax among different main electrodes was selected and used for all the standard pTP stimuli in this experiment. This σ value kept a similar degree of current focusing while allowing for full loudness growth on all the main electrodes from EL6 to EL10.
The most comfortable level (MCL) for the standard pTP stimulus on the main electrode EL8 (i.e., pTP(7,8,9), α = 0.5) was determined during the search of σmax and was then used as the reference for loudness balance. The target standard pTP stimulus on the main electrode EL6, EL7, EL9, or EL10 was matched in loudness to the reference using a two-alternative, forced-choice (2AFC), double-staircase adaptive procedure (Jesteadt 1980). Details of the loudness balance procedure can also be found in Wu and Luo (2013).
After loudness balancing, the pitches of standard pTP stimuli on two adjacent main electrodes (e.g., pTP(5,6,7), α = 0.5 vs. pTP(6,7,8), α = 0.5) were compared in a 2AFC task. In each trial, a pair of adjacent main electrodes was randomly chosen and the standard pTP stimuli on the two main electrodes were presented also in random order. Subjects were allowed to repeat the stimulus pair before indicating which stimulus had a higher pitch. There were four pairs of adjacent main electrodes and each pair was presented 10 times, resulting in a total of 40 trials in each run. The percentages that the stimulus on the higher numbered main electrode was judged as higher in pitch were recorded. If the results of two runs differed by more than 30 % for any stimulus pair, an additional run was tested. The final pitch-ranking results were averaged across all runs.
Pitch Ranking Between Asymmetrically Spanned and Standard pTP Stimuli
With the same stimulation parameters (e.g., the pulse rate, phase duration and, compensation coefficient σ, etc.), the apically spanned pTP(6,8,9), α = 0.5 and basally spanned pTP(7,8,10), α = 0.5 were loudness balanced to the standard pTP(7,8,9), α = 0.5 at MCL. The apically or basally spanned pTP stimulus was then separately compared to the five equally loud standard pTP stimuli on main electrodes from EL6 to EL10 in a 2AFC pitch-ranking task. In each trial, the apically or basally spanned pTP stimulus and a randomly selected standard pTP stimulus were presented in random order. Each standard pTP stimulus was tested 10 times, resulting in a total of 50 trials in a run. The percentages that the standard pTP stimuli were judged as higher in pitch than the spanned pTP stimulus were recorded. If the results of two runs differed by more than 30 % for any stimulus pair, an additional run was tested. The final pitch-ranking results were averaged across all runs.
Results
Pitch Ranking of Standard pTP Stimuli
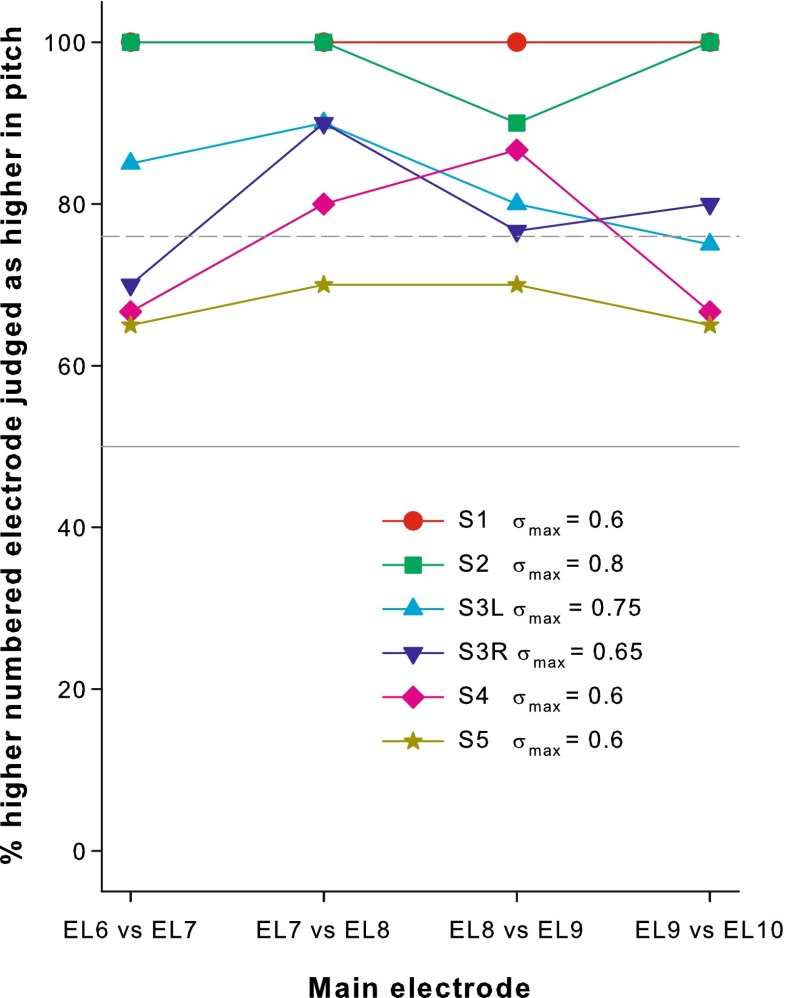
Figure 3 shows the percentages that standard pTP stimuli on the main electrode ELn were judged as higher in pitch than those on ELn-1, where n = 7, 8, 9, and 10. The σmax value used for each subject is indicated in the figure legend. The initially found σmax for S5 was actually 0.8. However, with such a large σ value, pitch reversals occurred for S5 between pairs of adjacent main electrodes (EL6 vs. EL7 and EL9 vs. EL10), possibly due to perceptually salient side lobes (Saoji and Litvak 2010). Less focused stimuli with a smaller σ value 0.6 were thus tested for S5 to avoid pitch reversals.
FIG. 3.
Pitch-ranking results for main electrodes from EL6 to EL10 in standard pTP mode. The percentages that the higher-numbered main electrode was judged as higher in pitch are shown as a function of the adjacent stimulus pair. The gray solid line indicates the 50 % chance level; dashed line indicates the 76 % threshold level (with d’ = 1). The applied compensation coefficient σ max is included for each subject.
All the data points in Figure 3 were well above the 50 % chance level (gray solid line). In fact, most of the data points (except some from S4 and all from S5) were above the 76 % perceptual threshold (defined by d’ = 1; gray dashed line). This suggests that with the customized σmax values, standard pTP stimuli on main electrodes from EL6 to EL10 elicited distinctive pitches as in the expected tonotopic order. A one-way repeated-measures (RM) analysis of variance (ANOVA) did not reveal any significant difference in the pitch-ranking results across electrode pairs (F3,15 = 2.00, p = 0.16). In other words, different pairs of adjacent main electrodes were similarly discriminable. However, pitch ranking of adjacent main electrodes in standard pTP mode was variable across subjects, with the best performance in S1 and S2, and the worst performance in S5. For all subjects except S1, the average pitch-ranking performance across electrode pairs was significantly correlated with the used σmax value (r = 0.92, p = 0.029). In contrast, S1 used the smallest σmax value but had the best pitch-ranking performance among subjects.
Pitch Ranking Between Asymmetrically Spanned and Standard pTP Stimuli
The current levels required to reach equal loudness did not significantly differ for the standard (i.e., pTP(7,8,9), α = 0.5), apically spanned (i.e., pTP(6,8,9), α = 0.5), or basally spanned (i.e., pTP(7,8,10), α = 0.5) pTP stimuli (one-way RM ANOVA F2,10 = 3.18, p = 0.09), although the statistical power (0.34) was low due to the limited number of subjects. pTP(7,8,9), α = 0.5 and pTP(7,8,10), α = 0.5 tended to need more current than pTP(6,8,9), α = 0.5 for equal loudness.
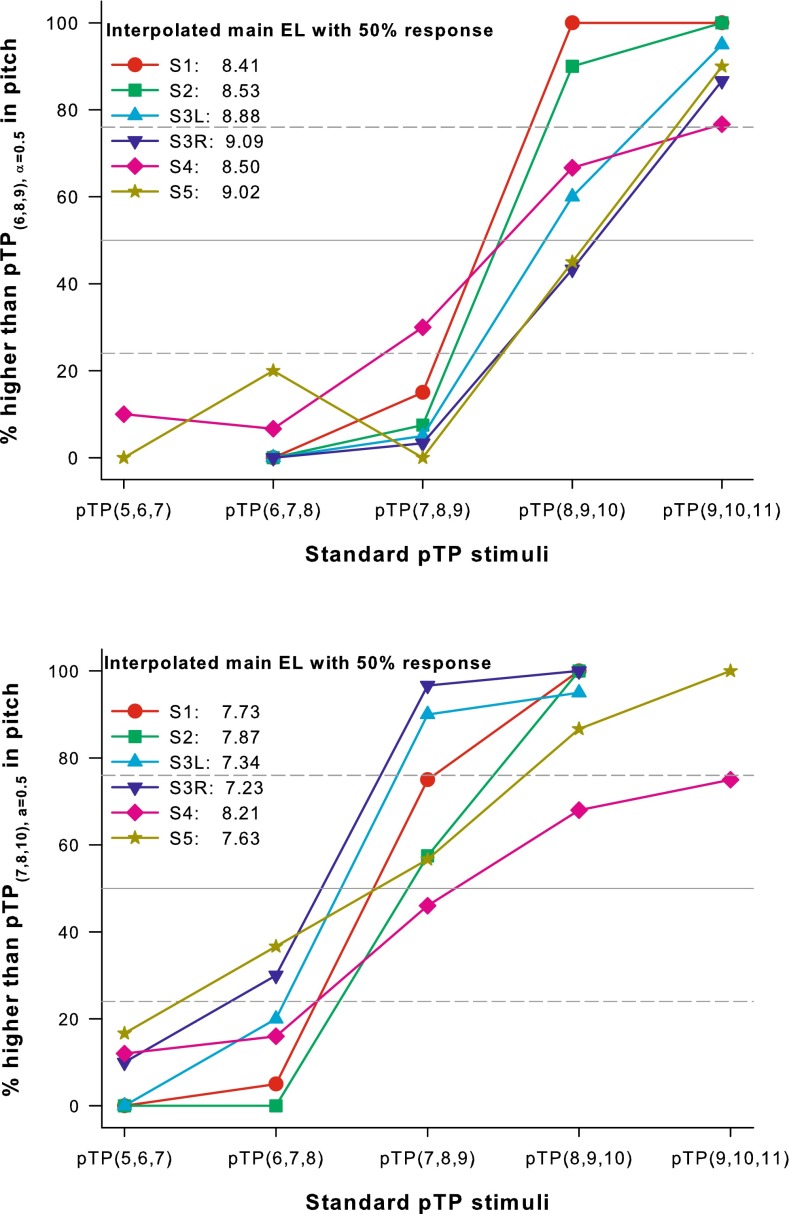
Figure 4 shows the percentages that standard pTP stimuli on main electrodes from EL6 to EL10 were judged as higher in pitch than the apically spanned pTP(6,8,9), α = 0.5 (top panel) or the basally spanned pTP(7,8,10),α = 0.5 (bottom panel). Most of the psychometric functions monotonically increased with the main electrode number of standard pTP stimuli, in line with the tonotopic order in pitch. Each psychometric function was fitted with a three-parameter sigmoid function:
| 1 |
to find the standard pTP stimulus with a virtual main electrode that may be pitch matched to the apically or basally spanned pTP stimulus (or with 50 % responses). If the sigmoid function did not provide a good fit, data points of adjacent main electrodes were linearly interpolated to find the virtual main electrode with 50 % responses. Figure 4 also shows the interpolated virtual main electrode that may elicit a similar pitch as the apically or basally spanned pTP stimulus for each subject.
FIG. 4.
Percentages that standard pTP stimuli on main electrodes from EL6 to EL10 were judged as higher in pitch than pTP(6,8,9), α = 0.5 (top panel) or pTP(7,8,10), α = 0.5 (bottom panel). The gray solid lines indicate the 50 % chance level; dashed lines indicate the 76 and 24 % threshold levels (with d’ = ±1). The interpolated virtual main electrodes with 50 % responses are shown for each subject.
The virtual main electrodes with 50 % responses suggest that the perceived pitch of pTP(6,8,9), α = 0.5 fell between those of pTP(7,8,9), α = 0.5 and pTP(8,9,10), α = 0.5 for most cases, but was slightly higher than that of pTP(8,9,10), α = 0.5 for S3R and S5. On the other hand, the perceived pitch of pTP(7,8,10), α = 0.5 fell between those of pTP(6,7,8), α = 0.5 and pTP(7,8,9), α = 0.5 for all subjects except S4 who perceived pTP(7,8,10), α = 0.5 as slightly higher in pitch than pTP(7,8,9), α = 0.5. The dashed lines in Figure 4 indicate 76 and 24 % responses, respectively (i.e., d’ = ±1), which were used as the threshold to determine if the spanned and standard pTP stimuli were discriminable. For S1 and S2, pTP(6,8,9), α = 0.5 created an intermediate pitch or spectral channel discriminable from those of both pTP(7,8,9), α = 0.5 and pTP(8,9,10), α = 0.5. S4 could not discriminate the pitch of pTP(6,8,9), α = 0.5 from either that of pTP(7,8,9), α = 0.5 or that of pTP(8,9,10), α = 0.5. For the other subjects, the perceived pitch of pTP(6,8,9), α = 0.5 was discriminable from that of pTP(7,8,9), α = 0.5, but not from that of pTP(8,9,10), α = 0.5. Also, pTP(7,8,10), α = 0.5 created an intermediate pitch or spectral channel discriminable from those of both pTP(6,7,8), α = 0.5 and pTP(7,8,9), α = 0.5 for S1 and S3L, but not for the other subjects.
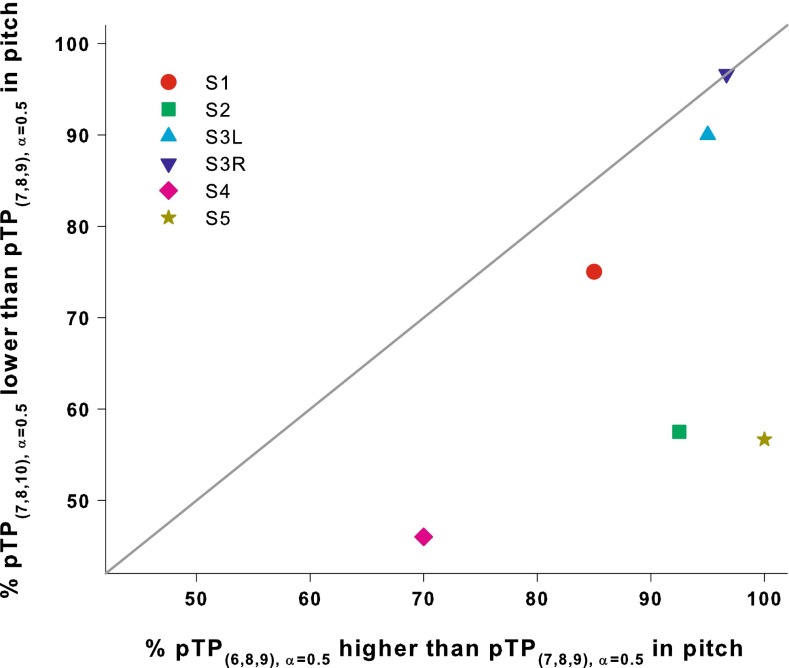
Compared to the standard pTP(7,8,9), α = 0.5, apically spanned pTP(6,8,9), α = 0.5 elicited a higher pitch, while basally spanned pTP(7,8,10), α = 0.5 elicited a lower pitch. Using pTP(7,8,9), α = 0.5 as the common reference, the degree of pitch shift caused by apical or basal spanning can be quantified and compared. Figure 5 shows the percentage that pTP(7,8,10), α = 0.5 was judged as lower in pitch than pTP(7,8,9), α = 0.5, compared to the percentage that pTP(6,8,9), α = 0.5 was judged as higher in pitch than pTP(7,8,9), α = 0.5. An equal amount of pitch shift for apical and basal spanning is indicated by the diagonal line. All data points lie below the diagonal line, suggesting that pTP(6,8,9), α = 0.5 elicited more salient pitch changes than pTP(7,8,10), α = 0.5. A paired t-test showed that the difference in the response percentages was significant between pTP(6,8,9), α = 0.5 and pTP(7,8,10), α = 0.5 (t5 = 2.76, p = 0.04). Note that pitch ranking of standard pTP stimuli was not better between pTP(7,8,9), α = 0.5 and pTP(8,9,10), α = 0.5 (which surrounded pTP(6,8,9), α = 0.5 in pitch) than between pTP(6,7,8), α = 0.5 and pTP(7,8,9), α = 0.5 (which surrounded pTP(7,8,10), α = 0.5 in pitch) (paired t-test: t5 = 1.40, p = 0.22). Although the same amount of centroid shift in the opposite direction was predicted for apical or basal spanning in the simplified model, pTP(7,8,10), α = 0.5 may not be as effective as pTP(6,8,9), α = 0.5 in shifting the centroid of neural excitation in a real cochlea. Previous CI studies (e.g., Jolly et al. 1996; Vanpoucke et al. 2004; Tang et al. 2011; Saoji et al. 2013) have shown that current was prone to flow from the apex to the base of a cochlea, possibly because the current pathway towards the base has a lower impedance. For pTP(7,8,10), α = 0.5, the favored current flow to the base may make less reduction of basal current spread and a smaller apical shift of excitation centroid.
FIG. 5.
Pitch-ranking results of pTP(7,8,10), α = 0.5 vs. pTP(7,8,9), α = 0.5 compared to the pitch-ranking results of pTP(6,8,9), α = 0.5 vs. pTP(7,8,9), α = 0.5. The diagonal line indicates equal response percentages.
EXPERIMENT 2: ASYMMETRIC ELECTRODE SPANNING WITH CURRENT STEERING
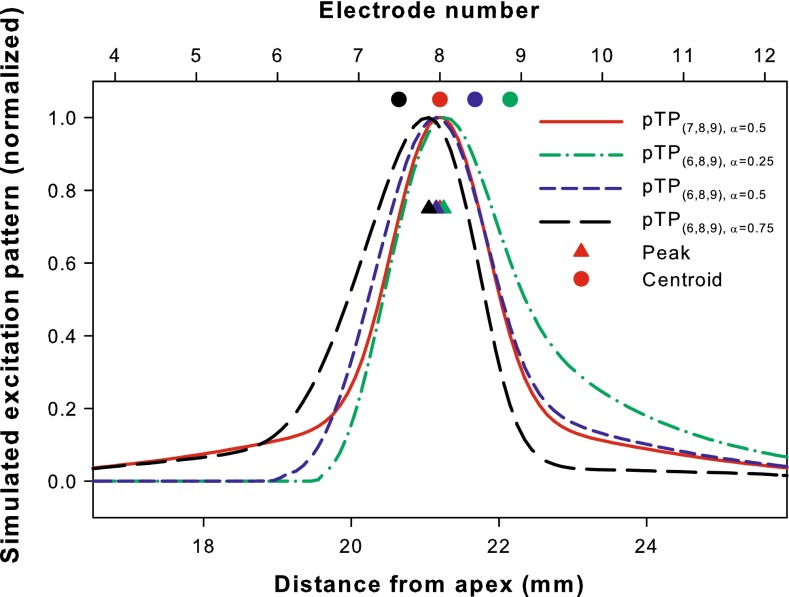
This experiment tested whether combining asymmetric electrode spanning with current steering can replace a standard pTP channel (e.g., pTP(7,8,9), α = 0.5) when either of its return electrodes (e.g., EL7 or EL9) is defective. Results of experiment 1 showed that simply spanning the defective return electrode (e.g., pTP(6,8,9), α = 0.5 or pTP(7,8,10), α = 0.5) sometimes elicited a pitch discriminable from that of the missing standard pTP channel (e.g., pTP(7,8,9), α = 0.5) but not from that of the neighboring available standard pTP channel (e.g., pTP(8,9,10), α = 0.5 or pTP(6,7,8), α = 0.5). To create a channel that can replace pTP(7,8,9), α = 0.5, current steering may be applied to asymmetrically spanned pTP stimuli so that the excitation centroid is shifted back onto EL8 and the discriminability from the neighboring available standard pTP channels is improved. The neural excitation patterns of pTP(6,8,9) with different steering coefficient α were simulated using the computational model (Goldwyn et al. 2010) and shown in Figure 6. In line with the results of current steering in standard pTP mode (Wu and Luo 2013), the excitation centroids (circles) of pTP(6,8,9) shifted towards the apex as α increased or when more current was returned to the basal return electrode. The excitation peaks (triangles) had much smaller apical shifts than the centroids did. Based on the modeling results, an α between 0.5 (blue curve and circle) and 0.75 (black curve and circle) for pTP(6,8,9) was expected to shift the centroid back onto EL8 and thus elicit a pitch similar to that of pTP(7,8,9), α = 0.5 (red curve and circle). The model also predicted that for pTP(7,8,10) (not shown in Fig. 6), an α between 0.25 and 0.5 may shift the centroid back onto EL8 and thus elicit a pitch similar to that of pTP(7,8,9), α = 0.5. Since a number of assumptions were simplified to make the model computationally tractable, these model predictions had inherent uncertainties and were tested in the following experiment.
FIG. 6.
Simulated neural excitation patterns for pTP(7,8,9), α = 0.5 and pTP(6,8,9) with α = 0.25, 0.5, and 0.75. See the caption of Fig. 2 for more details.
Methods
Based on the modeling results, pTP(6,8,9) and pTP(7,8,10) with different steering coefficient α from 0.25 to 0.75, in steps of 0.125 were first matched in loudness and then compared in pitch to pTP(7,8,9), α = 0.5 at MCL, using methods similar to those in experiment 1. The same σmax for pTP(7,8,9), α = 0.5 was used for pTP(6,8,9) and pTP(7,8,10) with different α. The other stimulation parameters were the same as those in experiment 1. In each trial of the pitch-ranking task, the standard pTP stimulus and a randomly chosen target stimulus (i.e., an apically or basally spanned pTP stimulus with a randomly chosen α) were presented in random order. Subjects were asked to judge which stimulus was higher in pitch. The percentages that the targets were chosen were recorded. Each target stimulus was tested 10 times in a run. If the results of two runs differed by more than 30 % for any stimulus pair, an additional run was tested.
Results
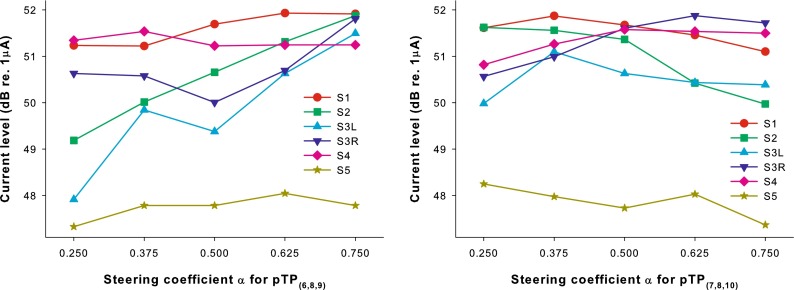
Figure 7 shows the current level at MCL as a function of the steering coefficient α for apically or basally spanned pTP stimuli (left and right panels, respectively). One-way RM ANOVAs showed a significant effect of α on the MCL level for pTP(6,8,9) (F4,20 = 4.79, p = 0.007) but not for pTP(7,8,10) (F4,20 = 1.01, p = 0.43). Post hoc Bonferroni t-tests showed that the MCL level for pTP(6,8,9) was only significantly higher with α = 0.75 than with α = 0.25 (p = 0.006). This differed from the loudness balance results with current steering in standard pTP mode. Wu and Luo (2013) found that the MCL level for pTP(7,8,9) was significantly higher with α = 0.5 than with α around 0 or 1, presumably because the excitation pattern was more focused for pTP mode (α = 0.5) than for pBP mode (α = 0 or 1). It is not surprising that apical or basal spanning in pTP mode may have changed the relative degree of current focusing and thus the equal-loudness current requirements with different α.
FIG. 7.
Loudness-balanced most comfortable levels (in dB re 1 μA) as a function of the steering coefficient α for the apically spanned pTP(6,8,9) (left panel) and basally spanned pTP(7,8,10) (right panel).
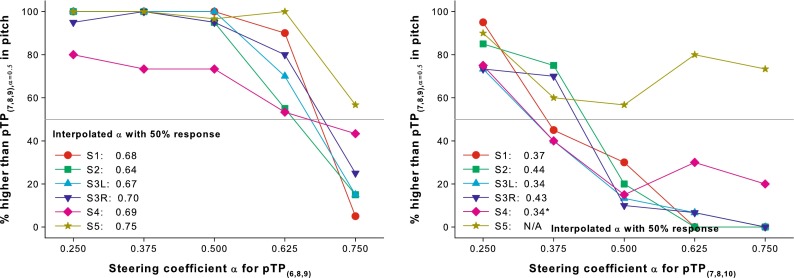
Figure 8 shows the pitch-ranking results between the standard stimulus pTP(7,8,9), α = 0.5 and the target stimuli (i.e., pTP(6,8,9) or pTP(7,8,10) with different α). The percentages that the target stimuli were judged as higher in pitch than the standard pTP stimulus are plotted as a function of α for pTP(6,8,9) (left panel) and pTP(7,8,10) (right panel). For all subjects, the psychometric functions for pTP(6,8,9) plateaued with α from 0.25 to 0.5 and decreased with α from 0.5 to 0.75. For all subjects except S5, the psychometric functions for pTP(7,8,10) monotonically decreased with α from 0.25 to 0.5 and leveled off with α from 0.5 to 0.75. One-way RM ANOVAs found a significant effect of α on the response percentages for both pTP(6,8,9) (F4,20 = 31.88, p < 0.001) and pTP(7,8,10) (F4,20 = 16.98, p < 0.001). These results suggest that asymmetrically spanned pTP stimuli with increasing α elicited lower pitches. Different subjects were not equally sensitive to current steering in spanned pTP modes. For example, S4 and S5 performed the worst among subjects. Again, the σmax value was not significantly correlated with the slope of psychometric function in each panel of Figure 8.
FIG. 8.
Percentages that pTP(6,8,9), α = 0.25, …, 0.75 (left panel) and pTP(7,8,10), α = 0.25, …, 0.75 (right panel) were judged as higher in pitch than pTP(7,8,9), α = 0.5. The interpolated α values with 50 % responses (gray lines) for pTP(6,8,9) and pTP(7,8,10) are shown for each subject.
All the psychometric functions in Figure 8 were fitted with the sigmoid function in Equation 1 to find the α values for pTP(6,8,9) and pTP(7,8,10) that may elicit a similar pitch as pTP(7,8,9), α = 0.5. The interpolated α values with 50 % responses on the best-fit sigmoid functions for pTP(6,8,9) and pTP(7,8,10) are shown for each subject in Figure 8. Due to pitch reversals, the functions of S4 and S5 for pTP(7,8,10) were not successfully fitted with the sigmoid function. Instead, the α value with 50 % responses for S4 was estimated by a linear interpolation between α = 0.25 and 0.375. The interpolated α values with 50 % responses for pTP(6,8,9) ranged from 0.64 to 0.75 with a mean of 0.69 across subjects, while those for pTP(7,8,10) ranged from 0.34 to 0.44 with a mean of 0.38. These α values were within the ranges estimated by the computational model.
EXPERIMENT 3: SYMMETRIC ELECTRODE SPANNING WITH CURRENT FOCUSING
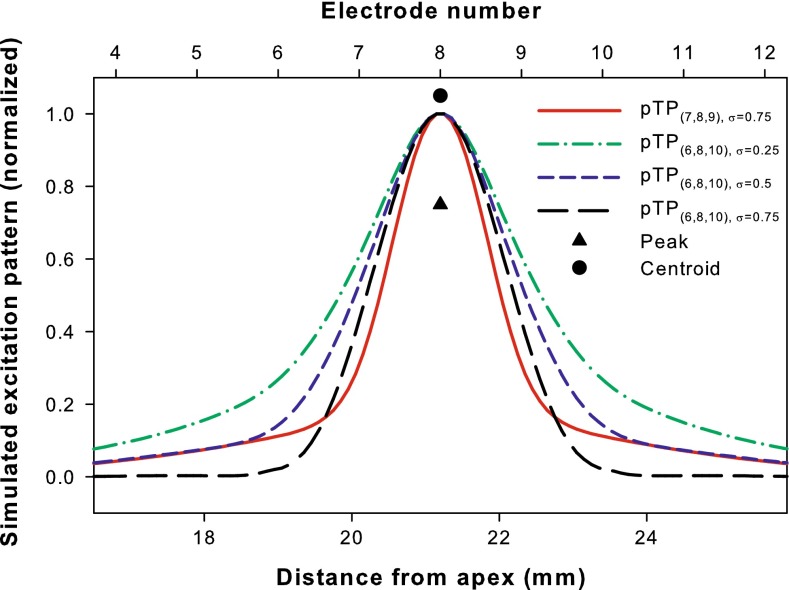
Another approach to handling defective return electrodes (e.g., EL7 and/or EL9 for pTP(7,8,9), α = 0.5) was to symmetrically span both return electrodes (e.g., pTP(6,8,10), α = 0.5). The simulated excitation patterns in Figure 9 showed that with the same compensation coefficient σ (0.75), pTP(6,8,10), α = 0.5 had the same excitation centroids (circles) and peaks (triangles) as pTP(7,8,9), α = 0.5 (all on EL8). However, the excitation pattern of pTP(6,8,10), α = 0.5 (black curve) was broader around EL8 but more reduced around EL6 and EL10 than that of pTP(7,8,9), α=0.5 (red curve). It is unclear whether and how such changes in excitation pattern predicted by the simplified model may affect pitch perception. Also, results of experiment 1 suggest that apical and basal spanning may not have perfectly symmetric effects on the excitation centroid. When they both occur in symmetric electrode spanning, the pitch may change. To find a symmetrically spanned pTP channel that was similar to pTP(7,8,9) in pitch, we proposed to adjust the compensation coefficient σ while maintaining the steering coefficient α at 0.5 for pTP(6,8,10). This may vary the degree of focusing for pTP(6,8,10) while keeping the excitation centroid and peak on EL8 (e.g., blue curve for σ = 0.5 and green curve for σ = 0.25 in Fig. 9). Previous studies (Litvak et al. 2007; Marzalek et al. 2007; Landsberger et al. 2012) have shown that more focused stimuli may have a purer, cleaner, or higher sound quality with a more salient pitch. The following experiment thus tested pitch ranking between pTP(6,8,10) with various σ and pTP(7,8,9) with its highest possible σmax (as determined in experiment 1) to see which σ for pTP(6,8,10) may elicit a similar pitch as pTP(7,8,9).
FIG. 9.
Simulated neural excitation patterns for pTP(7,8,9), σ = 0.75 and pTP(6,8,10) with σ = 0.25, 0.5, and 0.75. The steering coefficient α is fixed at 0.5 for all the simulations. See the caption of Fig. 2 for more details.
Methods
The steering coefficient α was fixed at 0.5 for all the stimuli in this experiment. The highest compensation coefficient σmax that supported full loudness growth for the symmetrically spanned pTP(6,8,10) was determined using the binary search algorithm (Wu and Luo 2013) and was found to be slightly higher than the σmax for the standard pTP(7,8,9) in all subjects. The tested σ for pTP(6,8,10) ranged from 0 to the subject- and mode-specific σmax. The standard pTP(7,8,9) used its own σmax as determined in experiment 1. The symmetrically spanned pTP(6,8,10) with different σ were first matched in loudness and then compared in pitch to the standard pTP(7,8,9) at MCL, using methods similar to those in the previous experiments.
Results
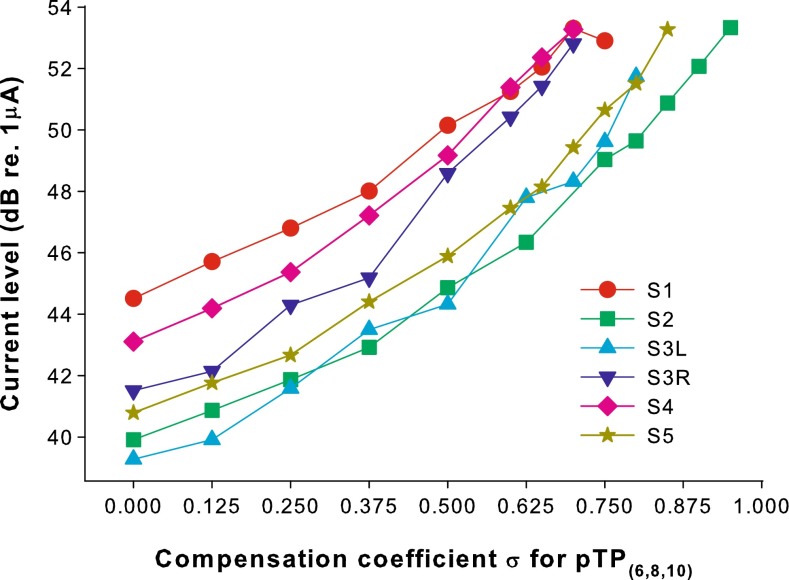
The loudness-balanced MCL levels for pTP(6,8,10) are plotted as a function of σ for each subject in Figure 10. A linear mixed model was used to fit the MCL levels in decibel with subject as the random factor and σ as the fixed factor. There was a significant effect of σ (t49 = 35.14, p < 0.01) and the coefficient for σ was 14.41. Monotonically increasing equal-loudness contours across σ have also been found for standard pTP mode (Litvak et al. 2007; Landsberger et al. 2012). A higher σ in standard or symmetrically spanned pTP mode may narrow the spread of excitation and thus require more current to maintain equal loudness.
FIG. 10.
Loudness-balanced most comfortable levels (in dB re 1 μA) as a function of the compensation coefficient σ for the symmetrically spanned pTP(6,8,10).
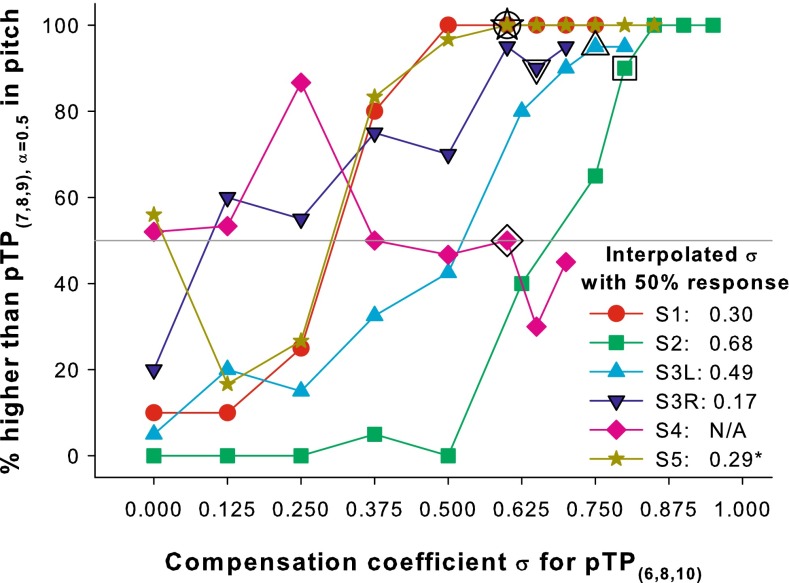
Figure 11 shows the percentages that pTP(6,8,10) with various σ were judged as higher in pitch than pTP(7,8,9) with its own σmax. For all subjects except S4, the response percentages generally increased from ≤50 to ~100 % when the σ for pTP(6,8,10) increased from 0 (i.e., MP mode; the left most data point of each plot) to the subject- and mode-specific σmax (i.e., the right most data point of each plot). A linear mixed model was used to fit the percentages with subject as the random factor and σ as the fixed factor. There was a significant effect of σ (t49 = 9.68, p < 0.01) and the coefficient for σ was 99.64. This suggests that most subjects perceived higher pitches with increasing σ for pTP(6,8,10). Consistent with the results of Litvak et al. (2007) and Landsberger et al. (2012), MP mode (i.e., σ = 0; the left most data point of each plot) was generally lower in pitch than standard pTP(7,8,9) with its own σmax.
FIG. 11.
Percentages that pTP(6,8,10) with various σ were judged as higher in pitch than pTP(7,8,9) with its own σ max. The pitch-ranking results of pTP(7,8,9) vs. pTP(6,8,10) with the same σ (i.e., the σ max for pTP(7,8,9)) are enclosed by black borders and were mostly higher than the 50 % chance level (gray line). The interpolated σ value with 50 % responses for pTP(6,8,10) is shown for each subject.
The psychometric functions in Figure 11 were fitted with the sigmoid function in Equation 1 to find the interpolated σ values with 50 % responses for pTP(6,8,10), which may elicit a pitch similar to that of pTP(7,8,9). The fitting was successful for all subjects except S4, who may have damaged auditory nerve fibers from NF2 tumor removal (Colletti et al. 2009). The data point of pTP(6,8,10) with σ = 0 was removed for S5 to have more accurate function fitting. The interpolated σ values with 50 % responses for pTP(6,8,10) were always smaller than the σmax for pTP(7,8,9) and ranged from 0.17 to 0.68 across subjects.
DISCUSSION
Asymmetric Electrode Spanning
The relative pitches of asymmetrically spanned pTP stimuli (i.e., pTP(6,8,9), α = 0.5 and pTP(7,8,10), α = 0.5) were in good agreement with the shifted centroids of their simulated excitation patterns in the computational model. These results, together with those of pTP-mode current steering (Wu and Luo 2013), suggest that place-pitch perception with CIs is more likely determined by the centroid than by the peak of excitation. This point has also been made by examining the pitch perception results (Saoji and Litvak 2010) and forward-masking patterns (Saoji et al. 2013) of phantom electrode stimuli. In pTP mode with asymmetric electrode spanning, the electric fields of nonadjacent return and main electrodes may still be fused together to elicit a single pitch percept, as predicted by the computational model. In fact, no subject reported hearing multiple pitches with either the apically or basally spanned pTP stimulus. Asymmetric electrode spanning was predicted to reduce the spread of excitation in regions further away from the main electrode on the side of electrode spanning. Such predicted changes in excitation patterns can explain the perceived pitch shifts in the pitch-ranking tests, but should be verified in the future using measures such as psychophysical forward-masking patterns.
The pitch shifts of basal electrode spanning in pTP mode were largely in the same direction as those in pBP mode (Saoji and Litvak 2010), although the latter were more variable across subjects and electrodes (i.e., pitch decreased or was the same in only 12 out of 20 cases). The smaller number of subjects and electrodes tested in this study may partially explain why the effects of pTP-mode electrode spanning were more consistent across cases. Also, the return current within the cochlea was divided into halves and sent to two (instead of one) electrodes in pTP mode, which may have reduced the perceptual salience of side lobes around return electrodes (a possible cause of pitch reversals in pBP mode; Saoji and Litvak 2010). Another possibility is that pTP mode had two side lobes, which may have more evenly balanced the shift of excitation centroid caused by basal electrode spanning. It is not possible to directly compare the degree of pitch shifts caused by basal electrode spanning in pTP or pBP mode, due to the differences in study design.
Subjects showed variable sensitivity to the pitch changes caused by apically or basally spanned pTP stimuli, maybe due to different neural survival and electrode-neuron distances. For example, S4 may have the poorest neural survival among subjects because of her NF2 tumor removal. S4 did have the shallowest psychometric functions in Figure 4, suggesting that she was the least sensitive to the pitch changes caused by either apical or basal spanning. Neither the age at testing nor duration of CI use seemed to affect the pitch-ranking results of asymmetric electrode spanning. For example, the oldest S1 and the youngest S2 performed similarly. Also, S3 had similar performance in both ears, even though her right ear was implanted 5 years later than her left ear. The intersubject variability in pitch sensitivity to asymmetric electrode spanning was also not due to the used σmax values, as indicated by the lack of correlation between the σmax value and slope of psychometric function in each panel of Figure 4.
It is possible that subjects with better pitch discrimination of main electrodes in standard pTP mode would be more sensitive to the pitch changes caused by asymmetric electrode spanning in pTP mode, because both measures may be commonly affected by factors such as subject’s neural survival. For example, the best performers S1 and S2 in standard pTP-mode electrode discrimination also had the steepest psychometric functions for apical spanning pitch discrimination (top panel of Fig. 4). On the other hand, the poorest performers S4 and S5 in standard pTP-mode electrode discrimination had the shallowest functions for basal spanning pitch discrimination (bottom panel of Fig. 4). However, across subjects, there was no correlation between the electrode discrimination ability and function slope in each panel of Figure 4. In another analysis using pTP(7,8,9), α = 0.5 as the reference stimulus, the overall sensitivity to both apical and basal spanning was quantified by adding the perceptual distance (i.e., d’ value) between pTP(6,8,9), α = 0.5 and pTP(7,8,9), α = 0.5 to that between pTP(7,8,9), α = 0.5 and pTP(7,8,10), α = 0.5 in Figure 4. Because the pitches of the two asymmetrically spanned pTP stimuli were generally between those of the standard pTP stimuli on main electrodes EL7 and EL9, the relevant electrode discrimination ability was quantified as the cumulative d’ from pTP(6,7,8), α = 0.5 to pTP(7,8,9), α = 0.5 and then to pTP(8,9,10), α = 0.5 in Figure 3. Again, there was no significant correlation (r = −0.28, p = 0.59) between the electrode discrimination ability and sensitivity to spanning. The excitation pattern seemed to have major changes only around the nonadjacent return electrode in asymmetric spanning (Fig. 2), while the whole pattern shifted from one electrode to the next in electrode discrimination. The two tasks may thus require different degree of place-pitch sensitivity and involve responses from different neuron populations. Consequently, a CI user’s electrode discrimination ability in standard pTP mode cannot predict his/her sensitivity to pTP-mode electrode spanning.
Asymmetric Electrode Spanning with Current Steering
Pitch lowering with increasing steering coefficient α has also been found between pairs of standard pTP stimuli with an α interval of 0.1 (Wu and Luo 2013). However, the degree of pitch changes with α cannot be compared between spanned and standard pTP modes, due to the different designs of pitch-ranking tests in the two studies. Nevertheless, current steering seemed to have a similar effect on pitch perception (at least in terms of the direction of pitch changes) in both spanned and standard pTP modes. Although one of the return electrodes was not adjacent to the main electrode in asymmetrically spanned pTP modes, varying the distributions of return current was still able to shift the excitation centroid and change the perceived pitch, as suggested by the modeling results.
In clinical fittings, the exact pitch-matched α values for pTP(6,8,9) and pTP(7,8,10) cannot be determined when the target channel pTP(7,8,9), α = 0.5 does not have a well-defined pitch percept and is not testable due to the defective return electrode. Based on the results of experiment 2, clinicians may simply use pTP(6,8,9) with α around 0.69 to replace pTP(7,8,9), α = 0.5 if EL7 is defective and check whether the channel used for replacement is well discriminable from the next available channel pTP(8,9,10), α = 0.5. If EL9 is defective, pTP(7,8,10) with α around 0.38 may be used to replace pTP(7,8,9), α = 0.5 as long as the channel used for replacement is well discriminable from the previous available channel pTP(6,7,8), α = 0.5.
Symmetric Electrode Spanning with Current Focusing
Litvak et al. (2007) reported that some CI users perceived symmetrically spanned pTP stimuli (e.g., pTP(4,8,12) with various compensation coefficient σ) as higher in pitch than MP stimuli. In a test of the sound quality with current focusing, Landsberger et al. (2012) found that for CI users who showed narrower forward-masking patterns from MP to standard pTP stimuli, a higher σ usually produced a purer, cleaner, or higher sound. Compared to MP stimuli, focused pTP stimuli may also enhance pitch strength (Marzalek et al. 2007). Based on these results, the higher degree of current focusing with increasing σ for pTP(6,8,10) may have produced a purer, cleaner, or higher sound with a more salient pitch, which may be confounded with a pitch increase. On the other hand, although the model predicted the excitation centroid of pTP(6,8,10) to be on EL8 (Fig. 9), the actual current spread and neural excitation may be stronger on the basal side than on the apical side, due to the lower basal impedance. This would also lead to higher pitch percepts with increasing σ for pTP(6,8,10).
When pTP(6,8,10) and pTP(7,8,9) had the same σ value (i.e., the σmax for pTP(7,8,9) as indicated by the symbols with black borders in Fig. 11), pTP(6,8,10) was higher in pitch than pTP(7,8,9) for all subjects except S4. Based on the modeling results (Fig. 9), the spread of excitation for pTP(6,8,10) may be broader around EL8 but more reduced around EL6 and EL10, compared to that of pTP(7,8,9) with the same σ. It is possible that the reduction of neural activity around EL6 and EL10 for pTP(6,8,10) may have been more notable than the increase of neural activity around EL8, leading to an overall more focused excitation pattern and thus a higher-pitched sound. Another possibility is that when both return electrodes were spanned in pTP(6,8,10), apical spanning may have been more effective than basal spanning in shifting the neural excitation centroid (Fig. 5, experiment 1). The excitation centroid of pTP(6,8,10) may thus have an overall basal shift caused by the more effective apical spanning and elicit a pitch higher than that of pTP(7,8,9) with the same σ. These two possible explanations call for direct measurements of the neural excitation patterns for pTP(7,8,9) and pTP(6,8,10) with the same σ. Preliminary data from Padilla and Landsberger (2013) suggest that with the same σ (0.75), pTP(7,8,9) may have a narrower excitation pattern than pTP(6,8,10).
In clinical fittings, the exact pitch-matched σ values for pTP(6,8,10) again cannot be determined when the target channel pTP(7,8,9) does not have a well-defined pitch percept and is not testable due to the defective return electrode. Based on the data of experiment 3, the missing target channel may be replaced by a symmetrically spanned pTP channel with a smaller σ value as long as the channel used for replacement is well discriminable from the neighboring available standard pTP channels.
CONCLUSIONS
This study investigated pitch perception of standard, asymmetrically spanned, and symmetrically spanned pTP stimuli on the same main electrode EL8 in five female CI users and in a computational model. The following conclusions can be made:
Compared to standard pTP(7,8,9), α = 0.5, apically spanned pTP(6,8,9), α = 0.5 generally elicited a higher pitch between those of pTP(7,8,9), α = 0.5 and pTP(8,9,10), α = 0.5, while basally spanned pTP(7,8,10), α = 0.5 elicited a lower pitch between those of pTP(6,7,8), α = 0.5 and pTP(7,8,9), α = 0.5. The pitch increase caused by apical spanning was more salient than the pitch decrease caused by basal spanning.
Current steering in apically or basally spanned pTP mode had a similar effect on pitch perception as that in standard pTP mode. Pitch decreased when the steering coefficient α (i.e., the ratio of current returned to the basal electrode) increased. Apically spanned pTP(6,8,9) with α around 0.69 or basally spanned pTP(7,8,10) with α around 0.38 may elicit a similar pitch as pTP(7,8,9), α = 0.5 and can be used to replace the standard pTP channel when either of its return electrodes is defective.
For symmetrically spanned pTP(6,8,10), α = 0.5, higher pitches were perceived as the compensation coefficient σ (i.e., the ratio of current returned to the two intracochlear electrodes) increased, possibly due to the narrower excitation patterns. With the same σ, pTP(6,8,10), α = 0.5 was higher in pitch than pTP(7,8,9), α = 0.5. A smaller σ was thus required for pTP(6,8,10), α = 0.5 to elicit a similar pitch as pTP(7,8,9), α = 0.5 or to replace the standard pTP channel when either of its return electrodes is defective.
Acknowledgments
We are grateful to all subjects for their participation in the experiments. Research was supported in part by NIH (R21-DC-011844) and by Purdue Research Foundation. The editors and two anonymous reviewers provided constructive comments on an earlier version of the manuscript.
Contributor Information
Ching-Chih Wu, Email: wu94@purdue.edu.
Xin Luo, Phone: (765) 496-7267, FAX: (765) 494-0771, Email: luo5@purdue.edu.
References
- Bierer JA. Threshold and channel interaction in cochlear implant users: Evaluation of the tripolar electrode configuration. J Acoust Soc Am. 2007;121:1642–1653. doi: 10.1121/1.2436712. [DOI] [PubMed] [Google Scholar]
- Bierer JA, Middlebrooks JC. Cortical responses to cochlear implant stimulation: channel interactions. J Assoc Res Otolaryngol. 2004;5:32–48. doi: 10.1007/s10162-003-3057-7. [DOI] [PMC free article] [PubMed] [Google Scholar]
- Colletti V, Shannon RV, Carner M, Veronese S, Colletti L. Progress in restoration of hearing with the auditory brainstem implant. Prog Brain Res. 2009;175:333–345. doi: 10.1016/S0079-6123(09)17523-4. [DOI] [PubMed] [Google Scholar]
- Fishman KE, Shannon RV, Slattery WH. Speech recognition as a function of the number of electrodes used in the SPEAK cochlear implant speech processor. J Speech Lang Hear Res. 1997;40:1201–1215. doi: 10.1044/jslhr.4005.1201. [DOI] [PubMed] [Google Scholar]
- Friesen LM, Shannon RV, Baskent D, Wang X. Speech recognition in noise as a function of the number of spectral channels: comparison of acoustic hearing and cochlear implants. J Acoust Soc Am. 2001;110:1150–1163. doi: 10.1121/1.1381538. [DOI] [PubMed] [Google Scholar]
- Frijns JH, Snel-Bongers J, Vellinga D, Schrage E, Vanpoucke FJ, Briaire JJ. Restoring speech perception with cochlear implants by spanning defective electrode contacts. Acta Otolaryngol. 2013;133:394–399. doi: 10.3109/00016489.2012.754107. [DOI] [PubMed] [Google Scholar]
- Goldwyn JH, Bierer SM, Bierer JA. Modeling the electrode–neuron interface of cochlear implants: Effects of neural survival, electrode placement, and the partial tripolar configuration. Hear Res. 2010;268:93–104. doi: 10.1016/j.heares.2010.05.005. [DOI] [PMC free article] [PubMed] [Google Scholar]
- Hughes ML, Brown CJ, Abbas PJ. Sensitivity and specificity of averaged electrode voltage measures in cochlear implant recipients. Ear Hear. 2004;25:431–446. doi: 10.1097/01.aud.0000145111.92825.cc. [DOI] [PubMed] [Google Scholar]
- Jesteadt W. An adaptive procedure for subjective judgments. Atten Percept Psychophys. 1980;28:85–88. doi: 10.3758/BF03204321. [DOI] [PubMed] [Google Scholar]
- Jolly CN, Spelman FA, Clopton BM. Quadrupolar stimulation for Cochlear prostheses: modeling and experimental data. IEEE Trans Biomed Eng. 1996;43:857–865. doi: 10.1109/10.508549. [DOI] [PubMed] [Google Scholar]
- Kral A, Hartmann R, Mortazavi D, Klinke R. Spatial resolution of cochlear implants: the electrical field and excitation of auditory afferents. Hear Res. 1998;121:11–28. doi: 10.1016/S0378-5955(98)00061-6. [DOI] [PubMed] [Google Scholar]
- Kwon BJ, van den Honert C. Effect of electrode configuration on psychophysical forward masking in cochlear implant listeners. J Acoust Soc Am. 2006;119:2994–3002. doi: 10.1121/1.2184128. [DOI] [PubMed] [Google Scholar]
- Landsberger DM, Srinivasan AG. Virtual channel discrimination is improved by current focusing in cochlear implant recipients. Hear Res. 2009;254:34–41. doi: 10.1016/j.heares.2009.04.007. [DOI] [PMC free article] [PubMed] [Google Scholar]
- Landsberger DM, Padilla M, Srinivasan AG. Reducing current spread using current focusing in cochlear implant users. Hear Res. 2012;284:16–24. doi: 10.1016/j.heares.2011.12.009. [DOI] [PMC free article] [PubMed] [Google Scholar]
- Litvak LM, Spahr AJ, Emadi G. Loudness growth observed under partially tripolar stimulation: model and data from cochlear implant listeners. J Acoust Soc Am. 2007;122:967–981. doi: 10.1121/1.2749414. [DOI] [PubMed] [Google Scholar]
- Macherey O, Carlyon RP, van Wieringen A, Deeks JM, Wouters J. Higher sensitivity of human auditory nerve fibers to positive electrical currents. J Assoc Res Otolaryngol. 2008;9:241–251. doi: 10.1007/s10162-008-0112-4. [DOI] [PMC free article] [PubMed] [Google Scholar]
- Marzalek MS, Spahr AJ, Litvak LM (2007) Effects of multi-electrode stimulation on tone perception: modeling and outcomes. Conference on Implantable Auditory Prosthesis, Lake Tahoe, CA
- Padilla M, Landsberger DM (2013) Spread of excitation using a new stimulation mode: the virtual tripole. Conference on Implantable Auditory Prosthesis, Lake Tahoe, CA
- Saoji AA, Litvak LM. Use of “phantom electrode” technique to extend the range of pitches available through a cochlear implant. Ear Hear. 2010;31:693–701. doi: 10.1097/AUD.0b013e3181e1d15e. [DOI] [PubMed] [Google Scholar]
- Saoji AA, Landsberger DM, Padilla M, Litvak LM. Masking patterns for monopolar and phantom electrode stimulation in cochlear implants. Hear Res. 2013;298:109–116. doi: 10.1016/j.heares.2012.12.006. [DOI] [PMC free article] [PubMed] [Google Scholar]
- Shannon RV, Fu QJ, Galvin J. The number of spectral channels required for speech recognition depends on the difficulty of the listening situation. Acta Otolaryngol Suppl. 2004;552:50–54. doi: 10.1080/03655230410017562. [DOI] [PubMed] [Google Scholar]
- Snel-Bongers J, Briaire JJ, Vanpoucke FJ, Frijns JH. Influence of widening electrode separation on current steering performance. Ear Hear. 2011;32:221–229. doi: 10.1097/AUD.0b013e3181f8c0fe. [DOI] [PubMed] [Google Scholar]
- Snyder RL, Bierer JA, Middlebrooks JC. Topographic spread of inferior colliculus activation in response to acoustic and intracochlear electric stimulation. J Assoc Res Otolaryngol. 2004;5:305–322. doi: 10.1007/s10162-004-4026-5. [DOI] [PMC free article] [PubMed] [Google Scholar]
- Srinivasan AG, Landsberger DM, Shannon RV. Current focusing sharpens local peaks of excitation in cochlear implant stimulation. Hear Res. 2010;270:89–100. doi: 10.1016/j.heares.2010.09.004. [DOI] [PMC free article] [PubMed] [Google Scholar]
- Srinivasan AG, Shannon RV, Landsberger DM. Improving virtual channel discrimination in a multi-channel context. Hear Res. 2012;286:19–29. doi: 10.1016/j.heares.2012.02.011. [DOI] [PMC free article] [PubMed] [Google Scholar]
- Srinivasan AG, Padilla M, Shannon RV, Landsberger DM. Improving speech perception in noise with current focusing in cochlear implant users. Hear Res. 2013;299:29–36. doi: 10.1016/j.heares.2013.02.004. [DOI] [PMC free article] [PubMed] [Google Scholar]
- Tang Q, Benítez R, Zeng FG. Spatial channel interactions in cochlear implants. J Neural Eng. 2011;8:046029. doi: 10.1088/1741-2560/8/4/046029. [DOI] [PMC free article] [PubMed] [Google Scholar]
- Vanpoucke F, Zarowski A, Casselman J, Frijns J, Peeters S. The facial nerve canal: an important cochlear conduction path revealed by Clarion electrical field imaging. Otol Neurotol. 2004;25:282–289. doi: 10.1097/00129492-200405000-00014. [DOI] [PubMed] [Google Scholar]
- Wu CC, Luo X. Current steering with partial tripolar stimulation mode in cochlear implants. J Assoc Res Otolaryngol. 2013;14:213–231. doi: 10.1007/s10162-012-0366-8. [DOI] [PMC free article] [PubMed] [Google Scholar]


