Abstract
Driving the cochlea in reverse via the round window membrane (RWM) is an alternative treatment option for the hearing rehabilitation of a nonfunctional or malformed middle ear. However, cochlear stimulation from the RWM side is not a normal sound transmission pathway. The basilar membrane (BM) motion elicited by mechanical stimulation of the RWM is unknown. In this study, the BM movement at the basal turn was investigated in both reverse via RWM drive and acoustic stimulation in the ear canal or forward drive in postmortem isolated temporal bone preparations of guinea pigs. During reverse drive, a magnet-coil was coupled on RWM, and the BM vibration at the basal turn and the movement of the incus tip were measured with laser Doppler vibrometry. During forward drive, the vibration of the incus tip induced by sound pressure in the ear canal resulted in BM vibration and the BM movement at the same location as that in the reverse stimulation was measured. The displacement ratio of the BM to RWM in reverse drive and the ratio of the BM to incus in forward drive were compared. The results demonstrated that the BM response measured in both situations was similar in nature between forward and reverse drives. This study provides new knowledge for an understanding of BM movement induced by reverse drive via the RWM stimulation.
Keywords: round window driving, basilar membrane, laser doppler vibrometry, middle ear implantable device
INTRODUCTION
Middle ear implantable hearing devices have been used to overcome conductive hearing loss induced by middle ear pathologies or disorders. The devices commonly convert sound into mechanical vibrations of the ossicular chain or stapes, which are transmitted into the cochlea. The cochlea is stimulated in the forward direction. However, coupling the transducer to an ossicle is difficult in ears with middle ear disease, such as congenital aural atresia and ossicular malformation. An alternative way of coupling sound to the cochlea by driving the round window membrane (RWM), called reverse drive, was developed, and some preliminary studies on middle ear implantable devices have been reported (Colletti et al. 2006, 2009; Kiefer et al. 2006; Beltrame et al. 2009; Linder et al. 2009).
Wever and Lawrence (1950) first proposed that reverse drive via the RWM was equivalent to forward drive. In cat experiments, they found that when sound was presented separately to the oval window and round window, the cochlear potentials were similar under both types of stimuli. Dumon et al. (1995) and Spindel et al. (1995) reported that RWM stimulation can induce auditory brain stem responses and auditory nerve potentials similar to those produced by forward stimulation. Voss et al. (1996) measured the cochlear potentials under forward and reverse drive conditions, and the results generally agreed with those of Wever and Lawrence. Recently, Nakajima et al. (2010) and Stieger et al. (2013) measured the intracochlear sound pressures in scala vestibuli and scala tympani to evaluate floating mass transducer (FMT) stimulation at the RWM. They found that RWM stimulation with the FMT provided differential pressures across the cochlear partition that were comparable to those with oval window stimulation by sound in the ear canal.
Clinically, Colletti et al. (2006) reported an approach using the RWM as the site for FMT placement (FMT-RW) in six cases of conductive or mixed hearing loss where ossicular reconstruction had not been successful and conventional hearing aids were unsatisfactory. According to their results, improvements in postoperative aided thresholds were achieved for all patients. Improved pure-tone threshold or speech recognition scores after FMT stimulation on the RWM have also been reported in other clinical studies (Cuda et al. 2009; Linder et al. 2009; Martin et al. 2009; Streitberger et al. 2009; Rajan et al. 2011).
Vibration of the basilar membrane (BM) is one of the most critical indicators of sound transmission into the cochlea. It stimulates hair cells and consequently generates auditory nerve responses. BM vibration under acoustic forward stimulation through the ossicles has been reported in live animals (Rhode 1971; Nuttall et al. 1991; Ruggero and Rich 1991; Nuttall and Dolan 1996) and isolated temporal bones (Morioka et al. 1995; Hemmert et al. 2000; Dai and Gan 2010). However, BM vibration under reverse drive via the RWM has not been reported.
In this study, reverse drive via RWM stimulation in guinea pigs was performed by a magnet-coil coupling on the RWM. Vibration at the basal turn of the BM was measured with laser Doppler vibrometry (LDV) under the reverse and forward drive conditions. Vibration of the magnet on the RWM under reverse stimulation and vibration of the incus tip under forward stimulation were also measured with LDV. The displacement ratio of the BM to the magnet driving the RWM with reverse drive and the ratio of the BM to incus with forward drive were compared. The findings from this study provide useful information for understanding reverse drive via RWM stimulation for middle ear implantable devices.
METHODS
Preparation of Guinea Pig
Eight Hartley guinea pigs, weighing between 300 and 450 g, were included in this study. The study protocol was approved by the Institutional Animal Care and Use Committee of the University of Oklahoma and met the guidelines of the National Institutes of Health. The animals were free from middle ear disease as evaluated by otoscopy.
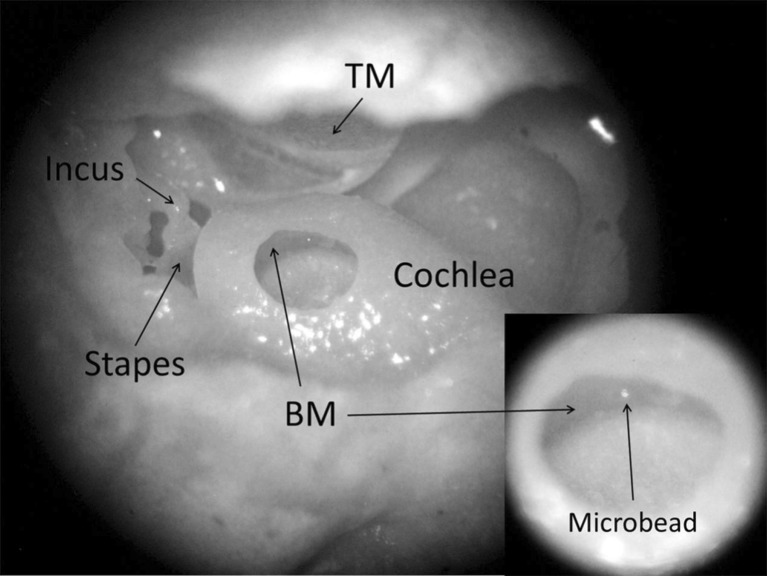
The guinea pig was deeply anesthetized (ketamine, 100 mg/kg, i.m., and xylazine, 10 mg/kg, i.m.) and decapitated. Then, the bulla was harvested. A small hole with a diameter of 2–3 mm was drilled in the posterior wall of the bulla to expose the cochlea and incus tip (Fig. 1). The cochlea was opened by carefully thinning the bony wall with a diamond drill bit over the scala tympani of the basal turn. To minimize the amount of perilymph leaking from the scala tympani, the hole in the cochlear bony wall was limited to 0.5–0.8 mm in diameter. The bulla was oriented in such a way that the BM in the region adjacent to the opening of cochlea was approximately horizontal. Under a surgical microscope (Zeiss 50, Germany), a glass microbead 30 μm in diameter (Mo-Sci Corp., Rolla, MO, USA) was placed on the BM as the light-reflecting object or laser target shown in Figure 1. The hole in the cochlear wall was covered with a thin glass sheet, and the gap between the wall and the glass sheet was sealed with dental cement (PD-135, Pac-Dent, CA, USA) after the placement of the bead.
FIG. 1.
The surgical window for opening the guinea pig cochlea at the basal turn of the BM, with a microbead placed on the BM, as shown in the inset at the lower right. TM tympanic membrane. To better present the experiment setup, in this photograph, there is no glass coverslip and no fluid in the cochlea.
Note that perilymph fluid might leak during the surgical process, and great care was taken to make sure that there was no clear evidence of a perilymph reduction and no bubble was visible inside the cochlea after it was covered with the glass sheet. In addition, before the hole was covered with the glass sheet, a syringe was used to drop a small amount of normal saline into the ST until it slightly overflowed. We then put the glass sheet on and sealed the glass window. We believe that, to some extent, this procedure could compensate for the leakage of perilymph and flush the air bubbles out.
The bulla was then wrapped in gauze soaked with saline during the experiment to prevent the desiccation of the tissues. In forward stimulation, the displacement of the incus tip was used to represent the stapes footplate displacement because the stapes footplate could not be accessed through the opening in the bulla. The natural reflection of the incus tip facilitated its vibration measurement, and no reflective bead was used for incus vibration measurement. The BM and incus tip measurements under forward stimulation were performed first and followed by reverse drive. To minimize the impact on the gross passive mechanical measures of ossicular, RWM, and BM motion, all vibration measurements were completed within 2–3 h after the removal of the bulla.
Experimental Setup for Forward Drive
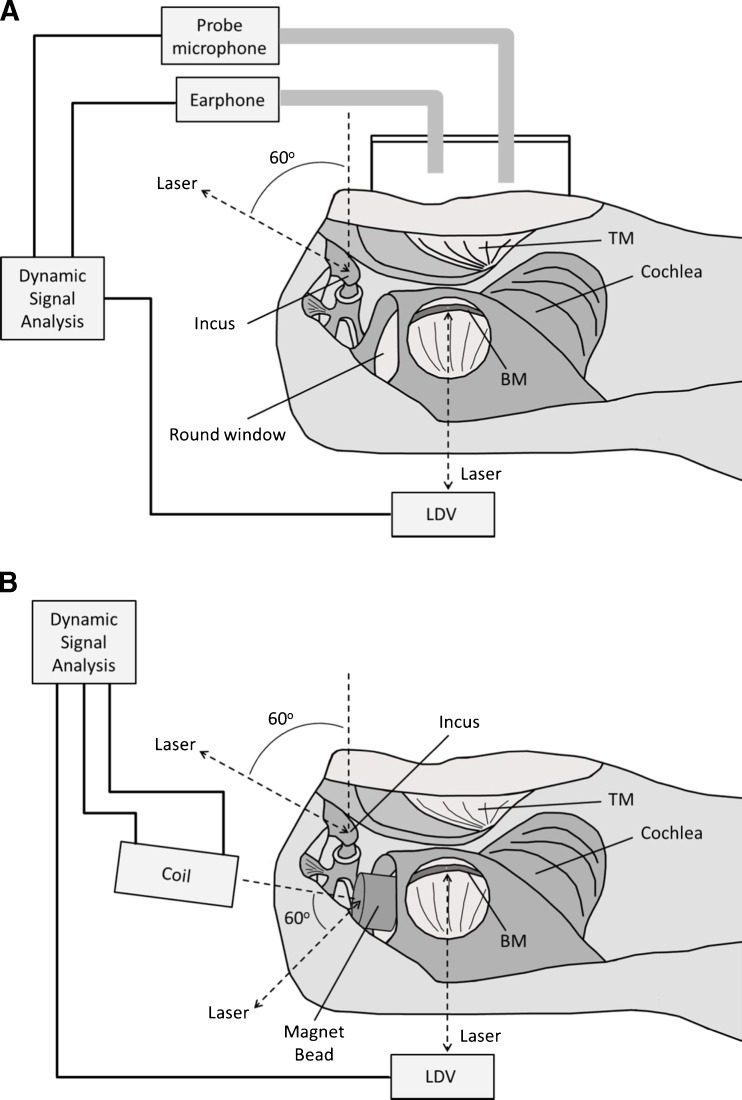
The method for the measurement of BM vibration induced by sound in the ear canal was similar to that reported by Dai and Gan (2010). Figure 2A is the schematic of the experimental setup. Briefly, 80-dB sound pressure level (SPL) pure tones over the frequency range of 1–40 kHz from a function generator (DSA 35670A, Hewlett-Packard, Palo Alto, CA, USA) were presented in the ear canal near the umbo by using the insert earphone. The tones were played sequentially from 1 to 40 kHz with 80 spectral lines. A hard plastic tube (diameter of 4 mm) was placed in the ear canal as the sound delivery tube and sealed to the canal wall with dental cement. A probe microphone (B&K 4938, Denmark) was used to monitor the input sound pressure level. The probe tubes of the microphone and earphone were integrated into the sound delivery tube, and the tip of the microphone probe tube was positioned approximately 2 mm from the umbo in the ear canal.
FIG. 2.
Schematic diagrams of the experimental setup in forward (A) and reverse drive (B). The laser beam produced by a laser Doppler vibrometer (LDV) was almost perpendicular to the BM. The angle between the laser beam at the incus tip and the direction of footplate movement was approximately 50–60 °; the angle between the laser beam at the RWM and the normal moving direction of RWM was approximately 60–70 °.
A laser Doppler vibrometer (Polytec HLV 1000, Tustin, CA, USA) was used to measure the movement of the BM and the incus tip. The directions of the laser beams on the BM at the basal turn and on the incus tip are shown in Figure 2A. The amplitude and phase of the input sound signals and the velocity of the BM and incus tip were recorded with the DSA for further analysis. Data were accepted only if the total harmonic distortion was less than 10 % according to the distortion index shown on the function generator. Peak-to-peak displacement (dp-p) of the BM or incus tip was directly calculated from the voltage output of the laser vibrometer’s velocity decoder dp-p = k(Avolt / πf), where Avolt is the amplitude of vibrometer output (velocity) in volts, f is frequency in kilohertz, and k is the output scale of the LDV in units of micrometer/second per volt. The phase reference in forward drive was the sound stimulus in the ear canal.
Experimental Setup for Reverse Drive
Lukashkin et al. (2011) reported a simple technology to perform RW stimulation in guinea pigs. A similar technology was used in this study. The experimental setup for measurement of BM vibration induced by RWM stimulation is shown in Figure 2B. A small magnet (disk 0.625 mm in height, 0.75 mm in diameter) was placed on the middle ear side of the RWM. A piece of fascia was placed between the magnet and RWM to attach the magnet on the RWM. The magnet was energized by an electromagnetic coil. The coil was placed in line with the magnet and perpendicular to the surface of the RWM. The distance between the tip of the coil and the magnet was about 2.0–2.2 mm. Sinusoidal voltage was used to drive the coil sequentially at 80 frequencies from 1 to 40 kHz, the same as the sound stimuli in forward driving. To induce the BM vibration at a level comparable to that in forward driving, the amplitude of voltage applied to the coil had to be determined beforehand. We assumed that the incus tip displacement was a reasonable estimate of cochlear function in reverse drive, thus the incus vibration was used as the baseline to introduce the driving force on the RWM. In our preliminary studies, we found that when the amplitude of voltage on the coil was maintained at 50 mV (rms) across the frequency range, the incus displacement was comparable to that in forward drive. Therefore, the sinusoidal voltage on the coil was maintained at 50 mV (rms) over the tested frequencies in the reverse drive experiment. Vibrations of the BM, incus tip, and magnet were measured sequentially. The same bead on the BM was used for measuring BM vibration for both forward and reverse drives.
It should be noted that the cochlea was opened upward in this experiment for easy measurements and to reduce perilymph leakage. During the measurement, the round window membrane was almost vertical. The fascia used to hold the magnet on the RWM was made as thin as possible to minimize its influence on vibration. The effect of the fascia on the accuracy of the measurement was estimated by a simple preliminary experiment (comparing the magnet movement under two conditions: with and without fascia), and the results indicated that it was negligible.
The angle between the laser beam and the normal direction of the stapes or the RWM was approximately 60 ° as shown in Figure 2B. The laser measurement angles for movement of the incus tip in both reverse and forward stimulations were assessed using a guinea pig bulla that was placed on a rotational stage. The bulla was opened widely so that the lateral surface of the incus could be observed microscopically, and the line of sight was approximately in the axis of the stapes’ piston movement. Then, the bulla was rotated until the view was similar to that in experiment. The angle of rotation was measured by a goniometer and was considered as the angle between the laser beam and the axis of the stapes’ piston motion.
RESULTS
Movement of the BM and Incus Tip in Forward Drive
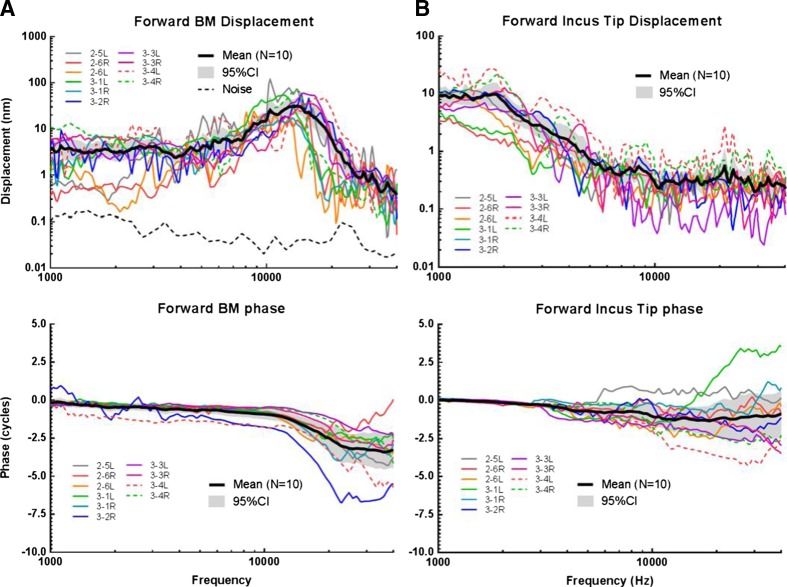
Figure 3(A) shows the peak-to-peak displacement magnitude (upper panel) and phase (bottom panel) curves of the BM vibration at the basal turn measured from 10 individual ears over 1–40 kHz in response to 80-dB SPL sound stimuli in the ear canal. The mean with ±95 % confidence interval (CI) for displacement magnitude and phase is also shown in the figure. The mean curve of BM displacement was almost flat (2.3–6 nm) at frequencies below 5 kHz. As the frequency increased, the displacement increased with a slope of 26 nm/oct, reached a maximum of 32 nm at 14 kHz, and then decreased fast with a slope of 39 nm/oct to 25 kHz. The peak of the BM displacement was observed at frequencies between 10 and 20 kHz. It is clear that the phase of BM displacement gradually decreased at f < 10 kHz but decreased fast over the displacement peak frequencies (10–20 kHz). At higher frequencies, the BM phase decreased slowly again. In addition, the black dotted line in Figure 3(A) is the noise level. It was the displacement of the bony wall without any stimulation and was measured at the beginning of the experiment. At the most frequencies, it was below 0.1 nm.
FIG. 3.
A The individual and mean (N = 10, with 95 % CI) peak-to-peak displacement magnitude and phase of the BM in response to an @@80-dB SPL sound input at the ear canal compared with the noise level (black dotted line). (B) The individual and mean (N = 10, with 95 % CI) peak-to-peak displacement magnitude and phase of the incus tip in response to an 80-dB SPL sound input at the ear canal.
Figure 3(B) displays the individual and mean (±95 % CI) peak-to-peak displacement curves of the incus tip measured with forward stimulation. The displacement reached a maximum of 10 nm at 1.8 kHz and decreased to 0.4 nm at 10 kHz with a slope of 2 nm/oct. At high frequencies (>10 kHz), the curve plateaued with a small fluctuation of about 0.4 nm. The mean phase of the incus tip gradually decreased from 0 to −1 cycle over 1–10 kHz and plateaued at higher frequencies. Large variations of incus phase were observed between individuals at f > 3 kHz, probably because of the relatively low displacement magnitude in this frequency range. In addition, the varied modes of complicated ossicular motion at high frequencies (Heiland et al. 1999; Hato et al. 2003) could play a role.
As shown in the lower panel of Figure 3, in forward drive, the difference of the mean phase curves between the BM and incus tip was very small at low frequencies. The mean phase of the BM was evidently lower than that of the incus at frequencies greater than 10 kHz.
Movement of the Incus Tip, BM, and RWM in Reverse Drive
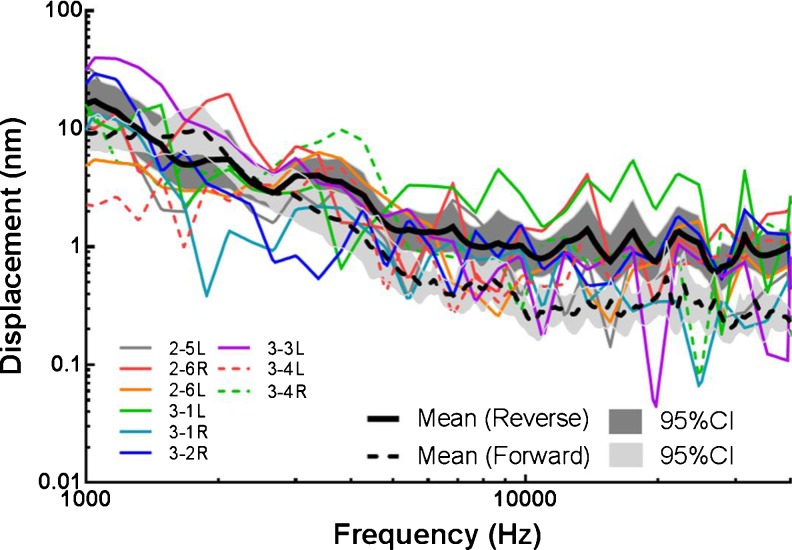
During reverse stimulation, vibration initiated at the RWM was transferred through the incompressible cochlear fluid to the oval window and induced the movement of ossicular chain. Figure 4 displays the individual (N = 9) and mean (±95 % CI) peak-to-peak displacement of the incus tip in reverse drive. With a constant voltage on the coil, the mean incus displacement decreased at 1–5 kHz with a slope of 3 nm/oct and nearly flattened at higher frequencies. The mean incus displacement in forward drive with 95 % CI (dashed black line) was also plotted in Figure 4 for comparison. The difference of incus tip displacement magnitude between forward and reverse drives was within 10 dB over 1–40 kHz. Thus, the reverse stimulation induced incus vibration at a comparable level to the forward stimulation.
FIG. 4.
The individual and mean (N = 9, with 95 % CI) peak-to-peak displacement magnitude of the incus tip in reverse drive (black solid line) compared to mean incus displacement in forward drive (black dash line).
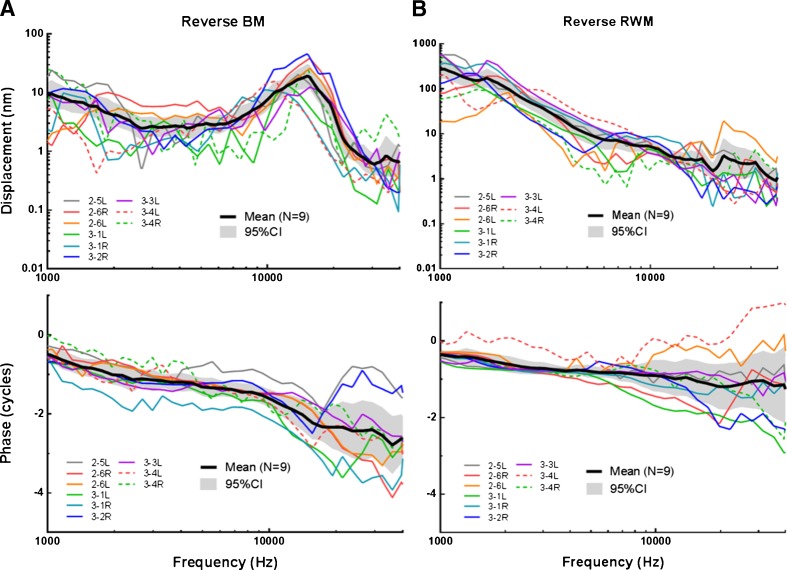
Figure 5(A) shows the individual (N = 9) and mean (±95 % CI) peak-to-peak displacement magnitude (upper panel) and phase (bottom panel) of the BM measured in reverse stimulation. The number of individual ears in reverse driving is 9 because one ear after forward drive measurement was damaged during the preparation for reverse drive. Under a constant voltage applied on the coil, a decreasing trend of the BM displacement was observed at low frequencies (<2.6 kHz). The BM displacement plateaued at frequencies of 2.6–6.5 kHz, increased with a slope of 15 nm/oct from 6.5 to 15 kHz, peaked at 15 kHz with a value of 19 nm, and decreased quickly with a slope of 39 nm/oct at 15–22 kHz. The phase of the BM decreased slowly from −0.5 cycle at 1 kHz to −1.6 cycle at 10 kHz and further decreased to −2.6 cycles at 40 kHz.
FIG. 5.
The individual and mean (N = 9, with 95 % CI) peak-to-peak displacement magnitude and phase of the BM (A) and the magnet on RWM (B) when the coil was driven by a sinusoidal voltage of 50 mV.
Figure 5(B) displays the individual and mean peak-to-peak displacement of the magnet on the RWM under reverse drive. Note that the scale of magnet displacement in Figure 4 is different from that of forward incus displacement in Figure 3(B). The magnet displacement magnitude (upper panel) continuously decreased from 160 nm at 1 kHz to 1 nm at 40 kHz. The phase (bottom panel) of the RWM decreased slowly at frequencies less than 10 kHz and further decreased to −1.7 cycles at 40 kHz.
As displayed in the lower panel of Figure 5, in reverse drive, the mean phase of the BM displacement was lower than that of RWM over the tested frequencies. The phase difference between the BM and RWM was more prominent at higher frequencies.
Comparison of Reverse and Forward Drives
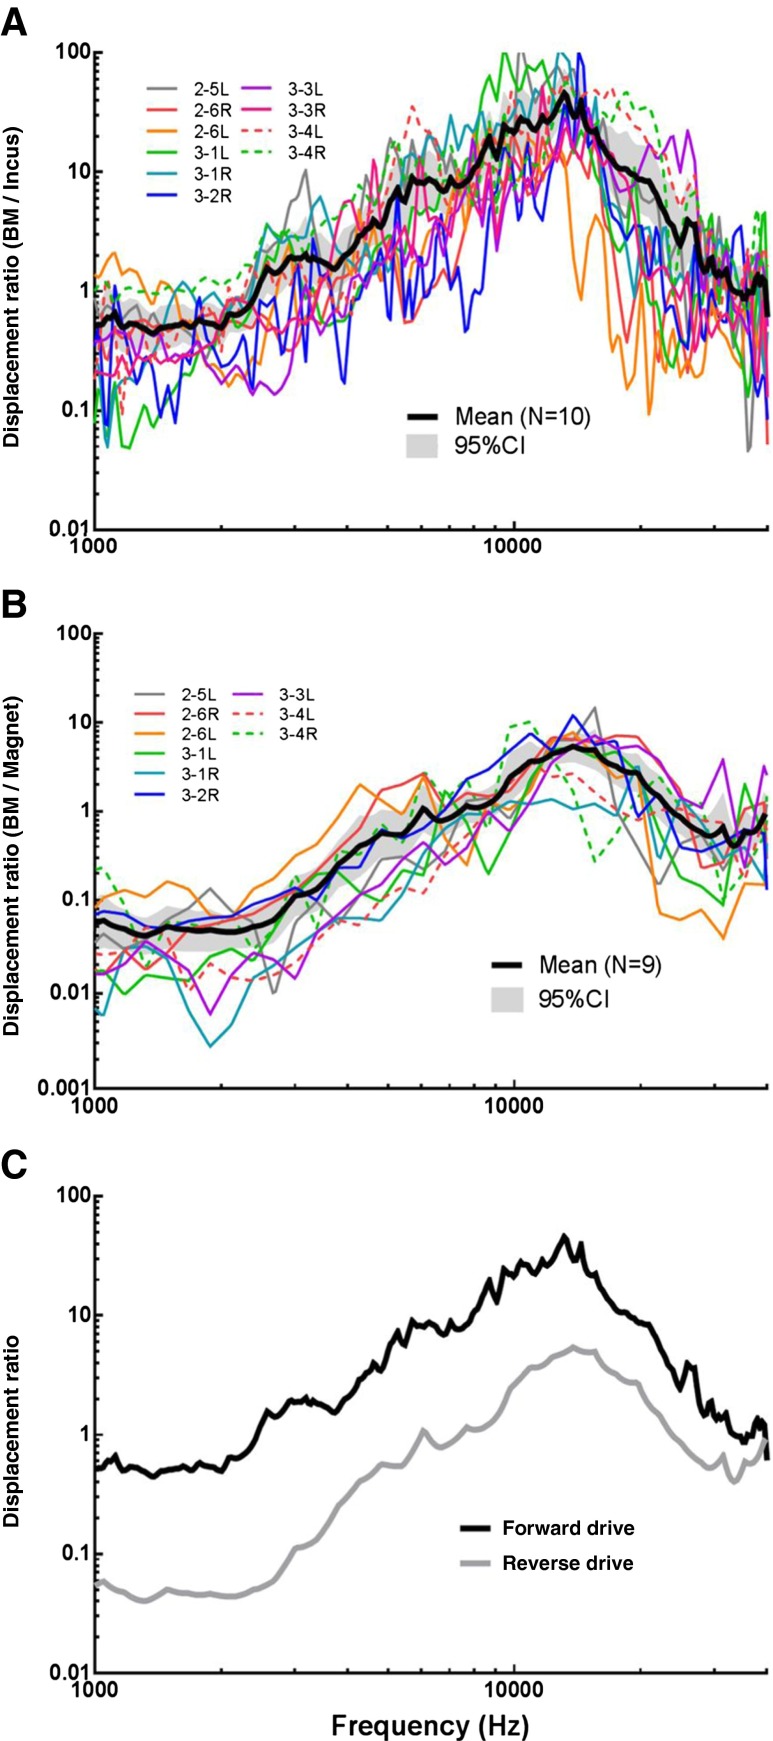
To compare the cochlear BM movement in reverse drive (RWM stimulation) with the BM movement in forward drive (sound induced incus stimulation), the displacement of the BM was normalized with respect to the displacement of the magnet attached to the RWM in reverse drive. In forward drive, the displacement of the BM was normalized with respect to the incus displacement. The displacement ratios of BM/incus obtained in forward drive from 10 ears are shown in Figure 6(A) with individual and mean (±95 %) curves. The displacement ratios of BM/magnet obtained in reverse drive from nine ears are displayed in Figure 6(B) with individual and mean curves.
FIG. 6.
A The individual and mean (N = 10, with 95 % CI) ratio of BM displacement to incus displacement in forward drive. B The individual and mean (N = 9, with 95 % CI) ratio of BM displacement to magnet displacement in reverse drive. C Comparison of the displacement ratio between forward (black line) and reverse drive (gray line).
For a better illustration, the mean curves in Figure 6(A, B) are plotted in Figure 6(C) (black line for forward drive and gray line for reverse drive). The two curves were both essentially flat at low frequencies (<2 kHz) and increased with slopes of approximately 17 dB per oct for forward drive and 2 dB per oct for reverse drive to their respective peaks. The forward curve peaked at 13 kHz with a value of 45. The peak of the reverse curve was at 14 kHz with a value of 5.4. Note that in Figure 6(C), the displacement ratio was plotted on a log scale, so the two curves are roughly parallel across frequencies. The BM displacement ratio to the incus in forward drive was greater than the BM displacement ratio to the magnet in reverse drive. After reaching the peak, the gap between the two curves became narrower as frequency increased and the curves even intersected at 40 kHz.
DISCUSSION
Comparison with Published Data
In this study, displacements of the BM and incus tip were measured in both forward and reverse drive, and the displacement of the RWM was estimated by measuring at the magnet in reverse stimulation. The BM displacement was normalized with the displacement of incus in forward drive and the displacement of the magnet on the RWM in reverse drive, respectively.
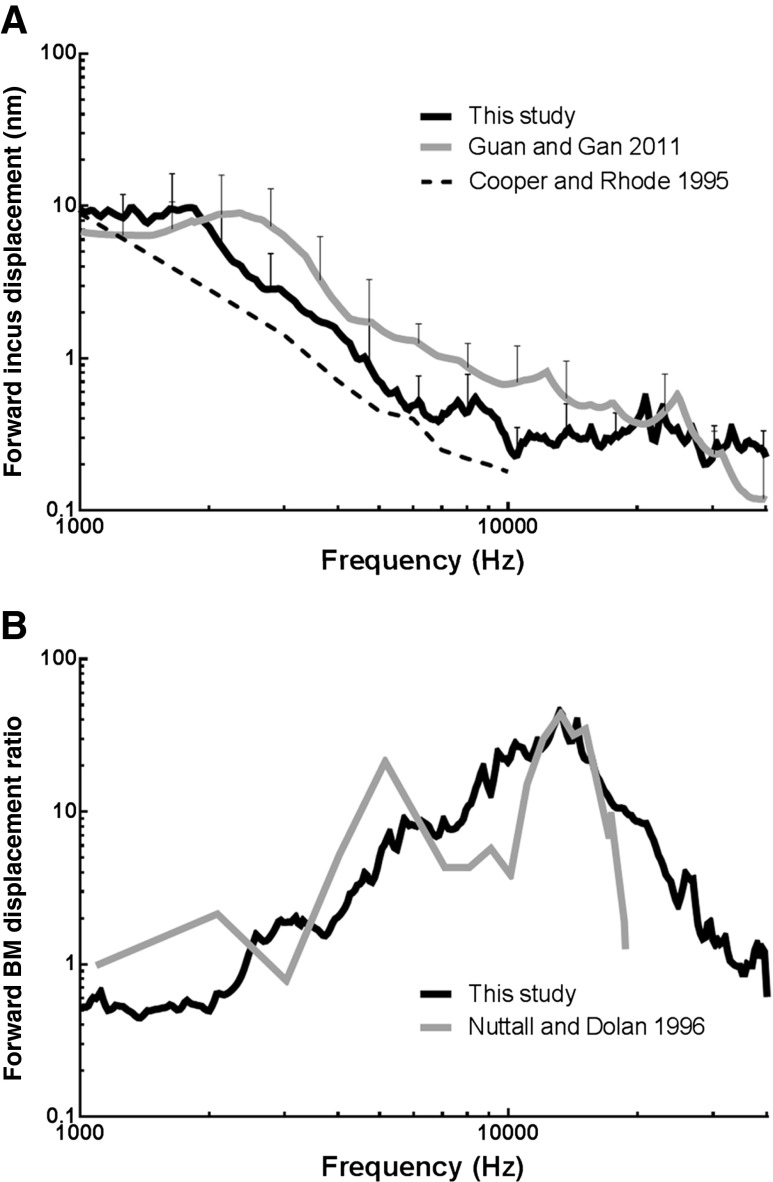
The displacement of the incus tip in guinea pigs under acoustic stimulation in the ear canal was published by Cooper and Rhode (1995) and Guan and Gan (2011). Figure 7A shows the comparison of the incus tip displacement in forward (black line) measured in this study with the published results. The original displacement data from Cooper and Rhode (Fig. 2 in their paper) were in decibels re 1 nm/Pa and have been converted to the equivalent peak-to-peak displacement under 80-dB SPL sound stimulation. The mean incus displacement in this study was generally lower than that reported by Guan and Gan (2011, Fig. 4A in their paper) and greater than that reported by Cooper and Rhode (1995). The discrepancies may be explained by the different measurement angles on the incus in these studies. In Guan and Gan (2011), the angle between the laser beam and the piston motion direction of the stapes was 40–50 °. In this study, the angle was larger (60 °). In Cooper and Rhode (1995), the measuring direction on the incudostapedial joint was “almost perpendicular to the stapedial axis.” The measurement of incus movement seems to be sensitive to the angle between the line of the laser and the piston direction of stapes. Therefore, the incus displacement in this study is consistent with previous similar measurements.
FIG. 7.
A Comparison of forward incus tip displacement in this study (black line) with that reported by Guan and Gan (2011, gray line) and Cooper and Rhode (1995, dash line). B Comparison of forward BM displacement ratio in this study (black line) with that reported by Nuttall and Dolan (1996).
Nuttall and Dolan (1996) reported the BM movement at the basal turn in live and postmortem guinea pigs when sound was applied in the ear canal. Figure 7B displays the comparison of BM movement ratio of forward driving in this study (black line) with their results (gray line, “postmortem” curve in Fig. 10 of their paper). Although the BM response peaks in Nuttall and Dolan (1996) appeared narrower than those in the present study (consistent with sharper tuning), the peak magnitudes were the same. Nuttall and Dolan’s response also appears to fluctuate more than that in this study, especially at low frequencies (though their low-frequency resolution seems low). The difference is likely due to the preparation difference between the two studies, one in vitro and the other in situ postmortem condition.
In a sensitive cochlea, the shape of the peak in BM movement is narrow for enhanced sensitivity. Nuttall and Dolan (1996) reported that when the cochlea became insensitive, such as postmortem, a broadening of the BM motion was observed. The slope below and especially above the peak frequency was decreased, revealing a decrease in sharpness of the tuning in BM. Ren and Nuttall (2001) also reported the comparison of BM motion in living versus postmortem gerbils (Fig. 3 in their paper), and their findings agreed with the study in guinea pigs reported by Nuttall and Dolan (1996). In Nuttall and Dolan’s study, the bulla was not dissected from the animal in the postmortem experiment. It is likely that the postmortem time from the death to the measurement in Nuttall and Dolan’s experiment was shorter than that in the current study. The mechanical properties of cochlear tissues should deteriorate with time due to metabolic changes under the postmortem condition. This may explain why the BM displacement ratio curve near peak frequency was wider than the results reported by Nuttall and Dolan (1996).
Comparison Between Forward and Reverse Drives
Round window stimulation has been used in clinics since 2006 and has shown satisfactory results. Improved pure-tone threshold or speech recognition scores after FMT stimulation on the RWM have been reported in many clinical studies. In the present study, the normalized BM motion at the basal turn in forward and reverse stimulations shown in Figure 6 suggests that the normalized BM displacement in these two driving conditions was flat at low frequencies and then increased to the peak. Generally, two curves in Figure 6(C) had the same shape and were parallel across frequencies, suggesting that the BM response to round window stimulation was essentially similar in nature to that of forward or acoustic stimulation in the ear canal. This finding supports the clinical outcomes reported in the literature (Colletti et al. 2006; Cuda et al. 2009; Martin et al. 2009).
Another finding of the present study is that the displacement ratio (BM/incus) during forward stimulation was higher than the displacement ratio (BM/magnet) during reverse stimulation. Dumon et al. (1995) reported the auditory evoked potentials with a piezoelectric vibrator placed on the RWM and the stapes, respectively, in guinea pigs. Their results indicated that the stimulation from the stapes was more effective than that from the RW. Our measurement agrees with their findings for mechanical driving in both forward and reverse directions. Recently, Stieger et al. (2013) measured the intracochlear pressures in scala vestibule (SV) and scala tympani (ST) during forward and reverse stimulations in fresh human temporal bones. Their results indicated that the differential pressure between SV and ST in reverse drive was lower than that in forward drive. Stieger et al. explained the causes for relatively low efficiency in reverse drive, which include (1) high impedance of the middle ear, (2) inefficient coupling of the RW actuator to the RWM, and (3) possible third window leakage of the cochlea. As a result, the RW actuator must be able to deliver significantly more volume flow than that developed by stapes motion for a similar level of differential pressure between SV and ST.
In our experiments, there might be some volume velocity leak at the RWM-magnet interface through the fascia, which would lower the effective input volume velocity for reverse drive. The leak of perilymph fluid at the surgical window in scala tympani would affect the BM measurement, particularly during reverse drive. If ongoing leaks occurred during the experiment, a potential problem is that the displacement ratio of BM to the magnet would be reduced over time. The initial and ongoing leaks both would decrease the efficiency of reverse drive. The leak at the surgical window probably also induced air bubbles in the scala tympani. Those possible factors, together with the involvement of middle ear impedance, may affect the RWM stimulation’s effectiveness in comparison with the acoustic forward drive. Future studies are needed to estimate the effect of the third window or RWM-actuator coupling issue on the efficiency of reverse drive.
CONCLUSION
In this study, the reverse drive of the cochlea was performed by using a magnet-coil coupling system to stimulate the RWM. The forward drive was induced by acoustic stimuli in the ear canal. Vibrations of the BM at the basal turn and of the incus tip were measured at frequencies from 1 to 40 kHz under forward and reverse drive conditions. The vibration of the magnet was also measured in reverse stimulation to monitor the RWM motion. The results demonstrated that electromagnetic coupling on the RWM can generate an effective BM vibration. The characteristic frequencies of BM vibration at the basal turn ranged between 13 and 14 kHz in both driving directions. Normalized BM motion in reverse drive was generally similar in nature to that in forward drive and was lower in magnitude at frequencies below its characteristic frequency. The reduction of the displacement ratio of BM to round window magnet in reverse drive was presumably caused by a combination of involvement of the middle ear impedance, insufficient coupling between the magnet and RWM and possible leakage at the surgical window in cochlea. To the authors’ knowledge, this is the first study to measure BM vibration in RWM stimulation. The findings obtained from this study provide useful information for understanding the reverse mechanism and BM motion.
Acknowledgments
This work was supported by the NSFC (China, 81070786) and the NIH (USA, R01DC011585). The experiment was conducted in the Biomedical Engineering Laboratory at the University of Oklahoma.
References
- Beltrame AM, Martini A, Prosser S, Giarbini N, Streitberger C. Coupling the Vibrant Soundbridge to cochlea round window: auditory results in patients with mixed hearing loss. Otol Neurotol. 2009;30:194–201. doi: 10.1097/MAO.0b013e318180a495. [DOI] [PubMed] [Google Scholar]
- Colletti V, Soli SD, Carner M, Colletti L. Treatment of mixed hearing losses via implantation of a vibratory transducer on the round window. Int J Audiol. 2006;45:600–608. doi: 10.1080/14992020600840903. [DOI] [PubMed] [Google Scholar]
- Colletti V, Carner M, Colletti L. TORP vs round window implant for hearing restoration of patients with extensive ossicular chain defect. Acta Otolaryngol. 2009;129:449–452. doi: 10.1080/00016480802642070. [DOI] [PubMed] [Google Scholar]
- Cooper NP, Rhode WS. Nonlinear mechanics at the apex of the guinea-pig cochlea. Hear Res. 1995;82(2):225–243. doi: 10.1016/0378-5955(94)00180-X. [DOI] [PubMed] [Google Scholar]
- Cuda D, Murri A, Tinelli N. Piezoelectric round window osteoplasty for Vibrant Soundbridge implant. Otol Neurotol. 2009;30:782–786. doi: 10.1097/MAO.0b013e3181b04d4d. [DOI] [PubMed] [Google Scholar]
- Dai CK, Gan RZ. Change in cochlear response in an animal model of otitis media with effusion. Audiol Neurootol. 2010;2010(15):155–167. doi: 10.1159/000241096. [DOI] [PMC free article] [PubMed] [Google Scholar]
- Dumon T, Zennaro O, Aran JM, Bebear JP. Piezoelectric middle ear implant preserving the ossicular chain. Otolaryngol Clin N Am. 1995;28:173–187. [PubMed] [Google Scholar]
- Guan X, Gan RZ. Effect of middle ear fluid on sound transmission and auditory brainstem response in guinea pigs. Hear Res. 2011;277:96–106. doi: 10.1016/j.heares.2011.03.003. [DOI] [PMC free article] [PubMed] [Google Scholar]
- Hato N, Stenfelt S, Goode RL. Three-dimensional stapes footplate motion in human temporal bones. Audiol Neurotol. 2003;8(3):140–152. doi: 10.1159/000069475. [DOI] [PubMed] [Google Scholar]
- Heiland KE, Goode RL, Asai M, Huber AM. A human temporal bone study of stapes footplate movement. Am J Otol. 1999;20(1):81–86. [PubMed] [Google Scholar]
- Hemmert W, Zenner H, Gummer AW. Characteristics of the travelling wave in the low-frequency region of a temporal-bone preparation of the guinea-pig cochlea. Hear Res. 2000;142:184–202. doi: 10.1016/S0378-5955(00)00017-4. [DOI] [PubMed] [Google Scholar]
- Kiefer J, Arnold W, Staudenmaier R. Round window stimulation with an implantable hearing aid (Soundbridge) combined with autogenous reconstruction of the auricle—a new approach. ORL J Otorhinolaryngol Relat Spec. 2006;68:378–385. doi: 10.1159/000095282. [DOI] [PubMed] [Google Scholar]
- Linder T, Schlegel C, DeMin N, van der Westhuizen S. Active middle ear implants in patients undergoing subtotal petrosectomy: new application for the Vibrant Soundbridge device and its implication for lateral cranium base surgery. Otol Neurotol. 2009;30:41–47. doi: 10.1097/MAO.0b013e31818be812. [DOI] [PubMed] [Google Scholar]
- Lukashkin AN, Weddell T, Russell IJ. Mechanisms of cochlear stimulation through the round window. AIP Conf Proc. 2011;1403(1):421–422. doi: 10.1063/1.3658123. [DOI] [Google Scholar]
- Martin C, Deveze A, Richard C, Lefebvre PP, Decat M, Ibanez LG, Truy E, Mom T, Lavieille JP, Magnan J, Dubreuil C, Tringali S. European results with totally implantable carina placed on the round window: 2-year follow-up. Otol Neurotol. 2009;30:1196–1203. doi: 10.1097/MAO.0b013e3181c34898. [DOI] [PubMed] [Google Scholar]
- Morioka I, Reuter G, Reiss P, Gummer AW, Hemmert W, Zenner HP. Sound-induced displacement responses in the plane of the organ of Corti in the isolated guinea-pig cochlea. Hear Res. 1995;83:142–150. doi: 10.1016/0378-5955(95)00002-L. [DOI] [PubMed] [Google Scholar]
- Nakajima HH, Dong W, Olson ES, Rosowski JJ. Evaluation of round window stimulation using the floating mass transducer by intracochlear sound pressure measurements in human temporal bones. Otol Neurotol. 2010;31(3):506–511. doi: 10.1097/MAO.0b013e3181c0ea9f. [DOI] [PMC free article] [PubMed] [Google Scholar]
- Nuttall AL, Dolan DF. Steady-state sinusoidal velocity responses of the basilar membrane in guinea pig. J Acoust Soc Am. 1996;99:1556–1565. doi: 10.1121/1.414732. [DOI] [PubMed] [Google Scholar]
- Nuttall AL, Dolan DF, Avinash G. Laser Doppler velocimetry of basilar membrane vibration. Hear Res. 1991;51:203–213. doi: 10.1016/0378-5955(91)90037-A. [DOI] [PubMed] [Google Scholar]
- Rajan GP, Lampacher P, Ambett R, Dittrich G, Kuthubutheen J, Wood B, McArthur A, Marino R. Impact of floating mass transducer coupling and positioning in round window vibroplasty. Otol Neurotol. 2011;32:271–277. doi: 10.1097/MAO.0b013e318206fda1. [DOI] [PubMed] [Google Scholar]
- Ren T, Nuttall AL. Basilar membrane vibration in the basal turn of the sensitive gerbil cochlea. Hear Res. 2001;151(1–2):48–60. doi: 10.1016/S0378-5955(00)00211-2. [DOI] [PubMed] [Google Scholar]
- Rhode WS. Observations of the vibration of the basilar membrane in squirrel monkeys using the Mossbauer technique. J Acoust Soc Am. 1971;49(4):Suppl 2–1218+. doi: 10.1121/1.1912485. [DOI] [PubMed] [Google Scholar]
- Ruggero MA, Rich NC. Application of a commercially-manufactured Doppler-shift laser velocimeter to the measurement of basilar-membrane vibration. Hear Res. 1991;51(2):215–230. doi: 10.1016/0378-5955(91)90038-B. [DOI] [PMC free article] [PubMed] [Google Scholar]
- Spindel JH, Lambert PR, Ruth RA. The round window electromagnetic implantable hearing-aid approach. Otolaryngol Clin N Am. 1995;28:189–205. [PubMed] [Google Scholar]
- Stieger C, Rosowski JJ, Nakajima HH. Comparison of forward (ear-canal) and reverse (round-window) sound stimulation of the cochlea. Hear Res. 2013;301:105–114. doi: 10.1016/j.heares.2012.11.005. [DOI] [PMC free article] [PubMed] [Google Scholar]
- Streitberger C, Perotti M, Beltrame MA, Giarbini N. Vibrant Soundbridge for hearing restoration after chronic ear surgery. Rev Laryngol Otol Rhinol. 2009;130:83–88. [PubMed] [Google Scholar]
- Voss SE, Rosowski JJ, Peake WT. Is the pressure difference between the oval and round windows the effective acoustic stimulus for the cochlea? J Acoust Soc Am. 1996;100:1602–1616. doi: 10.1121/1.416062. [DOI] [PubMed] [Google Scholar]
- Wever EG, Lawrence M. The acoustic pathways to the cochlea. J Acoust Soc Am. 1950;22:460–467. doi: 10.1121/1.1906628. [DOI] [Google Scholar]


