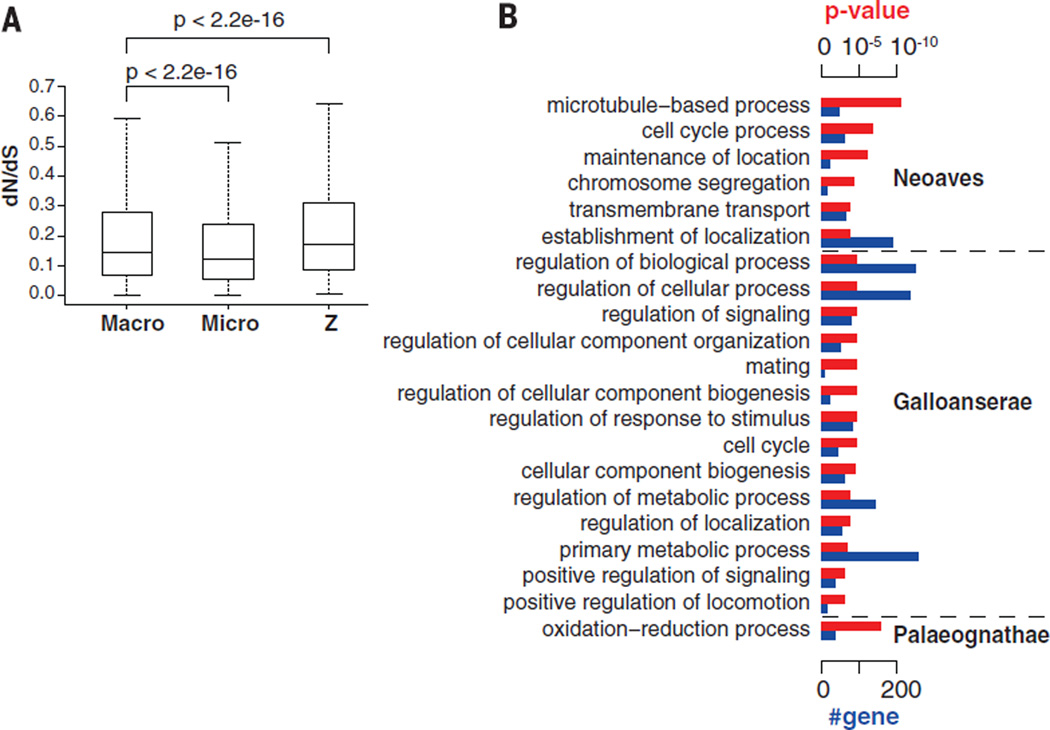
Fig. 4. Selection constraints on genes.
(A) Box plot for the distribution of dN/dS values of genes on avian macrochromosomes, microchromosomes, and the Z chromosome. P values were calculated with Wilcoxon rank sum tests. (B) GO categories in Neoaves, Galloanserae, and Palaeognathae showing clade-specific rapid evolutionary rates. Red bars, P value of significance; blue bars, number of genes in each GO.

