

Abstract
The Primo-SHM trial, a multicenter randomized trial comparing no treatment with 24 or 60 weeks of combination antiretroviral therapy (cART) during primary human immunodeficiency virus (HIV) infection (PHI), recently demonstrated that temporary early cART lowered the viral set point and deferred the need for re-initiation of cART during chronic HIV infection. This study examined whether the beneficial effect of early treatment was caused by preservation of immunological responses. Twenty-seven treated and 20 untreated PHI individuals participating in the Primo-SHM trial were compared at viral set point, that is, 36 weeks after baseline or after treatment interruption, respectively, for a diverse set of immunological parameters. The results show no differences between treated and untreated individuals at the level of effector T-cell formation or replication capacity of the T-cells; regulation of various T, B, natural killer, or dendritic cells; polyfunctionality of the CD8 T-cells; preservation of CD4 T-cells in the gut associated lymphoid tissue; or immune activation. There were subtle differences in the quality of the cytolytic CD4 T-cell response: 11% (median) of CD4 T-cells of the early treated individuals produced the cytolytic molecule perforin compared to 5% in untreated individuals (p=0.046), and treatment caused a modest increase in CD4 T-cells expressing both perforin and granzyme B (median 9% vs. 4% of CD4 T-cells; p=0.045). Early treatment had a modest positive effect on the quality of the CD4 T-cell response. It remains unclear, however, whether these subtle immunological differences were the cause or a result of the lower viral set point in patients who received early treatment.
Introduction
In Human immunodeficiency virus (HIV) infection, a low viral set point and low levels of immune activation correlate with slower disease progression (10,21). The Primo-SHM trial, a multicenter randomized study comparing no treatment with 24 or 60 weeks of combination antiretroviral therapy (cART) during primary HIV infection (PHI), recently demonstrated that temporary early cART transiently lowered the viral set point and deferred the need for re-initiation of cART during chronic HIV infection (13). Factors such as baseline CD4 T-cell count, stage of PHI, and HLA background could not explain the differences observed in viral set point (13,31).
There are many immunological parameters that play a role in controlling HIV disease progression. Foremost, there is compelling evidence that (gag-specific) CTL responses correlate with HIV viral load and the rate of HIV-disease progression (1–3,18,19,22,25,29,30). Current consensus in the field is that such a “protective” T-cell response in HIV infection is comprised of two elements: effective cytolytic killing and production of multiple cytokines. Recent work from Soghoian et al. highlights the importance of vigorous cytolytic activity by HIV-specific CD4 T-cells in controlling disease progression (30). The presence during PHI of HIV-specific CD4 T-cells, which are able to express both perforin and high levels of granzyme A, was found to be highly predictive of slower disease progression and good clinical outcome. Likewise, HIV nonprogressors preferentially maintain more polyfunctional HIV-specific T-cells, that is, T-cells with the capacity to secrete multiple cytokines and chemokines upon antigenic stimulation (2). Almeida et al. demonstrated that superior control of HIV infection by CD8 T-cells was reflected by a polyfunctional and high avidity phenotype (1).
The effectivity of HIV-specific immune responses can be severely limited during disease progression, as persistent viremia has deleterious effects on HIV-specific CD4 and CD8 T-cell immunity (22). For instance, chronic antigen exposure leads to a terminally differentiated phenotype of the CD4 and CD8 T-cells, with upregulated CD57 expression and a diminished functional proliferative capacity (4). Also, HIV viremia prevents the establishment of highly functional memory CD4 T-cells that retain the capacity to proliferate upon antigen stimulation (15,20). Finally, chronic antigenic stimulation induces upregulation of inhibitory receptors, most notably PD-1 and CTLA-4, which may interfere with HIV-specific T-cell responses and ultimately leads to T-cell anergy and loss of HIV-specific T-cells (9,17).
One of the earliest effects of HIV infection is a massive depletion of central memory CD4 T-cells from the gut-associated lymphoid tissue (GALT) (14). The instant and massive early injury to the gut immune system, together with the subsequent damage exacted to the gut epithelial cells, is thought to induce gut permeability and the translocation of microbial products such as lipopolysaccharides (LPS). This is thought to contribute to systemic immune activation, which characterizes HIV infection (5). It is widely accepted that chronic immune activation drives progression to acquired immune deficiency syndrome (AIDS) (10,12,16,35). In fact, immune activation is more strongly associated with the rate of CD4 T-cell loss in HIV-infected individuals than with viral load (10).
It is hypothesized here, as well as by others, that viral suppression in PHI might prevent the excessive depletion of the GALT, thereby reducing the level of immune activation and delaying the CD4 T-cell loss. Depletion of CD4 T-cells in the GALT can be assessed indirectly in the blood by measuring the level of α4β7 expression on T-cells. Indeed, in primary simian immunodeficiency virus (SIV) infection, the reduction of α4β7high CD4 T-cells in the peripheral blood was shown to parallel the reduction of CD4 T-cells in intestinal tract biopsies (26,34). Likewise, the finding that α4β7high CD4 T-cells are preferentially depleted in the blood in untreated PHI (8) likely reflects the depletion of CD4 T-cells from the GALT.
To determine the cause of the lower viral set point in individuals treated during PHI, this study evaluated whether (a) effector T-cell formation, (b) effectivity of the T-cell response (in terms of cytolytic function and polyfunctionality), and (c) inhibitory receptor expression on immune cells were altered in individuals treated during PHI compared with untreated PHI individuals. To investigate whether viral suppression in PHI caused preservation of CD4 T-cells in the GALT, this study evaluated whether expression of the gut homing receptor α4β7 on CD4 T-cells from the blood was altered in individuals treated during PHI. Finally, the study assessed whether early treatment contributed to delayed disease progression by preventing excessive systemic T-cell activation.
Materials and Methods
Study population
Blood samples were obtained from participants of the Primo-SHM trial. The Primo-SHM trial was a multicenter, open-label, randomized controlled trial comparing temporary early cART (for 24 or 60 weeks) with no treatment. Detailed procedures have been described elsewhere (2). Briefly, inclusion criteria were older than 18 years of age and laboratory evidence of PHI, defined as a negative or indeterminate Western blot in combination with detectable plasma HIV-1 RNA (Fiebig stage I–IV) or, in case of a positive Western blot, a documented negative HIV screening test in the previous 180 days (Fiebig stage V–VI) (21).
Twenty untreated and 27 treated PHI individuals were selected based on sample availability. Patients treated for both 24 and 60 weeks were included. Immunological parameters were measured at inclusion (baseline) and “viral set point,” defined as the plasma viral load 36 weeks after baseline or treatment interruption (TI), respectively (see Fig. 1). In addition, blood samples of 18 healthy donors were obtained through the UMC Utrecht. For the studies of both patients and healthy donors, approval was obtained from the Medical Ethics Committee of each participating site, and written informed consent was obtained from all participants.
FIG. 1.
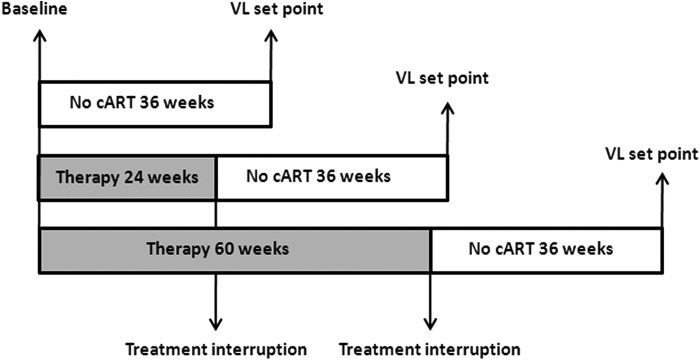
Schematic overview of timeline. All immunological parameters were measured at the time of patient inclusion and randomization (baseline) and/or 36 weeks after inclusion or treatment interruption (viral load [VL] set point).
T-cell activation and phenotype
Expression of activation markers on CD4 and CD8 T-cells was measured after staining of the cells with anti-CD4-PB, anti-CD8-Amcyan, anti-CD38-PE, and anti-HLA-DR-APC monoclonal antibodies (BD Biosciences). The phenotype of the cells was determined using anti-CD27-APC-Cy7 (Biolegend) and anti-CD45RO-PECy7 (BD Biosciences). In the same sample, cells were also stained with anti-PD-1-PerCPcy5.5. All incubations were performed at 4°C (20 min) after which cells were fixed in cellfix (BD Biosciences) and analyzed with the LSRII flow cytometer.
Ex vivo T-cell function
Ex vivo surface staining was performed with anti-CD3-eFluor450 (eBioscience), anti-CD8-V500, anti-α4β7-APC, anti-CD57-FITC, anti-CD45RO-PE-Cy7 (all BD), and anti-CD27-APC-Cy7 (Biolegend) monoclonal antibodies After fixation and permeabilization (permeabilization reagents; BD Biosciences) for 10 min, cells were stained for cytotoxic molecules with antigranzyme A-Pe or antigranzyme B-Pe (Sanquin) and antiperforin-PerCP-Cy5.5. Hereafter, cells were fixed in cellfix (BD Biosciences), and flow cytometry was performed.
CD8 T-cell stimulation and intracellular cytokine staining
Cryopreserved peripheral blood mononuclear cells were thawed and aliquoted at 2×10⁶ cells/mL in round-bottom tubes (Becton Dickinson). CD8 T-lymphocytes were stimulated for 6 h with a gag-peptide pool (15mers with 11 overlap, final concentration of the individual peptides was 2 μg/mL, Consensus B 2007, NIH AIDS Research and Reagent program). As a positive control, PMA and ionomycin (Sigma-Aldrich; 5 ng/mL and 1 μg/mL respectively) were used. After 1.5 h, Brefeldin A (3 μM; Sigma-Aldrich) was added. Surface staining was performed with anti-CD3-PerCP, anti-CD8-V500, anti-α4β7-APC (all BD Biosciences), and anti-CD27-APC-Cy7 (Biolegend) monoclonal antibodies for 20 min at 4°C. After fixation and permeabilization (permeabilization reagents; BD) for 10 min, cells were stained with anti-IFN-γ-Pe-Cy7 (eBioscience), anti-TNF-α-FITC, anti-MIP1-β-PE, and anti-IL-2-PB (BD Biosciences) for 20 min at 4°C. Cells were fixed in cellfix (BD Biosciences), and flow cytometry was performed.
Characterization of inhibitory markers
Expression of inhibitory markers was assessed on CD4 and CD8 T-cells, B-cells, natural killer (NK) cells, and dendritic cells. Surface staining was performed for CD4 and CD8 T-cells (anti-CD3-eFluor450, eBioscience; antiCD8-V500, BD Biosciences), B-cells (anti-CD19-PerCP, BD Biosciences), NK cells (anti-CD56-APC, BD Biosciences), and cells (anti-HLA-DR-APC-Cy7, BD Biosciences; anti-CD11c-PE-Cy7, BD Biosciences). These sets were completed with either anti-CD31-PE (BD Biosciences)/3D3 anti-sirl-FITC or anti-LAIR-PE/anti-ILT4-FITC or anti-IREM-1-PE/anti-KLRG-1-FITC or isotype controls. After staining for 20 min at 4°C, cells were fixed in cellfix (BD Biosciences), and flow cytometry was performed.
Flow cytometry analysis
At least 100,000 events were acquired after phenotypical staining, and at least 300,000 events were acquired after intracellular cytokine staining, using the LSRII flow cytometer (BD Biosciences). Data were analyzed using the DIVA software (BD Biosciences). The events were gated for either lymphocytes or monocytes in a FSC-A versus SSC plot. Following this, events were gated using the markers described above. T-cell polyfunctionality was analyzed by Flowjo software (v9.2). After determining the lymphocyte gate in a FSC-A versus SSC plot, cells were sequentially gated for CD3 and CD8. Subsequently, within the CD8 T-cell population, a gate was created for the four respective functions: IFN-γ, TNF-α, MIP1-β, and IL-2. Herein, a Boolean gating was performed, resulting in 20 different combinations. All data were background-subtracted using the unstimulated samples.
Statistical analysis
Differences between treated and untreated individuals and between healthy donors and patients were analyzed using the Mann–Whitney U-test because a normal distribution of the data could not be assumed. Whenever more than two groups were compared, the Kruskal–Wallis test was used. All statistical analyses were performed using the software program SPSS Statistics for Windows v19.0 (IBM Corp.).
Results
Patient characteristics
In the patients selected for the present study, the median viral loads of treated and untreated patients were not significantly different at baseline (for all patient characteristics, see Table 1). Comparable with the complete study group (13), at set point, the pVL was significantly lower in patients who were treated during PHI: median 4.2 versus 5.0 10log copies/mL for treated and untreated individuals, respectively (p=0.002). CD4 and CD8 T-cell counts at viral set point also resembled those of the patients in the complete Primo-SHM trial (13). CD8 T-cell counts were not significantly different between treated and untreated individuals, both at baseline and at viral set point. CD4 numbers were comparable at baseline (p=0.26), but at viral set point, median CD4 T-cell counts were significantly higher in treated than in untreated patients (630 [range 110–1,280] vs. 430 [180–940] CD4 T-cells/mm3; p=0.03).
Table 1.
Patient Characteristics
| Treateda(n=27) | Not treated (n=20) | p-Value | |
|---|---|---|---|
| Patient characteristics at baseline | |||
| Age (years), median (range) | 41 (30–59) | 41 (25–55) | 0.39 |
| Male | 25 (92%) | 20 (100%) | 0.22 |
| MSM | 21 (78%) | 17 (85%) | 0.76 |
| Caucasian | 23 (85%) | 18 (90%) | 0.63 |
| Stage of PHI | |||
| Fiebig I–IV | 21 (78%) | 17 (85%) | 0.54 |
| Fiebig V–VI | 6 (22%) | 3 (15%) | |
| CD4 cell count (cells/mm3), median (range) | 570 (150–1,050) | 520 (200–1,110) | 0.26 |
| CD8 cell count (cells/mm3), median (range) | 1129 (260–2,570) | 1057 (160–2,740) | 0.98 |
| Plasma HIV-1 RNA (log10 copies/ml), median (range) | 4.8 (1.7–6.7) | 5.4 (1.8–6.5) | 0.42 |
| Patient characteristics at viral set point | |||
| CD4 cell count (cells/mm3), median (range) | 630 (110–1,280) | 430 (180–940) | 0.03 |
| CD8 cell count (cells/mm3), median (range) | 860 (380–2,220) | 860 (310–2,540) | 0.29 |
| Plasma HIV-1 RNA (log10 copies/ml), median (range) | 4.2 (1.8–5.5) | 5.0 (3.0–5.4) | 0.002 |
Numbers are n (%), unless otherwise indicated.
Treatment consists of either 24 or 60 weeks of combination antiretroviral therapy.
MSM, men who have sex with men; PHI, primary human immunodeficiency virus (HIV) infection; HIV, human immunodeficiency virus.
No change in T-cell subsets by early treatment
To investigate a possible immunological cause of the lower viral set points in individuals treated during PHI, this study examined whether T-cells of treated individuals had a different maturation state and/or a less exhausted phenotype, with a resulting more effective immune response at viral set point. The level of terminal differentiation (based on the expression of CD45RO and CD27) and replicative senescence (based on the marker CD57) of the CD4 and CD8 T-cells of treated and untreated individuals was analyzed at viral set point (Fig. 2). It was found that irrespective of early treatment, CD4 T-cells of HIV-infected individuals had a more terminally differentiated phenotype (CD45RO–CD27–) and increased replicative senescence (CD57+) than healthy volunteers (p=0.0002 and p<0.0001, respectively). The level of senescence of CD8 T-cells was also higher in HIV-infected individuals compared to healthy volunteers (p=0.008). However, no differences could be observed between treated and untreated PHI individuals.
FIG. 2.

No change in T-cell subsets after early treatment. Markers of maturation (CD45RO–CD27–) and senescence (CD57+) on CD4 (A) and CD8 T-cells (B) are shown for treated (T, n=25, square), untreated (UT, n=13 for terminally differentiated and n=8 for senescent T-cells respectively, open circle), and healthy donor (HD, n=12, triangle). Dots represent individuals, with a bar at the median. **p=0.01–0.001; ***p<0.001.
To reveal whether HIV-specific cells displayed differences in replicative capacity between treated and untreated patients, an in vitro proliferation assay was performed. Cells were stimulated with an overlapping gag-peptide pool, and after 6 days the stimulation index was determined. Early treatment had no effect on the gag-specific proliferative capacity of either CD4 or CD8 T-cells (data not shown).
Ex vivo CD4 cytolytic T-cell activity is enhanced by early treatment
To assess the direct ex vivo cytolytic functionality of T-cells from treated and untreated patients, the levels of granzyme A, granzyme B, and perforin expression of total CD4 and CD8 T-cells were measured at viral set point. The percentage of CD4 and CD8 T-cells expressing granzyme A, perforin, and/or granzyme B was elevated in both treated and untreated HIV-infected individuals compared to healthy individuals (Fig. 3). At viral set point, early treated individuals showed an increased level of CD4 T-cells expressing perforin compared to untreated individuals (median of 11% vs. 5% of CD4 T-cells; p=0.045). In addition, treatment caused a modest increase of CD4 T-cells expressing both perforin and granzyme B (median of 9% vs. 4% of CD4 T-cells; p=0.045).
FIG. 3.

Ex vivo cytolytic T-cell activity is not enhanced at viral set point after treatment. The ex vivo effector functions of CD4 (A) and CD8 T-cells (B) in terms of granzyme A, granzyme B, and perforin production in treated (n=5, square), untreated (n=8, open circle), and healthy (n=6, triangle) individuals was assessed. Individual production of granzyme B by CD4 and CD8 T-cells was assessed in a larger group of individuals (n=10, 14, and 18 for T, UT, and HD, respectively). Dots represent individuals, with a bar at the median. *p=0.05–0.01; **p=0.01–0.001; ***p=0.001–0.0001; ****p<0.0001.
Treatment does not preserve a more polyfunctional T-cell response
Another measure for an effective T-cell response is its polyfunctionality. A stimulation assay was performed with an overlapping gag-peptide pool (Fig. 4), and the study measured which proportion of CD4 and CD8 T-cells produced one or more of the cytokines TNF-α, MIP1β, IFN-γ and IL-2. No differences were observed between treated and untreated PHI individuals at viral set point in the total amount of CD8 T-cells that produced these cytokines/chemokines in response to HIV gag (median 1.0% vs. 0.7% of CD8 T-cells, respectively; p=0.74, data not shown). The CD4 T-cell response to stimulation was either absent or too low to interpret. When the functional profiles of the CD8 T-cell responses were compared by expressing each functional component as a proportion of the total response (2), it was found that treated individuals did not exhibit a more polyfunctional response than untreated PHI individuals (Fig. 4A). In treated individuals, a median of 24% of the gag-specific CD8 T-cells displayed more than one function compared to 13% of CD8 T-cells in the untreated individuals (p=0.59). Likewise, no significant differences could be found in the type of cytokine that was produced by the CD8 T-cells in response to gag-antigen. For instance, in untreated individuals IFN-γ production by HIV-specific CD8 T-cells made up approximately 21% of the total response, while its median contribution did not exceed 17% in treated individuals (p=0.72; Fig. 4B).
FIG. 4.

Preservation of a more polyfunctional T-cell response due to treatment. PHI individuals with treatment (n=10) and no treatment (n=8) were compared. The pie charts depict the relative contribution of the number of functions, that is, cytokines/chemokines secreted, which are produced by CD8+T-cells in response to HIV gag (A). The graphs zoom in on the relative contribution of the cytokine (MIP1β, INF-γ, TNF-α, and IL-2) combinations to the total CD8 T-cell response (B). The bars represent the frequency of the CD8 T-cell response expressing the particular combination of functions shown. Each dot indicates MIP1β, INF-γ, TNF-α, and/or IL-2 positivity. In all graphs, medians (with range) are shown, and the number of functions (1 function=white; 2 functions=gray; 3 functions=dark gray; 4 functions=black) are depicted.
No changes in expression of regulatory and inhibitory molecules after early treatment
Markers of regulation of the immune response were analyzed, and a panel of “well-recognized” but also recently characterized and largely unexplored inhibitory receptors (33) was selected. Their level of expression on CD4 and CD8 T-cells, B-cells, NK cells, and dendritic cells at viral set point was analyzed (see Supplementary Fig. S1 for gating strategy; Supplementary Data are available online at www.liebertpub.com/vim).
Pecam-1 (CD31), which is known to inhibit apoptosis (11), was expressed less in HIV-infected individuals compared to healthy controls in all measured cell types (Fig. 5 and Supplementary Fig. S2 first panel). Similarly, in (most) HIV-infected individuals, a distinct downregulation of LAIR-1 (known to inhibit cytolytic function) was seen on T-, B-, and dendritic cells (Fig. 5 and Supplementary Fig. S2 second panel). KLRG-1, an NK cell inhibitor, was increased on CD4 T-cells in HIV-infected individuals, reflecting an exhausted phenotype (Fig. 5 and Supplementary Fig. S2 third panel). On dendritic cells, no difference was seen in the expression of ILT4, a molecule that inhibits CTL function (Fig. 5 and Supplementary Fig. S2 fourth panel). Finally, IREM-1, which inhibits TLR signaling in dendritic cells (Fig. 5 and Supplementary Fig. S2 fifth panel), was the only receptor that showed a significant effect of early treatment. However, instead of mirroring the healthy controls, the expression of this receptor was decreased even more in treated compared to untreated individuals (median 78% vs. 88% of dendritic cells positive for IREM-1, respectively). The significance of this finding was lost after correcting for multiple testing. Also the level of PD-1 expression did not differ between patients who did and those who did not receive treatment during PHI (p=0.30, data not shown).
FIG. 5.

No changes in regulatory and inhibitory molecules after early treatment. To assess the level of inhibitory receptor expression, the % (y-axis) of inhibitory receptors on CD4 T-cells, CD8 T-cells, B-cells, natural killer (NK) cells, and dendritic cells was determined. The parameters were compared between healthy individuals (HD, n=13, black), treated individuals (T, n=8, dark gray), and untreated individuals (UT, n=10, white). Bars represent the median with range. *p=0.01–0.05; **p=0.01–0.001; ***p<0.001.
No effect on GALT T-cell depletion and T-cell activation after early treatment
To study whether treatment in PHI could overcome the rapid depletion of T-cells from the GALT that is typically observed in untreated HIV infection, the level of expression of the gut homing receptor α4β7 on CD4 and CD8 T-cells of treated and untreated individuals was evaluated at viral set point (Fig. 6A and B). Both treated and untreated HIV-infected individuals exhibited a marked decrease in the levels of α4β7high cells in the naive CD4 T-cell compartment compared to healthy controls. Also, in the effector CD4 T-cell compartment, the percentage of α4β7 expression was lower in the treated HIV-infected individuals. Despite the lower viral set point in patients treated during PHI, there were no significant differences between treated and untreated individuals in the levels of α4β7high cells, suggesting that treatment did not lead to the preservation of α4β7high CD4 T-cells. In contrast, no significant differences were found between HIV-infected individuals and healthy donors in α4β7 expression on CD8 T-cells.
FIG. 6.

No differences in gut homing marker expression between treated and untreated patients. The expression of gut homing marker a4b7 within the T-cell compartments (naïve, central memory, effector memory, and effector) on CD4 T-cells (A) and CD8 T-cells (B) is depicted. The mean fluorescent intensity of a4b7 was compared for treated (T, n=8, light gray), untreated (UT, n=10, dark gray), and healthy (HD, n=12, black) individuals. Bars represent the median with range.*p=0.05–0.01; **p=0.01–0.001.
Because immune activation levels are known to be even more predictive of the rate of disease progression than plasma viral load, the study analyzed whether early treatment affected the overall level of immune activation by measuring CD38 and HLA-DR expression on T-cells. No differences were found between treated and untreated individuals in the expression of CD38 and HLA-DR on CD4 or CD8 T-cells at viral set point (data not shown).
Discussion
This study investigated whether the reported beneficial effect of treatment during PHI (13) was caused by preservation of immunological responses, and whether early treatment could overcome the rapid depletion of CD4 T-cells from the GALT, and its immune activating effect. The data suggest that treatment during PHI does not induce differences at the level of (a) effector T-cell formation or replication capacity of the T-cells; (b) polyfunctionality of HIV-specific CD8 T-cells; (c) expression of inhibitory receptors (Pecam-1, LAIR, ILT4, IREM-1, KLRG-1) on CD4 and CD8 T-cells, B-cells, NK cells, and dendritic cells; (d) preservation of CD4 T-cells in the GALT; and (e) immune activation. A modestly higher cytolytic capacity of CD4 T-cells was observed in patients at viral set point receiving early treatment.
The observation that early treatment did not decrease the level of senescence of the effector T-cells at viral set point is quite surprising, as previously chronic antigen exposure was shown to lead to a terminally differentiated phenotype of CD4 and CD8 T-cells, with a diminished functional proliferative capacity (4). In addition, after correction for multiple testing, also inhibitory receptor expression levels on immune cells were not significantly altered in treated compared to untreated individuals. Formally, the possibility cannot be excluded that the immune parameters that were measured were initially preserved by early treatment but regained the features of a disrupted immune response rapidly after TI.
Along the same line, the data suggest that treatment in PHI individuals did not preserve the quality of HIV-specific CD8 T-cell responses in terms of their cytokine polyfunctionality. So far, not one single function of HIV-specific T-cells has been proven to correlate with control of HIV infection (23). The current consensus is that the more HIV-specific functions a CD8 T-cell performs, the more protective it is. Indeed, HIV-specific CD8 T-cells of long-term nonprogressors have been shown to be more prone to perform five functions (IL-2, IFN-γ, TNF-α, MIP-1β, and CD107a) simultaneously than HIV progressors (2). However, neither the separate functions nor the combined functions of CD8 T-cells were better preserved in individuals treated during PHI.
Finally, early treatment had no effect on preservation of CD4 T-cells in the GALT. As there is an acute and severe depletion of CD4 T-cells in the GALT in PHI, it was hypothesized that treatment during PHI would prevent this. All individuals in the Primo-SHM trial were recruited early after infection, at least within 100 days of HIV infection and 73% of the individuals even within 30 days. However, previous work in SIV infection has shown that severe depletion of CD4 T-cells in the GALT was seen within days and not weeks (32). Therefore, it is possible that in the present study population, depletion may already have occurred before the start of treatment, which could explain why no differences were seen between treated and untreated PHI.
Jointly, gut permeability with subsequent translocation of microbial products such as LPS and HIV itself are thought to be responsible for systemic immune activation in untreated HIV infection (16). Indeed, immune activation has been shown to be an even stronger predictor of disease progression than viral load. Thus, it was hypothesized that the delayed re-initiation of cART, as was seen in the Primo-SHM trial (13), might be caused by a diminished level of immune activation. However, neither the CD4 nor CD8 T-cell activation was diminished 36 weeks after TI in the study population.
The only significant effect of early treatment that was identified was a slightly higher cytolytic functionality of CD4 T-cells in early treated individuals. In the existing literature, increased granzyme A production after HIV-specific stimulation was shown to be predictive of better clinical outcome (30). Moreover, the cytolytic response is thought to be more antiviral when producing a combination of various granzymes and perforin against HIV gag (30). In addition, proliferated HIV-specific CD8 T-cells, but not CD4 T-cells of long-term nonprogressors, have previously been shown to be more prone to produce perforin in comparison with CD8 T-cells of progressors (22). In contrast, elevated levels of perforin and granzyme B expression were found in the CD4 but not in the CD8 T-cell pool. Though not completely in line with existing data, similarly the present findings hint at the importance of highly functional cytotoxic CD4 T-cells.
While a modest impact of treatment in PHI was found, recently other groups have found far more profound differences in immunological results after early treatment (6,28). There are two possible explanations. First, it might be the timing of the treatment during PHI. Paci et al. showed that the progression of HIV markers corresponded to the timing—that is, Fiebig's stage—whereat the treatment was initiated (23,24). Second, early treatment that persists over a longer period of time has been shown to be more effective (6,28). In the VISCONTI trial, around 15% of individuals treated during PHI maintained viral control 12 months after TI. These individuals had been treated for a median of 36 months. It has been shown that immunological characteristics of predominantly CD4 and CD8 T-cells are markedly improved after prolonged periods of treatment initiated during PHI (7,27). Therefore, even though a 24–60-week treatment period during PHI caused a one log decrease in viral load at viral load set point in the PRIMO-SHM trial, the effect was too modest to find more than moderate effects on the immune functions.
To broaden even further the scope of the innate and adaptive immune mechanism explored here, it would be fascinating to elucidate the effect of early treatment on cellular factors such as APOBEC3G, TRIM5α, and tetherin, which also play an important role in the restriction of HIV-1. Another question that should be addressed in further research is whether the observed preservation of the cytotoxic capabilities of the CD4 T-cells after early treatment is the cause of a lower viral load set point in these individuals, or whether a lower viral load allows for the preservation of the cytotoxic capabilities of the CD4 T-cells.
In conclusion, these results show that early treatment during PHI has a limited impact on the immunological parameters measured. The observation that early treated individuals had CD4 T-cells with modestly higher cytolytic capabilities may be a result of the reduced viral load rather than the cause of the lower viral set point.
Supplementary Material
Acknowledgments
This work was financially supported by Aids Fonds Netherlands (grant 2010031). The Amsterdam Cohort Studies on HIV infection and AIDS—a collaboration between the Amsterdam Health Service, the Academic Medical Center of the University of Amsterdam, Sanquin Blood Supply Foundation, the University Medical Center Utrecht, and the Jan van Goyen Clinic, Amsterdam—are part of the Netherlands HIV Monitoring Foundation, and are financially supported by the Center for Infectious Disease Control of the Netherlands National Institute for Public Health and the Environment.
The Primo-SHM study has been made possible through the collaborative efforts of the Primo-SHM study group (asterisks indicate site coordination physicians): Academic Medical Center, Amsterdam: J. M. Prins,* J. M. A. Lange, M. L. Grijsen, R. Steingrover, J. N. Vermeulen, M. Nievaard, B. Slegtenhorst, H. Doevelaar, W. Koevoets, H. E. Nobel, A. Henderiks, F. J. J. Pijnappel; Erasmus Medical Center, Rotterdam: M. E. van der Ende,* B. J. A. Rijnders, A. Verbon, I. Padmos, L. van Zonneveld, S. Been; HagaZiekenhuis, Locatie Leyenburg, Den Haag: R. H. Kauffmann,* E. F. Schippers, R. Korte, J. M. van Ijperen; Kennemer Gasthuis, Haarlem: R. W. ten Kate,* R. Soetekouw, N. Hulshoff, M. Schoemaker-Ransijn; Leids Universitair Medisch Centrum, Leiden: F. P. Kroon,* W. Dorama, C. A. M. Moons; Maastricht University Medical Center, Maastricht: S. H. Lowe,* G. Schreij, S. van der Geest, A. M. Oude Lashof, J. Schippers; Medisch Centrum Alkmaar, Alkmaar: W. Bronsveld,* G. van Twillert; Medisch Centrum Leeuwarden, Leeuwarden: D. van Houte,* M. G. A. van Vonderen, S. Faber, S. Rotteveel; Medisch Spectrum Twente, Enschede: C. H. H. ten Napel,* G. J. Kootstra, H. Heins; Onze Lieve Vrouwe Gasthuis, Amsterdam: K. Brinkman,* G. E. L. van den Berk, W. L. Blok, P. H. J. Frissen, W. E. M. Schouten, L. Schrijnders; St. Medisch Centrum Jan van Goyen, Amsterdam: A. van Eeden,* D. W. M. Verhagen, M. Groot, W. Brokking; Slotervaart Ziekenhuis, Amsterdam: J. W. Mulder*; St. Elisabeth Ziekenhuis, Tilburg: M. E. E. van Kasteren,* J. R. Juttmann, M. Kuipers; St. Lucas Andreas Ziekenhuis, Amsterdam: J. Veenstra,* K. D. Lettinga; Universitair Medisch Centrum St. Radboud, Nijmegen: P. P. Koopmans,* M. Bosch; Universitair Medisch Centrum Utrecht, Utrecht: I. M. Hoepelman,* T. Mudrikova, I. de Kroon. The authors wish to thank the study participants for helping to establish the Primo-SHM cohort.
Author Disclosure Statement
No competing financial interests exist.
References
- 1.Almeida JR, Price DA, Papagno L, et al. Superior control of HIV-1 replication by CD8+ T cells is reflected by their avidity, polyfunctionality, and clonal turnover. J Exp Med 2007;204:2473–2485 [DOI] [PMC free article] [PubMed] [Google Scholar]
- 2.Betts MR, Nason MC, West SM, et al. HIV nonprogressors preferentially maintain highly functional HIV-specific CD8+ T cells. Blood 2006;107:4781–4789 [DOI] [PMC free article] [PubMed] [Google Scholar]
- 3.Borrow P, Lewicki H, Hahn BH, et al. Virus-specific CD8+ cytotoxic T-lymphocyte activity associated with control of viremia in primary human immunodeficiency virus type 1 infection. J Virol 1994;68:6103–6110 [DOI] [PMC free article] [PubMed] [Google Scholar]
- 4.Brenchley JM, Karandikar NJ, Betts MR, et al. Expression of CD57 defines replicative senescence and antigen-induced apoptotic death of CD8+ T cells. Blood 2003;101:2711–2720 [DOI] [PubMed] [Google Scholar]
- 5.Brenchley JM, Price DA, Schacker TW, et al. Microbial translocation is a cause of systemic immune activation in chronic HIV infection. Nat Med 2006;12:1365–1371 [DOI] [PubMed] [Google Scholar]
- 6.Buzon MJ, Martin-Gayo E, Pereyra F, et al. Long-term antiretroviral treatment initiated at primary HIV-1 infection affects the size, composition, and decay kinetics of the reservoir of HIV-1-infected CD4 T cells. J Virol 2014;88:10056–10065 [DOI] [PMC free article] [PubMed] [Google Scholar]
- 7.Cellerai C, Harari A, Stauss H, et al. Early and prolonged antiretroviral therapy is associated with an HIV-1-specific T-cell profile comparable to that of long-term non-progressors. PloS One 2011;6:e18164. [DOI] [PMC free article] [PubMed] [Google Scholar]
- 8.Cicala C, Martinelli E, McNally JP, et al. The integrin alpha4beta7 forms a complex with cell-surface CD4 and defines a T-cell subset that is highly susceptible to infection by HIV-1. Proc Natl Acad Sci U S A 2009;106:20877–20882 [DOI] [PMC free article] [PubMed] [Google Scholar]
- 9.Day CL, Kaufmann DE, Kiepiela P, et al. PD-1 expression on HIV-specific T cells is associated with T-cell exhaustion and disease progression. Nature 2006;443:350–354 [DOI] [PubMed] [Google Scholar]
- 10.Deeks SG, Kitchen CM, Liu L, et al. Immune activation set point during early HIV infection predicts subsequent CD4+ T-cell changes independent of viral load. Blood 2004;104:942–947 [DOI] [PubMed] [Google Scholar]
- 11.Gao C, Sun W, Christofidou-Solomidou M, et al. PECAM-1 functions as a specific and potent inhibitor of mitochondrial-dependent apoptosis. Blood 2003;102:169–179 [DOI] [PubMed] [Google Scholar]
- 12.Giorgi JV, Hultin LE, McKeating JA, et al. Shorter survival in advanced human immunodeficiency virus type 1 infection is more closely associated with T lymphocyte activation than with plasma virus burden or virus chemokine coreceptor usage. J Infect Dis 1999;179:859–870 [DOI] [PubMed] [Google Scholar]
- 13.Grijsen ML, Steingrover R, Wit FW, et al. No treatment versus 24 or 60 weeks of antiretroviral treatment during primary HIV infection: the randomized Primo-SHM trial. PLoS Med 2012;9:e1001196. [DOI] [PMC free article] [PubMed] [Google Scholar]
- 14.Guadalupe M, Reay E, Sankaran S, et al. Severe CD4+ T-cell depletion in gut lymphoid tissue during primary human immunodeficiency virus type 1 infection and substantial delay in restoration following highly active antiretroviral therapy. J Virol 2003;77:11708–11717 [DOI] [PMC free article] [PubMed] [Google Scholar]
- 15.Harari A, Vallelian F, Meylan PR, et al. Functional heterogeneity of memory CD4 T cell responses in different conditions of antigen exposure and persistence. J Immunol 2005;174:1037–1045 [DOI] [PubMed] [Google Scholar]
- 16.Hazenberg MD, Otto SA, van Benthem BH, et al. Persistent immune activation in HIV-1 infection is associated with progression to AIDS. Aids 2003;17:1881–1888 [DOI] [PubMed] [Google Scholar]
- 17.Kaufmann DE, Kavanagh DG, Pereyra F, et al. Upregulation of CTLA-4 by HIV-specific CD4+ T cells correlates with disease progression and defines a reversible immune dysfunction. Nat Immunol 2007;8:1246–1254 [DOI] [PubMed] [Google Scholar]
- 18.Kiepiela P, Ngumbela K, Thobakgale C, et al. CD8+ T-cell responses to different HIV proteins have discordant associations with viral load. Nat Med 2007;13:46–53 [DOI] [PubMed] [Google Scholar]
- 19.Koup RA, Safrit JT, Cao Y, et al. Temporal association of cellular immune responses with the initial control of viremia in primary human immunodeficiency virus type 1 syndrome. J Virol 1994;68:4650–4655 [DOI] [PMC free article] [PubMed] [Google Scholar]
- 20.McNeil AC, Shupert WL, Iyasere CA, et al. High-level HIV-1 viremia suppresses viral antigen-specific CD4(+) T cell proliferation. Proc Natl Acad Sci U S A 2001;98:13878–13883 [DOI] [PMC free article] [PubMed] [Google Scholar]
- 21.Mellors JW, Rinaldo CR, Jr, Gupta P, et al. Prognosis in HIV-1 infection predicted by the quantity of virus in plasma. Science 1996;272:1167–1170 [DOI] [PubMed] [Google Scholar]
- 22.Migueles SA, Laborico AC, Shupert WL, et al. HIV-specific CD8+ T cell proliferation is coupled to perforin expression and is maintained in nonprogressors. Nat Immunol 2002;3:1061–1068 [DOI] [PubMed] [Google Scholar]
- 23.Paci P, Carello R, Bernaschi M, et al. Immune control of HIV-1 infection after therapy interruption: immediate versus deferred antiretroviral therapy. BMC Infect Dis 2009;9:172. [DOI] [PMC free article] [PubMed] [Google Scholar]
- 24.Paci P, Martini F, Bernaschi M, et al. Timely HAART initiation may pave the way for a better viral control. BMC Infect Dis 2011;11:56. [DOI] [PMC free article] [PubMed] [Google Scholar]
- 25.Pereyra F, Jia X, McLaren PJ, et al. The major genetic determinants of HIV-1 control affect HLA class I peptide presentation. Science 2010;330:1551–1557 [DOI] [PMC free article] [PubMed] [Google Scholar]
- 26.Quiding-Jarbrink M, Ahlstedt I, Lindholm C, et al. Homing commitment of lymphocytes activated in the human gastric and intestinal mucosa. Gut 2001;49:519–525 [DOI] [PMC free article] [PubMed] [Google Scholar]
- 27.Rehr M, Cahenzli J, Haas A, et al. Emergence of polyfunctional CD8+ T cells after prolonged suppression of human immunodeficiency virus replication by antiretroviral therapy. J Virol 2008;82:3391–3404 [DOI] [PMC free article] [PubMed] [Google Scholar]
- 28.Saez-Cirion A, Bacchus C, Hocqueloux L, et al. Post-treatment HIV-1 controllers with a long-term virological remission after the interruption of early initiated antiretroviral therapy ANRS VISCONTI Study. PLoS Pathogens 2013;9:e1003211. [DOI] [PMC free article] [PubMed] [Google Scholar]
- 29.Schmitz JE, Kuroda MJ, Santra S, et al. Control of viremia in simian immunodeficiency virus infection by CD8+ lymphocytes. Science 1999;283:857–860 [DOI] [PubMed] [Google Scholar]
- 30.Soghoian DZ, Jessen H, Flanders M, et al. HIV-specific cytolytic CD4 T cell responses during acute HIV infection predict disease outcome. Sci Transl Med 2012;4:123ra125. [DOI] [PMC free article] [PubMed] [Google Scholar]
- 31.Steingrover R, Garcia EF, van Valkengoed IG, et al. Transient lowering of the viral set point after temporary antiretroviral therapy of primary HIV type 1 infection. AIDS Res Hum Retroviruses 2010;26:379–387 [DOI] [PubMed] [Google Scholar]
- 32.Veazey RS, DeMaria M, Chalifoux LV, et al. Gastrointestinal tract as a major site of CD4+ T cell depletion and viral replication in SIV infection. Science 1998;280:427–431 [DOI] [PubMed] [Google Scholar]
- 33.Walk J, Westerlaken GH, van Uden NO, et al. Inhibitory receptor expression on neonatal immune cells. Clin Exp Immunol 2012;169:164–171 [DOI] [PMC free article] [PubMed] [Google Scholar]
- 34.Wang X, Xu H, Gill AF, et al. Monitoring alpha4beta7 integrin expression on circulating CD4+ T cells as a surrogate marker for tracking intestinal CD4+ T-cell loss in SIV infection. Mucosal Immunol 2009;2:518–526 [DOI] [PMC free article] [PubMed] [Google Scholar]
- 35.Zangerle R, Steinhuber S, Sarcletti M, et al. Serum HIV-1 RNA levels compared to soluble markers of immune activation to predict disease progression in HIV-1-infected individuals. Int Arch Allergy Immunol 1998;116:228–239 [DOI] [PubMed] [Google Scholar]
Associated Data
This section collects any data citations, data availability statements, or supplementary materials included in this article.