

Abstract
Our recent studies have been aimed at understanding the mechanisms regulating apical protein sorting in polarized epithelial cells. In particular, we have been investigating how lipid rafts serve to sort apical proteins in the biosynthetic pathway. The recent findings that lipid domains are too small or transient to host apically destined cargo have led to newer versions of the hypothesis that invoke proteins required for lipid domain coalescence and stabilization. MAL (myelin and lymphocyte protein) and its highly conserved family member, MAL2, have emerged as possible regulators of this process in the direct and indirect apical trafficking pathways respectively. To test this possibility, we took a biochemical approach. We determined that MAL, but not MAL2, self-associates, forms higher-order cholesterol-dependent complexes with apical proteins and promotes the formation of detergent-resistant membranes that recruit apical proteins. Such biochemical properties are consistent with a role for MAL in raft coalescence and stabilization. These findings also support a model whereby hydrophobic mismatch between the long membrane-spanning helices of MAL and the short-acyl-chain phospholipids in the Golgi drive formation of lipid domains rich in raft components that are characterized by a thicker hydrophobic core to alleviate mismatch.
Keywords: apical targeting, cholesterol, epithelium, hepatocyte, lipid raft, myelin and lymphocyte protein (MAL)
INTRODUCTION
Epithelial cells are vital for the success of multicellular organisms. They line all body organs, providing a selective barrier between the external and internal worlds. They form intercellular junctions, thereby cementing themselves together, restricting surface activities to specific apical and basolateral plasma membrane domains. These domain-specific activities require the presence of distinct plasma membrane proteins; few proteins distribute equally between both domains. How is this polarity established and maintained? The answer comes, in part, from understanding polarized protein trafficking. Our focus is to understand the mechanisms regulating apical delivery of newly synthesized proteins in polarized hepatocytes.
In most simple epithelial cells, apical residents take the ‘direct’ route; they are delivered from the TGN (trans-Golgi network) directly to the apical surface [1,2]. In contrast, hepatic single-TMD (transmembrane domain) and GPI (glycophosphatidyinositol)-anchored resident apical proteins take the ‘indirect’ route [3–6]. They are transported from the TGN to the basolateral membrane, where they are selectively retrieved by endocytosis and transcytosed to the apical surface. Although many basolateral-targeting signals have been identified, no such signals have been identified in apical residents. However, two apical sorting mechanisms have been proposed [7,8]. The first is recognition of luminal glycans on the apical proteins by lectins in the secretory pathway. The second is the incorporation of apical proteins into specialized membrane domains due to their biochemical properties. The latter sorting mechanism is the focus of the present study.
According to the original ‘raft hypothesis’ for apical protein sorting, glycosphingolipid and cholesterol-enriched membrane domains form in the biosynthetic pathway where they recruit apically destined proteins (mainly GPI-anchored proteins) on the basis of their biophysical properties [8–10]. The lipid domains together with their cargo are then packaged into vesicles and delivered to the glycosphingolipid and cholesterol-rich apical surface [8–10]. This hypothesis has since been updated on the basis of findings that these lipid domains may be too small and/or transient to mediate sorting, thus proteins besides the sorted cargo have been invoked to regulate lipid domain coalescence and stabilization [1,2,11,12].
We and others have postulated that MAL (myelin and lymphocyte protein) and MAL2 are good candidates for mediating lipid domain coalescence [2,13–16]. These ~20 kDa tetraspanning membrane proteins are ‘raft’-associated in most cell types. Moreover, MAL has been identified as an important general regulator of direct apical targeting, whereas MAL2 has been shown to regulate indirect apical targeting in hepatocytes [14,17–20]. Furthermore, MAL-induced clusters in COS7 cells were found to specifically recruit raft components, suggesting that it indeed functions as a stabilizer of sorting platforms [15].
Previously, we examined the effects of MAL overexpression in WIF-B cells. These polarized hepatic cells lack endogenous MAL expression and rely heavily on the transcytotic route for delivery of newly synthesized apical proteins. We determined that MAL expression induced the formation of cholesterol- and glycosphingolipid-enriched Golgi domains that contained GPI-anchored and single-TMD apical proteins; pIgA-R (polymeric IgA receptor), polytopic apical and basolateral proteins were excluded [16]. Furthermore, we found that MAL expression selectively rerouted single-TMD and GPI-anchored proteins into the direct route. Because expression of MAL alone led to rerouting, we suggest further that MAL’s function in sorting may be intrinsic to its structure, a hypothesis fully consistent with a model for MAL function as described by Magal et al. ([15] and see the Discussion). To test this possibility, and to assess further whether MAL functions to coalesce raft components, we took a biochemical approach. Because MAL and MAL2 share relatively high sequence similarity (68 % similarity and 38 % identity), we examined further whether MAL2 functions similarly in regulating the indirect pathway. From the results of the present study, we conclude that MAL, but not MAL2, promotes the formation and stabilization of cholesterol-dependent membrane domains that recruit apical proteins in the biosynthetic pathway.
EXPERIMENTAL
Reagents and antibodies
Triton X-100, F12 medium (Coon’s modification), mβCD (methyl-β-cyclodextrin), EDC [N-ethyl-N′-(3-dimethylamino-propyl)carbodi-imide] and sulfo-NHS (N-hydroxysulfosuccinimide sodium salt) were purchased from Sigma–Aldrich. A 5 mM mβCD solution was made fresh in serum-free medium. HRP (horseradish peroxidase)-conjugated secondary antibodies and Western Lightning ECL (enhanced chemiluminescence) substrate were from Sigma–Aldrich and PerkinElmer Life Sciences respectively. Antibodies against APN (aminopeptidase N), 5′NT (5′-nucleotidase), pIgA-R and the Myc epitope tag (9E10) were all generously provided by Dr A. Hubbard (School of Medicine, Johns Hopkins University, Baltimore, MD, U.S.A.). Anti-MAL2 polyclonal antibodies were generated and affinity-purified as described previously [14]. Recombinant adenoviruses encoding V5/His6-tagged full-length pIgA-R and Myc-tagged MAL were also provided by Dr A. Hubbard, and they have been described in detail previously [16,21].
Cell culture
WIF-B cells were grown in a humidified 7 % CO2 incubator at 37 °C as described in [22]. Briefly, cells were grown in F12 medium (Coon’s modification) (pH 7.0), supplemented with 5 % fetal bovine serum, 10 μM hypoxanthine, 40 nM aminopterin and 1.6 μM thymidine. Cells were seeded on to glass coverslips at 1.3×10⁴ cells/cm2 and grown for 8–12 days until they reached maximum density and polarity. Clone 9 cells were grown in a humidified 5 % CO2 incubator at 37 °C in F12 medium (Coon’s modification) (pH 7.0), supplemented with 10 % fetal bovine serum. The cells were seeded on to glass coverslips at 2×10⁵ cells/well of a six-well dish and grown for 2 days.
Virus production and infection
Recombinant MAL–Myc and V5/His6-tagged pIgA-R adenoviruses were generated using the Cre-Lox system as described in [21]. WIF-B cells were infected with recombinant adenovirus particles (0.7–1.4×10¹⁰ virus particles/ml) for 60 min at 37 °C as described in [21]. The cells were washed with complete medium and incubated for an additional 18–20 h to allow expression.
Indirect immunofluorescence
To visualize MAL (Figures 1A, panels b and d, and 1D, panels a and b), cells were fixed for 30 min with 4 % (w/v) PFA (paraformaldehyde) at room temperature (25 °C) and permeabilized for 10 min at room temperature with 0.2 % Triton X-100/PBS. To visualize MAL2 alone (Figure 1D, panels c and d), cells were fixed on ice with chilled PBS containing 4 % (w/v) PFA for 1 min and permeabilized with ice-cold methanol for 10 min. Cells were processed for indirect immunofluorescence as described [23]. Alexa Fluor® 488- or 568-conjugated secondary antibodies were used at 5 μg/ml (Invitrogen). To deplete cholesterol, cells were treated for 60 min with 5 mM mβCD in serum-free medium. Labelled cells were visualized by epifluorescence using an Olympus BX60 Fluorescence Microscope. Images were taken using an HQ2 digital camera (Photometrics) and IPLabs image analysis software (Biovision). Adobe Photoshop was used to compile Figures.
Figure 1. MAL2 insolubility in Triton X-100 and cellular distribution are cholesterol-dependent.

(A) Uninfected (panels a–c) or cells exogenously expressing MAL (panels d–f) were immunolabelled for MAL or MAL2 as indicated. Corresponding phase images are also shown (panels b and d). A low-magnification phase-contrast image (panel a) shows the characteristic hepatic polarity exhibited by WIF-B cells. (B) Uninfected and MAL-expressing cells were extracted in ice-cold lysis buffer containing 1 % (v/v) Triton X-100 and centrifuged at 120 000 g for 30 min at 4 °C. Resultant supernatants (S) and pellets (P) were immunoblotted for MAL and MAL2. Molecular-mass markers are indicated on the left in kDa. The bracket highlights a 30–38 kDa diffuse set of MAL2-cross-reactive bands that has been described by others and the asterisk indicates a 25 kDa species also detected by others (see the text). (C) Uninfected (for MAL2 immunoblots) and MAL-expressing cells (for MAL immunoblots) were treated for 60 min with 5 mM mβCD at 37 °C to deplete cholesterol and lysed as described in (B). The resultant supernatants (S) and pellets (P) were immunoblotted for MAL or MAL2 as indicated. The histogram indicates the percentage insolubility of MAL and MAL2. Results are means ± S.E.M. Measurements were performed on at least three independent experiments. (D) Uninfected (panels c and d) or MAL-expressing (panels a and b) cells were cholesterol-depleted as described in (C) and immunolabelled for MAL (panels a and b) or MAL2 (panels c and d). Asterisks mark selected bile canaliculi. Scale bar, 10 μm.
Solubility in Triton X-100
WIF-B cells were rinsed in ice-cold PBS and extracted for 10 min on ice in 0.15 ml of ice-cold lysis buffer [1 % (v/v) Triton X-100, 150 mM NaCl, 25 mM Tris/HCl and 5 mM EDTA (pH 7.4)] containing 1 μg/ml each of PMSF, aprotinin, antipain, leupeptin and benzamidine. The samples were centrifuged at 60 000 rev./min for 30 min at 4 °C using a TLA 120.1 rotor. The supernatants were recovered, SDS/PAGE sample buffer was added, and the samples were boiled for 3 min. The pellets were resuspended to volume with SDS/PAGE sample buffer and boiled for 3 min. When immunoblotting for MAL2, samples were not boiled, but incubated at room temperature for 30 min [14]. The supernatants and pellets were immunoblotted with the indicated antibodies and the percentage insolubility was determined by denistometric analysis of the immunoreactive species.
Preparation of detergent-resistant membranes
Isolation of low-buoyancy membrane fractions was performed as described in [24]. WIF-B cells were rinsed in ice-cold PBS and lysed on ice for 30 min with pre-chilled lysis buffer containing 1 μg/ml each of antipain, leupeptin, benzamidine and PMSF. The lysates were diluted with an equal volume of lysis buffer containing 80 % (w/v) sucrose and placed at the bottom of a 5–30 % linear sucrose gradient. Samples were centrifuged in an SW-40 Ti swinging bucket rotor at 39 000 rev./min for 16 h at 4 °C. Fractions were collected and immunoblotted with the indicated antibodies. The relative distributions of the proteins were determined by densitometric comparison of immunoreactive bands.
Velocity gradients
Velocity gradients were performed as described in [11]. Briefly, ~ 5×10⁶ WIF-B cells were lysed at 4 °C for 30 min in 100 mM NaCl and 20 mM Tris/HCl (pH 7.4) containing 0.4 % SDS, 0.2 % Triton X-100 and 1 μg/ml each of antipain, leupeptin, benzamidine and PMSF. Lysates were loaded on top of a 5–30 % linear sucrose gradient and the tubes were centrifuged at 39 000 rev./min for 18 h at 4 °C using an SW-40 Ti swinging bucket rotor. Fractions were collected and immunoblotted with the indicated antibodies. The relative distributions of the proteins were determined by densitometric comparison of immunoreactive species. The molecular-mass standards, carbonic anhydrase (29 kDa), BSA (66 kDa), alcohol dehydrogenase (150 kDa), α-amylase (250 kDa) and apoferretin (443 kDa), were purchased from Sigma–Aldrich. To deplete cholesterol, cells were incubated in serum-free medium containing 5 mM mβCD for 30 min at 37 °C. To inhibit protein synthesis, cells were treated with 50 μg/ml cycloheximide for 60 or 120 min before lysis.
EDC cross-linking of non-nuclear membrane preparations
Non-nuclear total membrane vesicles were cross-linked with EDC and sulfo-NHS as described in [25]. Cells were detached with trypsin for 2 min at 37 °C and then pelleted by centrifugation at 500 g for 5 min. The pellet was resuspended in 5.0 ml of ice-cold hypotonic buffer [1 mM MgCl2, 1 mM EDTA (pH 7) and 1 mM DTT (dithiothreitol)] and incubated on ice for 5 min. The swollen cells were pelleted by centrifugation at 500 g for 5 min. The cells were immediately resuspended in 0.5 ml of 250 mM sucrose/PBS containing 1 μg/ml each of antipain, leupeptin, benzamidine and PMSF, and Dounce-homogenized for 20 strokes and centrifuged at 1000 g at 4 °C for 5 min. The postnuclear supernatant was centrifuged at 150 000 g for 60 min. The resultant non-nuclear membrane pellet was resuspended in 0.5 ml of PBS containing 1 μg/ml each of antipain, leupeptin, benzamidine and PMSF with 20 strokes of the Dounce homogenizer. The resuspended membranes were cross-linked with 10 mM EDC and 2.5 mM sulfo-NHS for 0, 15, 30 and 60 min. The reactions were stopped by addition of SDS/PAGE sample buffer. The samples were boiled for 3 min or kept at room temperature for 30 min (to detect MAL2). The samples were immunoblotted and the extent of cross-linking was determined by measuring the decrease in monomer levels by densitometric analysis of the immunoreactive bands. To deplete cholesterol, cells were treated with 5 mM mβCD in serum-free medium for 30 min at 37 °C before harvesting.
RESULTS
MAL, but not MAL2, associates with detergent-resistant membranes and alters apical protein raft association
Our previous studies have shown that MAL expression in WIF-B cells led to the selective and dramatic redistribution of single-TMD and GPI-anchored proteins into Golgi-derived structures [16]. To confirm that MAL2 distributions are not altered by MAL expression, we immunolabelled control and MAL-expressing cells for the MAL isoforms. WIF-B monolayers exhibit the typical polarity of hepatic cells grown in culture. The cells are characterized by phase-lucent structures positioned between adjacent cells that are functionally and compositionally analogous to bile canaliculi in vivo (Figure 1A, panel a). As we and others have shown, MAL2 distributed predominantly to these canalicular (apical) surfaces in uninfected cells (Figure 1A, panel c). This distribution did not change in MAL-overexpressing cells (Figure 1A, panel e), despite the presence of MAL in Golgi-derived intracellular puncta (Figure 1A, panel f). These results suggest that MAL and MAL2 are not interacting directly.
If MAL and MAL2 function to coalesce raft domains, one simple prediction is that they are raft-associated. Although this has been shown in a number of systems, it has not been rigorously examined in WIF-B cells. We first assessed raft-association by measuring solubility in 1 % (v/v) Triton X-100 at 4 °C. As predicted, both MAL (41.8 ± 1.3 %, range 39–44 %) and MAL2 (68.0 ± 5.8 %, range 52–100 %) were partially insoluble in Triton X-100 (Figures 1B and C). Our anti-MAL2 antibodies detected a 19 kDa species (the predicted MAL2 molecular mass), a band at 25 kDa (marked by an asterisk) and a diffuse set of bands ranging from 30 to 38 kDa (marked with a bracket) (Figure 1B). The 25 kDa band and the diffuse bands have been detected by others using different custom antibodies and have been postulated to be glycosylated MAL2 forms [18,26]. Interestingly, the solubility properties of these bands were identical with that of the 19 kDa MAL2 (Figure 1B). Furthermore, MAL expression did not change the solubilities of any of the MAL2-immunoreactive species (Figure 1B; + MAL) confirming further that they are not interacting.
To determine whether the detergent-insolubility was cholesterol-dependent, we treated cells with 5 mM mβCD for 60 min, conditions that deplete 80 % of cholesterol in WIF-B cells [27]. As predicted, the majority of MAL2 was soluble in cholesterol-depleted cells; only 26 ± 11.0 % remained in the pellet (Figure 1C). However, MAL’s solubility did not change; 41 ± 2.1 % compared with 40 ± 0.9 % of MAL was soluble in control compared with treated cells respectively (Figure 1C). This somewhat unexpected finding might be explained by the observation that only MAL2 distributions are altered in cholesterol-depleted cells. In cells treated with mβCD, increased MAL2 basolateral labelling was observed (Figure 1D, panel d). In contrast, MAL-staining patterns did not change in cholesterol-depleted cells (Figure 1D, panels a and b, and see the Discussion).
We further assayed MAL and MAL2 raft association using sucrose density gradient analysis of detergent lysates isolated from MAL-expressing cells. As predicted, and as we have shown previously [16], MAL distributed to low-buoyant-density fractions (fractions 4–6) that contained 22–26 % sucrose (Figure 2A). This is in agreement with preparations from other epithelial cells where MAL floated in fractions containing 24–25 % sucrose [28–30]. In contrast, and somewhat surprisingly, both the 19 kDa and higher-molecular-mass forms of MAL2 were detected only in the soluble-load fractions (Figure 2A), indicating that it is not associated with detergent-resistant membranes or with MAL in WIF-B cells.
Figure 2. MAL expression alters the buoyant densities of apical proteins.
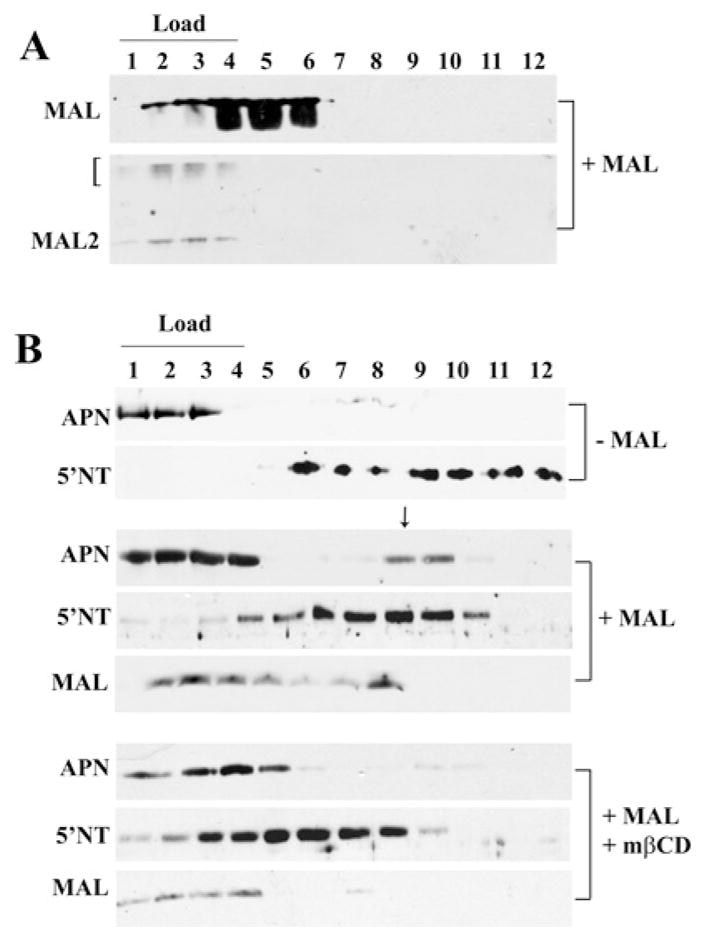
(A) MAL-expressing cells were lysed in ice-cold buffer containing 1 % (v/v) Triton X-100 and subjected to low-density flotation (see the Experimental section). The first four fractions correspond to the load. Fractions were immunoblotted for MAL or MAL2 as indicated. The bracket on the left highlights a 30–38 kDa diffuse set of MAL2 cross-reactive bands. (B) Uninfected (upper panels) or MAL-expressing cells (middle and bottom panels) were incubated in the absence (top five panels) or presence (bottom three panels) of 5 mM mβCD at 37 °C for 30 min and subjected to low-density flotation as described in (A). Fractions were immunoblotted for APN, 5′NT or MAL as indicated.
Previously, we determined that MAL expression altered the buoyant properties of single-TMD and GPI-anchored proteins [16]. To determine whether raft components are required for the altered apical protein buoyant densities, we examined whether cholesterol depletion reversed these associations. As described previously [16], in cells lacking MAL expression, APN (a single-TMD apical resident) was detected only in the soluble-load fractions (Figure 2B) whereas 5′NT (a GPI-anchored apical protein) distributed to low-buoyant-density fractions 6–12. Also as shown previously, in cells expressing MAL, a subpopulation of APN was detected in higher-buoyant-density fractions, whereas 5′NT distributed to higher-buoyant-density fractions, both overlapping with MAL in fraction 8 (Figure. 2B, marked with an arrow). This redistribution suggests that MAL enhances the raft-association of the apical residents. In cholesterol-depleted cells, the majority of MAL was no longer detected in low-buoyant-density fractions, but was detected mainly in the load (Figure 2B). Similarly, all of APN was detected in load fractions 1–4 (Figure 2B). Although a substantial pool of 5′NT remained in the buoyant fractions, they were of lower buoyancy than in untreated MAL-expressing cells, indicating altered association with detergent-resistant membranes. Together, these results indicate that MAL expression induces the production of detergent-resistant membranes that promote the raft-association of single-TMD and GPI-anchored proteins and that this association requires cholesterol.
MAL, but not MAL2, is present in high-molecular-mass cholesterol-dependent complexes with apical proteins
If MAL and MAL2 are required for raft coalescence and stabilization, another prediction is that they form stable complexes with themselves and with apical proteins. To test this possibility, we examined complex formation using velocity gradient centrifugation. In gradients where lysates from either uninfected or MAL-expressing cells were analysed, MAL2 distributed to the top of the gradient (fractions 1–3) (Figure 3A, top and bottom panels). Because these fractions correspond to molecular masses of less than 29 kDa, we conclude that the 19 kDa MAL2 is likely to be monomeric. When quantified, 93.5 ± 3.2 % of MAL2 was detected as a monomer (Figure 3C, left-hand panel). In contrast, MAL displayed a biphasic distribution peaking in fractions 2 and 3 at the top of the gradient and again in fraction 8 (marked with an arrow) (Figure 3A, middle panel). Marker analysis revealed that this fraction corresponds to a molecular mass of ~250 kDa, indicating that MAL is present in higher-order complexes. This distribution was highly reproducible: in all experiments analysed (n = 7), MAL was detected in complexes peaking in fraction 6–8 or 7–9 corresponding to ~250 kDa. As shown in Figure 3(C), 56.7 ± 6.6 %of MAL was found in higher-molecular-mass complexes (left-hand panel), and 27.2 ± 4.3 % of total MAL was found in fractions corresponding to ~250 kDa (right-hand panel).
Figure 3. MAL, but not MAL2, forms high-molecular-mass complexes in WIF-B cells.
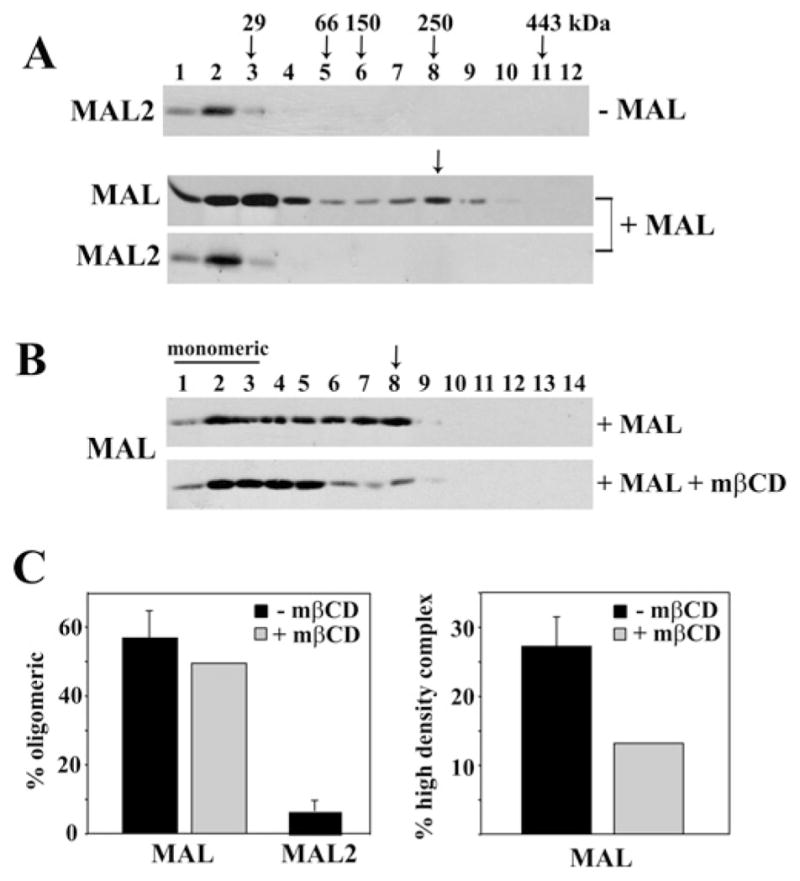
(A) Uninfected cells (top panel) or cells expressing MAL (bottom two panels) were lysed in ice-cold buffer containing 0.4 % SDS and 0.2 % Triton X-100, then lysates were loaded on top of 5–30 % linear sucrose gradients and centrifuged at 192 000 g for 18 h. Fractions were immunoblotted for MAL and MAL2 as indicated on the left. Arrows above the top panel mark the distributions of the molecular-mass standards (in kDa). The arrow above the bottom two panels indicates fraction 8. (B) MAL-expressing cells were treated in the absence (+ MAL) or presence of 5 mM mβCD (MAL + mβCD) for 30 min and lysed and centrifuged as described in (A). Fractions were immunoblotted for MAL. The fractions containing monomeric MAL are indicated. The arrow points to a higher-density fraction containing MAL. (C) The percentage of total oligomeric MAL or MAL2 in control (+ MAL) or cholesterol-depleted cells (MAL + mβCD) are plotted in the histogram on the left. Results for untreated (− mβCD) cells (black bars) are means ± S.E.M. Measurements were performed on at least three independent experiments. Results for the cholesterol-depleted cells are expressed as the average from two independent experiments. The histogram on the right shows the percentage of MAL present in the high-density fractions. Results for untreated (− mβCD) cells (black bars) are means ± S.E.M. Measurements were performed on at least three independent experiments. Results for cholesterol-depleted cells are expressed as the average from two independent experiments.
To determine whether these high-molecular-mass complexes were cholesterol-dependent, we pre-treated cells with mβCD before lysis. As shown in the lower panel of Figure 3(B), much less MAL distributed to the high-molecular-mass fractions; less than 15 % was detected in fractions 7–9 (Figure 3C, right-hand panel). Although increased MAL levels were observed in lower-molecular-mass forms from cholesterol-depleted cells, there was not a significant increase in MAL present in fractions containing mainly monomeric forms; ~50 % remained oligomeric (Figure 3C, left-hand panel). Together, these results suggest that MAL is present in cholesterol-dependent high-molecular-mass complexes.
To determine whether apical proteins were also present in these high-molecular-mass complexes, we immunoblotted gradient fractions for APN and 5′NT. In control cells, both APN and 5′NT distributed mainly to broad peaks in fractions 5–10 (Figure 4A, top panels). However, in MAL-overexpressing cells, there was a dramatic tightened redistribution of both APN and 5′NT into fraction 7 that also contained MAL (Figure 4A, middle three panels, marked with an arrow). In cholesterol-depleted cells, this tight distribution was lost; MAL was observed in lower-molecular-mass fractions, whereas the broader distributions seen in uninfected cells were restored for APN and 5′NT (Figure 4A, lower three panels). These results suggest that MAL expression induced the formation of cholesterol-dependent high-molecular-mass complexes that contain apical residents. Importantly, MAL expression did not lead to the redistribution of pIgA-R into the high-molecular-mass MAL-containing fractions (Figure 4B), indicating that the effect is selective. This is consistent with our previous findings that MAL expression does not alter the distribution or the buoyant density of pIgA-R [16].
Figure 4. The distribution of apical proteins into the MAL-positive high density fractions is cholesterol-dependent.

(A) Uninfected cells (top two panels) or MAL-expressing cells (bottom six panels) were incubated in the absence or presence of 5 mM mβCD (MAL + mβCD) for 30 min at 37 °C. Cells were lysed and centrifuged as described in Figure 3. Fractions were immunoblotted for APN, 5′NT and MAL as indicated on the left. The arrows above the top panel mark the distribution of the molecular-mass standards (in kDa). The arrow above the middle panels marks the MAL-positive high-molecular-mass complexes. (B) Cells overexpressing pIgA-R alone (top panel) or pIgA-R and MAL (bottom two panels) were lysed and centrifuged as described in Figure 3. Fractions were immunoblotted for pIgA-R and MAL as indicated on the left. The arrow points to the high-molecular-mass complexes containing MAL.
MAL and the apical proteins interact directly
To confirm that MAL2 is monomeric and that MAL and apical proteins form higher-order complexes, we cross-linked membrane vesicles with the zero-length cross-linker EDC. Consistent with the sedimentation analysis, no higher-order MAL2 oligomers were observed, even after prolonged cross-linking (Figure 5A). After 60 min, no changes in the levels of the 19 kDa monomeric protein were observed (Figure 5A). Also interestingly, the levels of the 30–38 kDa diffuse MAL2-positive species did not change after cross-linking, suggesting that these species are also monomeric (Figure 5A). Neither cholesterol depletion with mβCD (Figure 5A; middle panel) nor MAL overexpression altered the MAL2 oligomerization state (Figure 5A; right-hand panel).
Figure 5. Cross-linking confirms that MAL, but not MAL2, is present in high-molecular-mass complexes.
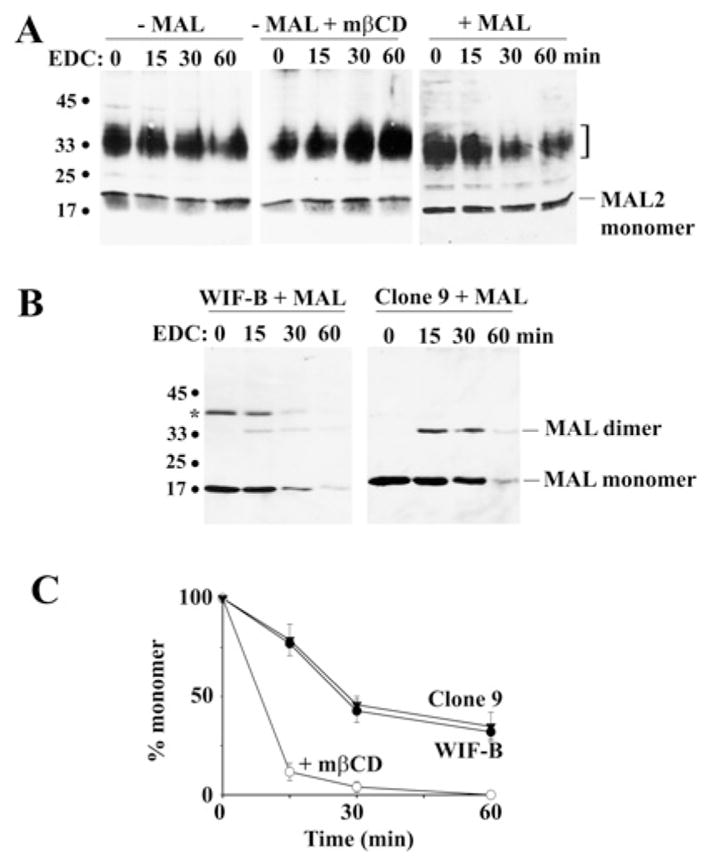
(A) Uninfected WIF-B cells (left-hand and middle panels) or MAL-expressing cells (+ MAL) were treated in the absence or presence of 5 mM mβCD (+ MAL + mβCD) for 30 min at 37 °C. Post-nuclear membranes were isolated and cross-linked with 10 mM EDC and 2.5 mM sulfo-NHS for 0, 15, 30 and 60 min. Reactions were stopped by the addition of SDS/PAGE sample buffer. Samples were immunoblotted for MAL2. Molecular-mass markers are indicated on the left in kDa. The monomeric form of MAL2 is indicated. The bracket highlights a 30–38 kDa diffuse set of cross-reactive MAL2 bands. (B) Post-nuclear membranes from WIF-B (left-hand panel) or Clone 9 (right-hand panel) cells expressing MAL were cross-linked as described in (A). Samples were immunoblotted for MAL. Molecular-mass markers are indicated on the left in kDa. The relative migrations of the MAL monomeric and dimeric forms are indicated. The asterisk indicates a MAL-cross-reactive species in WIF-B cells that is not detected in Clone 9 cells. (C) The percentage loss of total MAL monomer over time was plotted for untreated (Clone 9 and WIF-B) and treated (WIF-B + mβCD) cells as indicated. Results are means ± S.E.M. Measurements were performed on at least three independent experiments.
In contrast, MAL was readily cross-linked with EDC. In non-cross-linked WIF-B samples, MAL was detected only as a 17 kDa monomer (Figure 5B, left-hand panel, 0 min). The 40 kDa band marked with an asterisk is an unidentified cross-reactive species in WIF-B cells (no such band is detected in Clone 9 cells; Figure 5B, right-hand panel). However, after 15 min in EDC, an additional band at ~35 kDa was observed with a concomitant loss of monomer reflecting MAL dimer formation (Figure 5B). By 60 min, only traces of the monomeric and dimeric forms were detected, indicating that MAL is present in complexes that are too large to enter this 12 % acrylamide gel (however, see Figure 6).
Figure 6. Cross-linking confirms that MAL and the apical proteins form cholesterol-dependent high-molecular-mass complexes.

(A) Post-nuclear membranes from MAL-expressing cells were cross-linked as described in Figure 5 and samples were immunoblotted for MAL. The relative migrations of MAL monomeric, dimeric and multimeric forms are indicated. The asterisk indicates a MAL-cross-reactive species in WIF-B cells. Molecular-mass markers are indicated on the left in kDa. (B) Postnuclear membranes from uninfected (left-hand panel) or MAL-expressing (right-hand panel) cells were cross-linked as described in Figure 5 and samples were immunoblotted for APN. The APN monomeric and dimeric forms are indicated. Arrows point to cross-linked species detected only in MAL-overexpressing cells. Molecular-mass markers are indicated on the left in kDa. (C) WIF-B cells expressing MAL were treated for 30 min with 5 mM mβCD at 37 °C. Post-nuclear membranes were cross-linked and samples were immunoblotted for MAL. The relative migrations of MAL monomeric, dimeric and multimeric forms are indicated. The asterisk indicates a MAL-cross-reactive species in WIF-B cells. Molecular-mass markers are indicated on the left in kDa.
We also cross-linked membranes isolated from Clone 9 cells that were expressing MAL. Importantly, these cells lack endogenous MAL, allowing us to examine intrinsic MAL oligomeric properties. As shown in Figure 5(B) (right-hand panel), a similar loss in the MAL monomeric species and increase in the dimeric form were observed. In fact, when loss of monomer was plotted for MAL expressed in WIF-B or Clone 9 cells, nearly overlapping lines were obtained (Figure 5C). After 15 min of cross-linking, 77 ± 1.5 % and 78.8 ± 8 % of monomer were detected in WIF-B and Clone 9 cells respectively, and by 60 min, only 32 ± 3.5 % and 34.8 ± 7.3 % of the monomer remained. These results suggest that MAL can form large oligomers.
To further examine MAL oligomeric species, we ran cross-linked samples on lower percentage acrylamide gels. As shown in Figure 6(A), MAL was readily cross-linked into dimers by 15 min, with the concomitant appearance of a faint MAL-immunoreactive species at ~175 kDa and a darker species at ~250 kDa. The molecular masses of these oligomeric species are remarkably consistent with the complexes observed by velocity sedimentation in Figure 4. By 60 min, only traces of the higher-molecular-mass complexes were detected, indicating extensive MAL cross-linking into oligomers too large to be resolved.
To determine whether the cross-linked complexes contained apical proteins, we immunoblotted for APN in samples from uninfected and MAL-expressing cells. Consistent with the prediction that APN (molecular mass 150 kDa) functions as a dimer in vivo, the 300 kDa dimeric form was detected in cross-linked samples from non-expressing cells (Figure 6B, left-hand panel). In MAL-expressing cells, the dimeric species was also observed, but, interestingly, its appearance was enhanced (Figure 6B, right-hand panel). Furthermore, additional APN-immunoreactive species were observed in samples from MAL-overexpressing cells. As for MAL, APN-immunoreactive species at ~175 and ~250 kDa were detected after 30 min of cross-linking (marked by arrows). Even-higher-order complexes were observed after 30 and 60 min of cross-linking (marked with arrows), indicating large APN-containing oligomers were induced by MAL expression. Together, these results suggest that MAL and APN form higher-order complexes and confirm that APN and MAL interact directly in the gradient fractions corresponding to ~ 250 kDa (Figure 4).
To determine whether MAL oligomer formation is cholesterol-dependent, we cross-linked vesicles prepared from cholesterol-depleted cells. Interestingly, cholesterol depletion enhanced MAL cross-linking in WIF-B cells (Figure 6C). After 15 min in EDC, only 15 % of the control levels of monomer were detected (Figure 5B), with a concomitant increase in detection of the higher-molecular-mass species; no intermediate dimers were observed in the cholesterol-depleted samples (Figure 6C). The enhanced appearance of the large oligomers indicates that MAL was readily cross-linked into large complexes in cholesterol-depleted cells. The implications of these findings are not yet fully understood, but probably reflect rapid self-assembly (see the Discussion).
MAL stabilizes lipid sorting domains in the biosynthetic pathway
According to a recent model proposed by Magal et al. ([15] and see the Discussion), MAL serves to stabilize lipid sorting domains in the biosynthetic pathway, but after apical delivery, the sorting platforms disassemble. To test this prediction, we monitored MAL complex formation in cells treated with cycloheximide for up to 120 min, conditions that we have previously shown allow complete MAL-mediated direct apical delivery [16]. In untreated cells, MAL again displayed a biphasic gradient distribution with a peak at the top of the gradient and in the fractions corresponding to ~250 kDa (Figure 7A, top panel). After 60 min of ‘chase’ in cycloheximide, MAL distributed to fractions corresponding to even-higher-molecular-mass higher-density fractions, but after 120 min, nearly all of the MAL was detected at the top of the gradient (Figure 7A, middle and bottom panels respectively). Unlike in mβCD-treated cells, these fractions contained mainly monomeric MAL. More than 80 % of total MAL was monomeric after 120 min of chase (Figure 7B). These results indicate that the high-molecular-mass cholesterol-dependent MAL complexes dissociate upon apical delivery.
Figure 7. MAL oligomers dissociate upon apical delivery.

(A) MAL-expressing cells were treated with 50 μg/ml cycloheximide (CHX) for 0, 60 or 120 min at 37 °C as indicated. Cells were lysed and centrifuged as described in Figure 3. Fractions were collected and immunoblotted for MAL. The fractions containing monomeric MAL are indicated. (B) The percentage of total oligomeric MAL detected in the gradients shown in (A) is plotted.
DISCUSSION
The present study was performed to determine biochemically whether MAL and MAL2 cluster and stabilize raft domains into apical sorting platforms. Despite the relatively high sequence similarity between MAL and MAL2 (68 % similarity and 38 % identity), we determined that the two proteins have very different biochemical properties. Using a variety of biochemical methods, we provide evidence that MAL (but not MAL2) self-associates, forms higher-order complexes with apical proteins and promotes the formation of detergent-resistant membranes that recruit apical proteins. Thus MAL displays numerous biochemical properties that are consistent with its proposed function in raft coalescence and stabilization. As we discuss below, our results are fully consistent with and confirm aspects of a model for MAL function in apical sorting put forth by Magal et al. [15] on the basis of their morphological analysis of MAL expression.
Model for MAL function in domain stabilization
In 2009, Magal et al. [15] proposed a model for MAL function on the basis of their morphological analysis of COS7 cells overexpressing MAL tagged with the tandem dimer DiHcRed or FLAG-tagged MAL that was antibody-cross-linked. In both cases, they determined that MAL self-assembled into large homo-oligomers and that these clusters recruited components of apical sorting raft domains including long-acyl-chain lipids, GPI-anchored proteins and cholera toxin B subunit [15]. On the basis of their other findings, they proposed that MAL clustering was driven by positive hydrophobic mismatching between the long MAL transmembrane helices (23–25 amino acids) and the shorter hydrophobic chains of the membrane lipids. Thus, when traversing Golgi membranes that are characterized by a thinner hydrophobic core, MAL rapidly self assembles and recruits raft-associated lipids that are characterized by longer hydrophobic acyl chains to alleviate mismatch. Other apically destined proteins may also be recruited to the MAL clusters due to their GPI anchors or longer transmembrane regions (22–25 amino acids). Once delivered to the apical surface that is rich in cholesterol and glycosphingolipids, and therefore thicker and more able to support the long TMDs, the hydrophobic mismatch is relieved, the complexes dissociate and MAL is monomeric.
Our biochemical analysis of MAL expression in WIF-B cells is fully consistent with and confirms aspects of this model. From velocity gradients and detergent-resistant membrane analysis, we determined that MAL expression induced the formation of raft lipid domains that recruited apical proteins, and that these domains were cholesterol-dependent. EDC cross-linking revealed that MAL and the apical proteins interact directly. When chased to the apical surface in cycloheximide-treated cells, MAL oligomers were lost, suggesting that the sorting platforms disassemble after apical delivery.
Interestingly, cholesterol depletion led to enhanced MAL cross-linking by EDC, suggesting increased oligomer formation. Although we cannot rule out the possibility that MAL interacts with other proteins under these conditions, we suggest that MAL is forming even-higher-order homo-oligomers. The prediction is that when cholesterol is depleted, the raft domains are disrupted such that the MAL transmembrane helices experience even more hydrophobic mismatch, resulting in enhanced self-association. This is consistent with results from Magal and colleagues, where they disrupted MAL-induced clusters with the addition of cholesterol or long-chain ceramides [15]. This is also consistent with our findings that cholesterol depletion disassembled the high-density MAL–apical protein complexes, but MAL remained oligomeric. Thus the domains were lost, but MAL oligomers persisted and/or reformed.
MAL2 has distinct biochemical properties
Despite the relatively high sequence similarity between MAL and MAL2, the two proteins have very different biochemical properties. Unlike MAL, MAL2 does not form complexes with apical proteins, does not self-assemble and is not associated with detergent-resistant membranes in WIF-B cells. These results are consistent with the lack of cluster formation observed in COS7 cells overexpressing DiHcRed-tagged MAL2 [15]. This is also consistent with the lack of MAL2 raft association in oligodendrocytes and multiple breast cancer cell lines [31,32]. However, it is not consistent with MAL2 association with detergent-resistant membranes in HepG2 cells, thyrocytes or PC-3 cells [18,26,33,34]. At present, we cannot reconcile these disparate results. Nonetheless, cholesterol depletion did alter MAL2 solubility in Triton X-100 and distributions in WIF-B cells, implying that MAL2 function is dependent on raft components.
One proposed explanation for the large differences in MAL and MAL2 biochemical properties is that because MAL2 has shorter transmembrane helices than MAL, it does not encounter positive hydrophobic mismatch such that it does not need to recruit raft components to alleviate that mismatch [15]. Yet, the question remains about how MAL2 regulates apical protein sorting. This question is complicated by the fact that MAL2 probably regulates multiple transport steps in the indirect pathway [14,18,33] and that many MAL2-binding partners have been identified that regulate different apical protein trafficking steps ([18,32,35], and J.G. In, S.P. Ramnarayanan and P.L. Tuma, unpublished work). Further research is clearly needed to answer these provocative questions.
Acknowledgments
We thank Dr Ann Hubbard for providing the many antibodies and viruses used. We thank Julie G. In for technical assistance.
FUNDING
This work was supported by the National Institutes of Health [grant numbers GM070801 and DK082890 (awarded to P.L.T.)].
Abbreviations used
- APN
aminopeptidase N
- EDC
N-ethyl-N′-(3-dimethylaminopropyl)carbodi-imide
- GPI
glycophosphatidyinositol
- MAL
myelin and lymphocyte protein
- mβCD
methyl-β-cyclodextrin
- 5′NT
5′-nucleotidase
- PFA
paraformaldehyde
- pIgA-R
polymeric IgA receptor
- sulfo-NHS
N-hydroxysulfosuccinimide sodium salt
- TGN
trans-Golgi network
- TMD
transmembrane domain
Footnotes
AUTHOR CONTRIBUTION
Sai Ramnarayanan designed and performed the majority of the experiments. He also contributed to the writing of the text and some Figure preparation. Pamela Tuma designed and performed some of the experiments. She also prepared the majority of the Figures and wrote most of the text.
References
- 1.Rodriguez-Boulan E, Kreitzer G, Musch A. Organization of vesicular trafficking in epithelia. Nat Rev Mol Cell Biol. 2005;6:233–247. doi: 10.1038/nrm1593. [DOI] [PubMed] [Google Scholar]
- 2.Weisz OA, Rodriguez-Boulan E. Apical trafficking in epithelial cells: signals, clusters and motors. J Cell Sci. 2009;122:4253–4266. doi: 10.1242/jcs.032615. [DOI] [PMC free article] [PubMed] [Google Scholar]
- 3.Bartles JR, Feracci HM, Stieger B, Hubbard AL. Biogenesis of the rat hepatocyte plasma membrane in vivo: comparison of the pathways taken by apical and basolateral proteins using subcellular fractionation. J Cell Biol. 1987;105:1241–1251. doi: 10.1083/jcb.105.3.1241. [DOI] [PMC free article] [PubMed] [Google Scholar]
- 4.Bartles JR, Hubbard AL. Plasma membrane protein sorting in epithelial cells: do secretory pathways hold the key? Trends Biochem Sci. 1988;13:181–184. doi: 10.1016/0968-0004(88)90147-8. [DOI] [PubMed] [Google Scholar]
- 5.Schell MJ, Maurice M, Stieger B, Hubbard AL. 5′nucleotidase is sorted to the apical domain of hepatocytes via an indirect route. J Cell Biol. 1992;119:1173–1182. doi: 10.1083/jcb.119.5.1173. [DOI] [PMC free article] [PubMed] [Google Scholar]
- 6.Tuma PL, Hubbard AL. Transcytosis: crossing cellular barriers. Physiol Rev. 2003;83:871–932. doi: 10.1152/physrev.00001.2003. [DOI] [PubMed] [Google Scholar]
- 7.Scheiffele P, Peranen J, Simons K. N-glycans as apical sorting signals in epithelial cells. Nature. 1995;378:96–98. doi: 10.1038/378096a0. [DOI] [PubMed] [Google Scholar]
- 8.Simons K, Ikonen E. Functional rafts in cell membranes. Nature. 1997;387:569–572. doi: 10.1038/42408. [DOI] [PubMed] [Google Scholar]
- 9.Ikonen E. Roles of lipid rafts in membrane transport. Curr Opin Cell Biol. 2001;13:470–477. doi: 10.1016/s0955-0674(00)00238-6. [DOI] [PubMed] [Google Scholar]
- 10.Ikonen E, Simons K. Protein and lipid sorting from the trans-Golgi network to the plasma membrane in polarized cells. Semin Cell Dev Biol. 1998;9:503–509. doi: 10.1006/scdb.1998.0258. [DOI] [PubMed] [Google Scholar]
- 11.Paladino S, Sarnataro D, Pillich R, Tivodar S, Nitsch L, Zurzolo C. Protein oligomerization modulates raft partitioning and apical sorting of GPI-anchored proteins. J Cell Biol. 2004;167:699–709. doi: 10.1083/jcb.200407094. [DOI] [PMC free article] [PubMed] [Google Scholar]
- 12.Hancock JF. Lipid rafts: contentious only from simplistic standpoints. Nat Rev Mol Cell Biol. 2006;7:456–462. doi: 10.1038/nrm1925. [DOI] [PMC free article] [PubMed] [Google Scholar]
- 13.Frank M. MAL, a proteolipid in glycosphingolipid enriched domains: functional implications in myelin and beyond. Prog Neurobiol. 2000;60:531–544. doi: 10.1016/s0301-0082(99)00039-8. [DOI] [PubMed] [Google Scholar]
- 14.In JG, Tuma PL. MAL2 selectively regulates polymeric IgA receptor delivery from the Golgi to the plasma membrane in WIF-B cells. Traffic. 2010;11:1056–1066. doi: 10.1111/j.1600-0854.2010.01074.x. [DOI] [PMC free article] [PubMed] [Google Scholar]
- 15.Magal LG, Yaffe Y, Shepshelovich J, Aranda JF, del de Marco MC, Gaus K, Alonso MA, Hirschberg K. Clustering and lateral concentration of raft lipids by the MAL protein. Mol Biol Cell. 2009;20:3751–3762. doi: 10.1091/mbc.E09-02-0142. [DOI] [PMC free article] [PubMed] [Google Scholar]
- 16.Ramnarayanan SP, Cheng CA, Bastaki M, Tuma PL. Exogenous MAL reroutes selected hepatic apical proteins into the direct pathway in WIF-B cells. Mol Biol Cell. 2007;18:2707–2715. doi: 10.1091/mbc.E07-02-0096. [DOI] [PMC free article] [PubMed] [Google Scholar]
- 17.Cheong KH, Zacchetti D, Schneeberger EE, Simons K. VIP17/MAL, a lipid raft-associated protein, is involved in apical transport in MDCK cells. Proc Natl Acad Sci USA. 1999;96:6241–6248. doi: 10.1073/pnas.96.11.6241. [DOI] [PMC free article] [PubMed] [Google Scholar]
- 18.De Marco MC, Martin-Belmonte F, Kremer L, Albar JP, Correas I, Vaerman JP, Marazuela M, Byrne JA, Alonso MA. MAL2, a novel raft protein of the MAL family, is an essential component of the machinery for transcytosis in hepatoma HepG2 cells. J Cell Biol. 2002;159:37–44. doi: 10.1083/jcb.200206033. [DOI] [PMC free article] [PubMed] [Google Scholar]
- 19.Martin-Belmonte F, Alonso MA, Zhang X, Arvan P. Thyroglobulin is selected as luminal protein cargo for apical transport via detergent-resistant membranes in epithelial cells. J Biol Chem. 2000;275:41074–41081. doi: 10.1074/jbc.M005429200. [DOI] [PubMed] [Google Scholar]
- 20.Puertollano R, Alonso MA. MAL, an integral element of the apical sorting machinery, is an itinerant protein that cycles between the trans-Golgi network and the plasma membrane. Mol Biol Cell. 1999;10:3435–3447. doi: 10.1091/mbc.10.10.3435. [DOI] [PMC free article] [PubMed] [Google Scholar]
- 21.Bastaki M, Braiterman LT, Johns DC, Chen YH, Hubbard AL. Absence of direct delivery for single transmembrane apical proteins or their “secretory” forms in polarized hepatic cells. Mol Biol Cell. 2002;13:225–237. doi: 10.1091/mbc.01-07-0376. [DOI] [PMC free article] [PubMed] [Google Scholar]
- 22.Shanks MS, Cassio D, Lecoq O, Hubbard AH. An improved rat hepatoma hybrid cell line: generation and comparison with its hepatoma relatives and hepatocytes in vivo. J Cell Sci. 1994;107:813–825. doi: 10.1242/jcs.107.4.813. [DOI] [PubMed] [Google Scholar]
- 23.Ihrke G, Neufeld EB, Meads T, Shanks MR, Cassio D, Laurent M, Schroer TA, Pagano RE, Hubbard AL. WIF-B cells: an in vitro model for studies of hepatocyte polarity. J Cell Biol. 1993;123:1761–1775. doi: 10.1083/jcb.123.6.1761. [DOI] [PMC free article] [PubMed] [Google Scholar]
- 24.Brown DA, Rose JK. Sorting of GPI-anchored proteins to glycolipit-enriched membrane subdomains during transport to the apical cell surface. Cell. 1992;68:533–544. doi: 10.1016/0092-8674(92)90189-j. [DOI] [PubMed] [Google Scholar]
- 25.Tuma PL, Collins CA. Dynamin forms oligomeric complexes in the presence of lipid vesicles. J Biol Chem. 1995;270:26707–26714. doi: 10.1074/jbc.270.44.26707. [DOI] [PubMed] [Google Scholar]
- 26.Marazuela M, Martin-Belmonte F, Garcia-Lopez MA, Aranda JF, de Marco MC, Alonso MA. Expression and distribution of MAL2, an essential element of the machinery for basolateral-to-apical transcytosis, in human thyroid epithelial cells. Endocrinology. 2004;145:1011–1016. doi: 10.1210/en.2003-0652. [DOI] [PubMed] [Google Scholar]
- 27.Nyasae LK, Hubbard AL, Tuma PL. Transcytotic efflux from early endosomes is dependent on cholesterol and glycosphingolipids in polarized hepatic cells. Mol Biol Cell. 2003;14:2689–2705. doi: 10.1091/mbc.E02-12-0816. [DOI] [PMC free article] [PubMed] [Google Scholar]
- 28.Martin-Belmonte F, Kremer L, Albar JP, Marazuela M, Alonso MA. Expression of the MAL gene in the thyroid: the MAL proteolipid, a component of glycolipid-enriched membranes, is apically distributed in thyroid follicles. Endocrinology. 1998;139:2077–2084. doi: 10.1210/endo.139.4.5875. [DOI] [PubMed] [Google Scholar]
- 29.Martin-Belmonte F, Puertollano R, Millan J, Alonso MA. The MAL proteolipid is necessary for the overall apical delivery of membrane proteins in the polarized epithelial Madin–Darby canine kidney and fischer rat thyroid cell lines. Mol Biol Cell. 2000;11:2033–2045. doi: 10.1091/mbc.11.6.2033. [DOI] [PMC free article] [PubMed] [Google Scholar]
- 30.Tall RD, Alonso MA, Roth MG. Features of influenza HA required for apical sorting differ from those required for association with DRMs or MAL. Traffic. 2003;4:838–849. doi: 10.1046/j.1398-9219.2003.0138.x. [DOI] [PubMed] [Google Scholar]
- 31.Bello-Morales R, de Marco MC, Aranda JF, Matesanz F, Alcina A, Lopez-Guerrero JA. Characterization of the MAL2-positive compartment in oligodendrocytes. Exp Cell Res. 2009;315:3453–3465. doi: 10.1016/j.yexcr.2009.08.003. [DOI] [PubMed] [Google Scholar]
- 32.Fanayan S, Shehata M, Agterof AP, McGuckin MA, Alonso MA, Byrne JA. Mucin 1 (MUC1) is a novel partner for MAL2 in breast carcinoma cells. BMC Cell Biol. 2009;10:7. doi: 10.1186/1471-2121-10-7. [DOI] [PMC free article] [PubMed] [Google Scholar]
- 33.de Marco MC, Puertollano R, Martinez-Menarguez JA, Alonso MA. Dynamics of MAL2 during glycosylphosphatidylinositol-anchored protein transcytotic transport to the apical surface of hepatoma HepG2 cells. Traffic. 2006;7:61–73. doi: 10.1111/j.1600-0854.2005.00361.x. [DOI] [PubMed] [Google Scholar]
- 34.Llorente A, de Marco MC, Alonso MA. Caveolin-1 and MAL are located on prostasomes secreted by the prostate cancer PC-3 cell line. J Cell Sci. 2004;117:5343–5351. doi: 10.1242/jcs.01420. [DOI] [PubMed] [Google Scholar]
- 35.Madrid R, Aranda JF, Rodríguez-Fraticelli AE, Ventimiglia L, Andrés-Delgado L, Shehata M, Fanayan S, Shahheydari H, Gómez S, Jiménez A, et al. The formin INF2 regulates basolateral-to-apical transcytosis and lumen formation in association with Cdc42 and MAL2. Dev Cell. 2010;18:814–827. doi: 10.1016/j.devcel.2010.04.001. [DOI] [PubMed] [Google Scholar]