

Abstract
Inspired by recent developments in localization microscopy that applied averaging of identical particles in 2D for increasing the resolution even further, we discuss considerations for alignment (registration) methods for particles in general and for 3D in particular. We detail that traditional techniques for particle registration from cryo electron microscopy based on cross-correlation are not suitable, as the underlying image formation process is fundamentally different. We argue that only localizations, i.e. a set of coordinates with associated uncertainties, are recorded and not a continuous intensity distribution. We present a method that owes to this fact and that is inspired by the field of statistical pattern recognition. In particular we suggest to use an adapted version of the Bhattacharyya distance as a merit function for registration. We evaluate the method in simulations and demonstrate it on three-dimensional super-resolution data of Alexa 647 labelled to the Nup133 protein in the nuclear pore complex of Hela cells. From the simulations we find suggestions that for successful registration the localization uncertainty must be smaller than the distance between labeling sites on a particle. These suggestions are supported by theoretical considerations concerning the attainable resolution in localization microscopy and its scaling behavior as a function of labeling density and localization precision.
1 Introduction
Over the last decade a number of optical nanoscopy techniques have been proposed to bridge the resolution gap between electron (~ 1 nm) and conventional light microscopy (> 200 nm). The latter is fundamentally limited by diffraction to a length scale λ/2NA, where λ is the wavelength of the light and NA is the numerical aperture of the microscope, a measure for the fraction of light captured by the objective. Localization microscopy is one of these nanoscopic techniques [1, 2, 3, 4, 5, 6]. Here, the fluorescent labels are photo-chemically manipulated to switch on and off stochastically, such that at each instant in time only a sparse subset of all molecules is in the on-state in which they can fluoresce. By now there is a whole plethora of stochastic switching mechanisms and suitable fluorescent labels [7] to enable studying subcellular structure and processes. Recording many frames (103–105) of blinking emitting single molecules thus provides a sequence of images of different random subsets of nearly all fluorescent emitters. The active emitters appear as well separated spots that can be identified and processed to provide their positions. The localization precision is on the order of with nph the number of detected photons (typically a few hundred to a few thousand). Assembling the localization data obtained from all frames (after proper processing) into one visualization of the final super-resolution image reveals details on the length scale of 10–100 nm.
The best resolution that can be achieved is generally limited by the total photon count from a single emitter and by the density of the emitters labeling the structure [8]. In a special case the resolution of a localization microscopy image can even further be improved by effectively increasing the labeling density on the structure at hand. Namely, if one images many identical copies of a structure or macro molecular complex, termed particle in the following, one can combine all imaged versions of these particles into one reconstruction. If these different imaged versions are properly aligned and added together (registered) this results in one single reconstruction that contains many more localizations than a single particle. Therefore this reconstruction has a much higher signal-to-noise ratio (SNR) than each individual image and thus a higher resolution.
The general idea to use averaging of identical particles to obtain higher resolution has been developed in the field of cryo electron microscopy (EM) single particle analysis (SPA) [9, 10, 11]. In this field typically very many (> 105) 2D projections of the electron potential of a macro molecular complex are imaged and combined. The complicated task there is first finding the 3D orientation from the 2D projections and then registering the particles before averaging.
Recently we have demonstrated the power of averaging of hundredths of super-resolution localization microscopy images of the same particle [12]. By imaging many copies of the nuclear pore complex (NPC) of Xenopus laevis oocyte and averaging 160,000 localizations of different and even incomplete labelled pores we could show the eight-fold symmetry of proteins around the NPC with unsurpassed SNR. Later this idea has been applied to unravel structural detail of the NPC in 2D [13, 14] and of HIV in 3D [15]. In principle this can be applied to a wider class of problems e.g. the Bruchpilot structure in Drosophila [16] or for DNA origami structures [17].
Apart from the common idea of averaging identical particles for increasing the SNR the cryo EM and localization microscopy imaging modalities are very different. In cryo EM structures are not stained or labelled but the electron-specimen scattering property (interaction potential) is imaged [18]. This results in a continuous intensity distribution on the (pixelated) detector. In localization microscopy not the structure itself but fluorescent labels are imaged. The labeling procedure itself is not 100% efficient, resulting in unoccupied potential binding sites for fluorophores. Furthermore, the detection process of single fluorescent emitters is hampered by noise and therefore some emitters will not be detected (false negatives) and dirt or background will be falsely detected as emitters (false positives). The actual distance between the labeling site and the position of the fluorophore can be up to several nanometers in a random direction, leading to a labeling ”blurring” of the structure[19].Another important difference is that typically each fluorescent molecule is not only imaged once (single activation event) but several times (ranging from 2–3 to more than 20) due to repeated activations [20, 21, 8]. This is the case even if spatially nearby localizations in consecutive time frames are combined. These numbers, however, are averages of distributions which depend on the photo-physics of the imaging and thus different fluorescent molecules result in a different number of actual localizations. Thus the relation between the fluorescent emitter density and the number of localizations is not given for a specific binding site and particle registration must take into account this complication. A final difference is that in effect a localization microscopy image is a collection of coordinate estimates with corresponding localization uncertainties. These coordinates do not naturally form a continuous image as in EM. In addition the localization uncertainties are anisotropic as typically the axial estimate is 3–4 times worse than the lateral [22]. The worse axial localization precision can in principle be compensated by averaging many particles of different orientations, even opening up the possibility for isotropic resolution improvement.
The above four major differences in image acquisition and contrast generation from cryo EM SPA and localization microscopy boils down to the fact that localizations cannot be interpreted as a continuous distribution (for EM the interaction potential). As a consequence the simple application of the registration techniques developed in SPA are far from optimal. These techniques rely mostly on cross-correlating continuous images. One could as a first step generate a localization image by representing each localization with a Gaussian blob with a width proportional to the estimated localization precision in the respective axial and lateral dimensions [2, 23]. Then the cross-correlation techniques could be applied, however, this approach would neglect the above considerations on the imaging formation. Already in [12] we therefore registered point sets from each particle onto a template of the nuclear pore complex (NPC). From EM studies it was known that the stained proteins on the NPC are distributed over a ring with an eightfold symmetry. Therefore, the template consisted out of eight binding sites equally distributed over a circle of unknown diameter. The particles were then registered by optimizing the sum of the distances from the measured localizations to the closest model point. This procedure resulted in a shift (x, y) and rotation (0 ≤ ϑ ≤ π/4) estimate for each particle with respect to the model. The strong prior knowledge about the structure from EM allowed a better registration, i.e. a higher SNR from the same number of particles compared to the case without a model.
The effect of using a template and the danger of generating a structure that is biased towards this template has been studied in the SPA community [24, 25]. Here a template is obtained by low-pass filtering of either a known structure from X-ray crystallography or a template obtained from the data itself. In either case, the low-pass filtering is essential to avoid a template bias. This approach, however, is not directly transferable to a model system of a point set. For this modality a template for registration could also be obtained from the data if the following is properly taken into account: i). We discuss the possibility of template free registration in the Discussion section below.
In the following we detail an approach suitable to register localization microscopy data onto a template. We start with a qualitative analysis of the performance of the registration on simulation data and then show results of 3D experimental data. We imaged Alexa 647 immuolabeled to the Nup133 protein in the NPC of Hela cells in a dual focus 3D localization microscopy setup. There is some indication that this protein could be expressed in the NPC on both sides of the nuclear envelope [26, 27]. The separation between these two sides should be on the order 50–100 nm, which should in principle be resolvable with our super-resolution setup.
2 Methods
2.1 3D registration of identical structures/particles
As mentioned before classical cross-correlation based strategies developed in EM single particle analysis bear problems to register 3D localization microscopy data. Therefore we devised the following approach. We start by identifying potential structures or particles that we want to register from a reconstructed 3D localization image. Identification of potential regions of interest containing single particles is typically done by cross-correlation with a (low-resolution) template or direct intensity based thresholding and segmentation depending on the signal-to-noise ratio of the data. All particles NP are then registered to one template particle specified by localizations x⃗t ∈ IR3 by maximizing the following merit expression per imaged particle specified by x⃗m ∈ IR3 with respect to the to-be-determined 3D rotation and shift transformation M:
| (1) |
The 3D transformation M has three translation parameters s⃗ = (sx, sy, sz)T and two rotation parameters ϑ,φ. The transformation is given by
| (2) |
with R a 3D rotation matrix. The subscript t refers to the template and m to the particle. There are nt and nm localizations in the template and in the particle to register. For the template we only use one localization per modeled binding site. The geometry of the template is specified by nt localizations at coordinates x⃗s,i and the particle by nm localizations at coordinates x⃗m,j respectively. The 3 × 3 covariance matrices Σ reflect the localization uncertainties σ in the different directions for the template and particle as . For the template we choose a high (isotropic) covariance matrix compared to the measured localizations in order to avoid bias towards the template shape. We incorporate the experimental constraints of the direction dependent localization uncertainty in the merit function by inclusion of the covariance matrix. Here the uncertainties for the particles are computed by the localization algorithm from the Fisher information matrix [28, 29]. The axial localization uncertainty is typically a factor 3–4 worse than the lateral [22]. Only for interferometric setups an isotropic uncertainty can be obtained [30].
For the actual implementation of the maximization a normalized quaternion representation [31] of the rotation is used to avoid discontinuous derivatives in Euler angle representation as is typically done in robotics. For maximization of eq.(1) the function fmincon from Matlab (The Mathworks Inc., Natick, MA) is used in combination with the constraint of a normalized quaternion. The double sum of eq.(1) is coded in C for speed. Finally before the merit function D is calculated the covariance matrix is checked for zeros to avoid singularity. If the covariance matrix contains singularities, it is regularized by adding a small positive constant before inversion.
The expression in eq.(1) is a simplified form of the Bhattacharyya distance [32]. This distance measure is used in the field of statistical pattern recognition to measure the similarity of normally distributed multivariant point sets specified by a mean and standard deviation [33, 34]. It is suited to deal with different numbers of localizations per binding site and explicitly takes into account the anisotropic localization uncertainty common to most 3D imaging techniques. The exponential term in the distance measure makes sure that registration of particles with different number of labelled sites does not result in an intermediate optimum. With that we mean the following. Imaging you try to match particles with five underlying labeling sites, but one time four are occupied while the other time five. Now a classical EM matching would register the four site particle in such a way that minimizes the sum distance to all five sites, but would not overlay four sites correctly on top of each other and leave one site empty. There are many different distance measures such as the Kullback-Leibler or Jensen-Shannon distance [32]. We choose the Bhattacharyya after evaluating a few from [32] that we expected to be able to deal with the problem of anisotropic localization uncertainty (via the covariance matrix) and with missing labels by strongly penalizing long distance matches (via an exponential term).
2.1.1 Simulation setup
We want to assess how well we can register particles depending on various experimental parameters. To this end we simulated a very simplified 3D particle consisting of a cube with binding sites at the eight corners of the cube. The quality of the registration and therefore the quality and resolution of the final reconstructed particle is influenced by the number of localizations per binding site, the axial and lateral localization uncertainty, the number of binding sites that are not labelled and of course the structure itself. We tested initially an edge length of 100 nm. We ran the same set of simulations for an icosahedron with binding sites on the vertices, i.e. a polyhedron with 20 equal triangular faces, 30 edges (edge length 100 nm) and 12 vertices. Unless otherwise stated we used the following parameters for the simulations: on average 80 localizations per binding site, a lateral localization uncertainty σxy = 10 nm, and an axial localization uncertainty σz = 40 nm and 1000 registered particles. Please note that under binding site we here understand a site that is smaller than about σxσyσz in volume. It can thus contain a multitude of fluorophores, e.g. via secondary antibody labeling.
In Fig. 1 we outline the simulation procedure. A cube with eight binding sites at the corners (of which some may be unoccupied) is randomly rotated in 3D with random Roll-Pitch-Yaw angles [35] producing uniform sampling of particle orientations. Then simulated localization are added which are drawn from a normal distribution with corresponding localization uncertainty. These localizations are registered by optimizing the merit function of eq.(1).
Figure 1.

Illustration of our simulation setup. A cube with up to eight occupied binding sites and edge length of 100 nm is used as a model particle. The cube is randomly rotated in 3D before adding localizations obeying the respectively localization uncertainties.
2.2 3D imaging of Nup133 in the nuclear pore complex
Localization imaging of the Nup133 protein was performed as follows. A dual focal plane setup is used to obtain 3D localizations as described previously[29]. An Olympus IX71 (Olympus America Inc.) base was used for illuminating the sample with a 637 nm laser (laser diode, HL63133DG, Thorlabs, and home built collimation optics). The filter setup uses a bandpass emission filter and beamsplitter cube (FF01-692/40-25, Semrock). The sample is imaged onto an EMCCD camera (iXon 897, Andor Technologies PLC.) with a physical pixel size of 16 μm. The back projected pixel size was 106.7 nm using a 150x objective lens (UAPON 150XOTIRF, Olympus America Inc.) with NA = 1.45. Frame exposure time was 10 ms. Only top views of the NPC were imaged. There were relatively little side views and we did not image them.
Hela cells were plated in 8 well chambers (Nunc). Cells were prepared as described in [13]. First, cells were fixed with a 2.4% PFA rinse followed by 0.4% Triton for 3 min. and then 2.4% PFA for 30 min. After two washes with 10 mM Tris buffer, the cells were incubated with Image-iT FX Signal Enhancer (LifeTechnologies) for 30 min followed by 0.5% Fish Skin Gelatin for 30 min to block nonspecific binding. Primary antibodies against Nup133 (Santa Cruz) were added at 10 μg/mL for 60 min., cells were washed and then incubated with 10 μg/mL Alexa647 labeled secondary antibody for 60 min. Finally, the cells were post-fixed with 4% PFA for 10 min. and washed with 10 mM Tris. All labeling steps were performed at room temperature. Just before imaging, cells were exchanged into imaging buffer consisting of 50 mM Tris, 10 mN NaCl, 10% glucose, 16 mM MEA, 14040 units catalase (C9322-1G, Sigma Aldrich) and 1688 units glucose oxidase (G2133-50 KU, Sigma Aldrich).
Particle averaging on the 3D data is performed as follows: 1) Regions of interest containing the NPCs are identified by template matching a 3D reconstruction of the super-resolution data with a spherical shell (38 nm < radius < 88 nm). 2) The orientation of the NPCs with respect to the optical axis is estimated from the shape of the nuclear envelope. The point set of each NPC is reoriented such that it is perpendicular to the optical axis. 3) All point clouds are then registered to a template. The template is a coarse synthetic representation of the NPC. In the merit function an eight-fold symmetry is imposed as seems valid by prior knowledge [27, 13]. In total 8796 NPCs were selected from 22 acquired datasets, with a total of ~ 3.5 · 106 localizations.
3 Results
3.1 Simulation results
In Fig. 2 we show the result of averages of 103 cube and icosahedron particles with eight and twelve binding sites, respectively. The final registered particle shows isotropic resolution although the the input particles did have a four times worse axial localization uncertainty. The lateral width of final reconstruction seems slightly above the initial lateral localization uncertainty of σxy = 10 nm. In Fig. 3 we show the influence of the localization precision σxy on the registration process. For the icosahedron test particle we altered the lateral localization uncertainty from 5% to 35% of the distance between binding sites (along a vertex). Here this characteristic length was dchar = 100 nm. We observe that the quality of the registration deteriorate fast as a function of σxy/dchar. For ratios larger than ~ 0.2–0.3 the registered particle does not resemble the initial particles and can be termed as not successful. Please note that in the case σxy = dchar/4 the axial localization precision is already equal to the characteristic distance in our simulation setup.
Figure 2.

Multiple iso-surface renderings of cube (8 binding sites) and icosahedron (12 binding sites) test particle after registration of 103 individual particle. Initial lateral localization uncertainty was 10 nm and axial was 40 nm. Top row: xy views on a 3D surface rendering of the registration, bottom row xz view.
Figure 3.
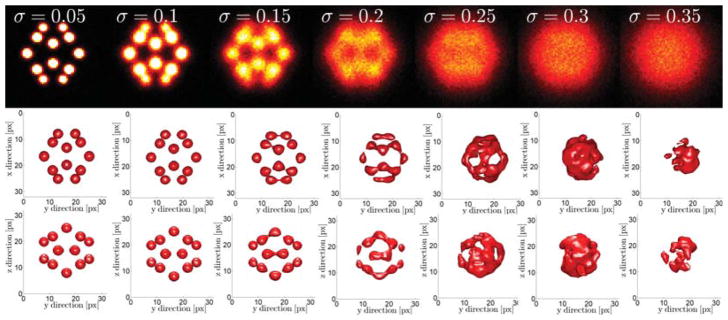
Registration performance as a function of the ratio of lateral localization precision and the distance between binding sites for an icosahedron. Axial localization uncertainty is four times as worse as the lateral one. The icosahedron is tilted with respect to the axis such that all 12 binding sites are visible. Top row: sum projections on the xy-plane. Middle row: 3D iso-surface rendering viewed in the xy-plane, bottom row: view from the yz-plane.
We also investigated if additional background localizations deteriorate the registration process (data not shown). As long as the number of background localizations stays about below half the number of foreground localizations registration is still possible, albeit with some larger error. Additionally we decreased the labeling on the cube and icosahedron simulation particles and studied the effect on the registration (data not shown). As expected the quality of the registered average decreases but registration is still feasible for about half the site unoccupied. Incomplete labeling can potentially even be beneficial for registration if the localization uncertainty is on the order of the characteristic length between binding sites. The reduced effective density then decreases thus ambiguity in the registration.
3.2 Nuclear pore complex imaging
In Fig. 4 we show a 3D dual focus localization image of some NPCs on the nuclear envelope. The height information is false color coded in the figure. The actual localization precision for these experiments is displayed in Fig. 5. The mean lateral localization uncertainty is 7.8 nm and the axial 32 nm, approximately 4 times larger. The results (of the part) of the registration pipeline are depicted in Fig. 6. In Fig. 7 we diplay the averaging results. The Nup133 protein is not resolved on both sides of the nuclear envelope. In order to correctly assess the radius of the average NPC, the distribution distances between the localization and the structure center is plotted in Fig. 8. The peak of this rotational average can be estimated very precisely because of the very large number of localizations, however, the peak position has to be corrected [36]. The correction is 0.5s2/R2, where s is the (fitted) standard deviation of the distribution and R the peak position. Using this correction we find a radius of 50.12 ± 0.19 nm (95% confidence interval). This value is consistent with the 50.1±0.2 nm reported by [13]. Please note that we used a different labeling strategy. The orientation of all used NPC was roughly the same as all came from bottom views of the nuclear membrane. If we would have had NPCs with all possible orientation we would also have expected a more isotropic resolution in Fig. 6.
Figure 4.

3D super-resolution histrogram of a HeLa cell nucleus, NUP133 labeled with Alexa647, color indicates axial depth. Scale bar a) equals 1μm. Scale bar b) equals 500 nm. Scale bar c) equals 250 nm.
Figure 5.

Distribution of localization uncertainties from all ~ 3.5 · 106 localizations from 8756 NPCs. The values are computed from the data via the Fisher-information matrix [28, 29].
Figure 6.
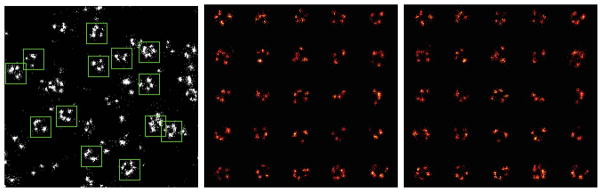
Registration pipeline (all xy-projections). a) A zoom in of the actual localization data. The green squares (size 120 nm) indicate automatically detected regions of interest (ROI) containing NPC structures, b) Cut out from ROIs before registrations, c) The same NPCs as in b) but now after registration.
Figure 7.

Average NPC reconstruction from 8756 individual NPCs. a) Projection of the data onto the xy-plane. b) Projection of the data onto the xz-plane. c,d) Multiple iso-surface renderings seen from the xy and xz plane respectively.
Figure 8.

Rotational projection of the distribution of registered localization. Estimated radius of the average NPC is 50.12 ± 0.19 nm. A slight bias of the peak position from the rotational average of the distribution is corrected for [36].
4 Discussion & Outlook
From the preliminary evaluation of the simulations we concluded that the localization precision must be smaller than the characteristic length between binding sites in order to allow successful registration. In our earlier work [8] we found that the localization precision must obey σ < dchar/4 in order to still have a realistic labeling density. This factor of 1/4 for generic structures was derived without any prior knowledge of the structure and stemmed purely from resolution considerations. Prior knowledge can help to restrict the registration and lower this bound, but probably not significantly. Earlier we investigated the resolution of a periodic line-structure with a cosine like intensity distribution and a period dchar. To resolve this structure we computed the required labeling density ρ for a given localization precision σ (compare [8, eq.(S.41)] and found for the dependency of the labeling density . This dependency is very steep on the ratio σ/dchar. E.g. σ/dchar = 1 already increases the exponential factor to ~ 1017! Realistic minimum labeling densities arise only for σ/dchar < 1/4. And we concluded that the minimum resolution is of the order of the localization uncertainty. Please note that averaging of particles only increases the density linearly while the required density rises exponentially to resolve structure in the case dchar < σ. This consideration shows how important the localization precision is for the registration process and that imaging more particles does not have the same benefit as in cryo EM SPA necessarily [37, 38]. A detailed study on the influence of the different parameters governing the quality of the registration has to be performed but is time consuming as many parameters need to be varied and evaluated. To achieve these desired labeling and then localization densities in practice is another issue. If the labeling densities and the switching kinetics are not matched properly, the emitters in the on-state will not be isolated anymore on average and the localization algorithm might reject them or will give false positions estimates[39, 40, 41].
Three-dimensional super-resolution imaging of the Nup133 protein in Hela cells did not show a double layer as suspected [27]. We are, however, not sure if this can be attributed to the fact that there are really not two layers or that the fluorescent staining was not successful on both sides of the nuclear envelope. The optical sectioning capability in our experiments would have been sufficient for resolving them.
Template based matching always has the potential problem of introducing a template bias. There are a number of template free alignment procedures. The most suitable for the tasks here seem pyramid and concurrent registration [10]. In the former particles are pairwise registered to each other in a pyramid or tree like structure, see Fig. 9 for an illustration of the procedure. The number of required registration steps scales quadratically with the number of particles and is therefore very slow for realistic number of particles (> 103). Another method is concurrent registration where all particles are registered to all particles simultaneously. This can be achieved by extending eq. (1) by a summation over all particle pairs
Figure 9.

Illustration of a pyramid registration scheme. Pairs of particles are registered to each other and combined to form the next layer of the pyramid. The process is repeated until one particle remains which is the final average. This procedure scales quadratically with the number of particles.
| (3) |
where N is the total number of particles and the superscripts ℓ and k indicate different particles. The summation over the number of points per particle i, j is here omitted for clarity. Clearly this approach is even more demanding on the computation power than the pyramid approach and we therefore foresee that template based registration will be used mostly for practical reasons.
Assessing the resolution improvement by averaging is in cryo EM SPA typically done by evaluating the Fourier Shell Correlation (FSC) for different number of particles in the average. In general our recently introduced image resolution measure for optical nanoscopy based on the Fourier Ring correlation [8] is also suitable to do this. Care must be taken, however, not to overestimate the resolution [42]. The registration process has to be applied to half the particles twice with different templates independently. Only so one assures that the data is truly independent and not spurious correlations are introduced which overestimate the resolution via a correlation measure [42]. If the particles consist not out of a more-or-less continuous structure with a large number of potential labeling sites, but are defined by a limited number of molecules as is the case for the NPC, other resolution measures might be more suitable [43].
Another exciting topic that emerged in the last years in the cryo EM field is called subtomogram averaging [44, 45]. The main point here is that not only identical purified particles can be imaged at high resolution as in SPA but particles in a cellular context that only need to be partly similar. In a 3D reconstruction only similar subparts of particles are identified and these parts are averaged. All subparts are then combined into one overall high resolution average. We anticipate that this concept can also be applied to localization microscopy in the future. In cryo EM SPA and subtomogram averaging some efforts have been made to address the two important practical questions: i) how many particles do I need to obtain a certain resolution and ii) what are the resolution limiting factors [37, 25, 38]. To transfer these results after adopting of the appropriated methodology will be a viable but substantial task of future research.
Acknowledgments
This work was supported by NIH R01R01GM100114 (D.S.L.), NSF CAREER #0954836 (K.A.L.) and the NewMexico Spatiotemporal Modeling Center (NIH P50GM0852673). R.P.J.N. is supported by the Dutch Technology Foundation STW, which is part of the Netherlands Organisation for Scientific Research (NWO) and which is partly funded by the Ministry of Economic Affairs, Agriculture and Innovation.
References
- 1.Lidke KA, Rieger B, Jovin TM, Heintzmann R. Superresolution by localization of quantum dots using blinking statistics. Optics Express. 2005;13(18):7052–7062. doi: 10.1364/opex.13.007052. [DOI] [PubMed] [Google Scholar]
- 2.Betzig E, Patterson GH, Sougrat R, Lindwasser OW, Olenych S, Bonifacino JS, Davidson MW, Lippincott-Schwartz J, Hess HF. Imaging intracellular fluorescent proteins at nanometer resolution. Science. 2006;313:1643–1645. doi: 10.1126/science.1127344. [DOI] [PubMed] [Google Scholar]
- 3.Rust MJ, Bates M, Zhuang XW. Sub-diffraction-limit imaging by stochastic optical reconstruction microscopy (STORM) Nature Methods. 2006;3(10):793–795. doi: 10.1038/nmeth929. [DOI] [PMC free article] [PubMed] [Google Scholar]
- 4.Hess ST, Girirajan TPK, Mason MD. Ultra-high resolution imaging by fluorescence photoactivation localization microscopy. Biophysical Journal. 2006;91(11):4258–4272. doi: 10.1529/biophysj.106.091116. [DOI] [PMC free article] [PubMed] [Google Scholar]
- 5.Egner A, Geisler C, von Middendorff C, Bock H, Wenzel D, Medda R, Andresen M, Stiel AC, Jakobs S, Eggeling C, Schönle A, Hell SW. Fluorescence nanoscopy in whole cells by asynchronous localization of photoswitching emitters. Biophysical Journal. 2007;93(9):3285–3290. doi: 10.1529/biophysj.107.112201. [DOI] [PMC free article] [PubMed] [Google Scholar]
- 6.Heilemann M, van de Linde S, Schüttpelz M, Kasper R, Seefeldt B, Mukherjee A, Tinnefeld P, Sauer M. Subdiffraction-resolution fluorescence imaging with conventional fluorescent probes. Angewannte Chemie. 2008;47(33):6172–6176. doi: 10.1002/anie.200802376. [DOI] [PubMed] [Google Scholar]
- 7.Klein T, Proppert S, Sauer M. Eight years of single-molecule localization microscopy. Histochem Cell Biology. 2014 doi: 10.1007/s00418-014-1184-3. [DOI] [PMC free article] [PubMed] [Google Scholar]
- 8.Nieuwenhuizen RPJ, Lidke KA, Bates M, Leyton Puig D, Grünwald D, Stallinga S, Rieger B. Measuring image resolution in optical nanoscopy. Nature Methods. 2013 Jun;10(6):557–562. doi: 10.1038/nmeth.2448. [DOI] [PMC free article] [PubMed] [Google Scholar]
- 9.Frank J. Three-Dimensional Electron Microscopy of Macromolecular Assemblies. 2. Oxford University Press; 2006. [Google Scholar]
- 10.Frank J. Single-particle reconstruction of biological macromolecules in electron microscopy - 30 years. Quaterly Reviews of Biophysics. 2009;42(3):139–158. doi: 10.1017/S0033583509990059. [DOI] [PMC free article] [PubMed] [Google Scholar]
- 11.van Heel M, Gowen B, Matadeen R, Orlova EV, Finn R, Pape T, Cohen D, Stark H, Schmidt R, Schatz M, Patwardhan A. Single-particle electron cryo-microscopy: towards atomic resolution. Quarterly Review of Biophysics. 2000;33(4):307–369. doi: 10.1017/s0033583500003644. [DOI] [PubMed] [Google Scholar]
- 12.Löschberger A, van de Linde S, Dabauvalle MC, Rieger B, Heilemann M, Krohne G, Sauer M. Super-resolution imaging visualizes the eightfold symmetry of gp210 proteins around the nuclear pore complex and resolves the central channel with nanometer resolution. Journal of Cell Sciences. 2012;125(3):570–575. doi: 10.1242/jcs.098822. [DOI] [PubMed] [Google Scholar]
- 13.Szymborska A, Marco N, de Daigle A, Cordes VC, Briggs JAG, Elllenberg J. Nuclear pore scaffold structure analyzed by super-resolution microscopy and particle averaging. Science. 2013;341:655–658. doi: 10.1126/science.1240672. [DOI] [PubMed] [Google Scholar]
- 14.Löschberger A, Franke C, Krohne G, van de Linde S, Sauer M. Correlative super-resolution fluorescence and electron microscopy of the nuclear pore complex with molecular resolution. Journal of Cell Science. 2014 doi: 10.1242/jcs.156620. [DOI] [PubMed] [Google Scholar]
- 15.van Engelenburg SB, Shtengel G, Sengupta P, Waki K, Jarnik M, Ablan SD, Freed EO, Hess HF, Lippincott-Schwartz J. Distribution of ESCRT machinery at HIV assembly sites reveals virus scaffolding of ESCRT subunits. Science. 2014;343:653–656. doi: 10.1126/science.1247786. [DOI] [PMC free article] [PubMed] [Google Scholar]
- 16.Ehmann N, van de Linde S, Alon A, Laschenko D, Keung XZ, Holm T, Rings A, DiAntonio A, Hallermann S, Ashery U, Heckmann M, Sauer M, Kittel RJ. Quantitative super-resolution imaging of Bruchpilot distinguishes active zone states. Nature Communications. 2014 doi: 10.1038/ncomms5650. [DOI] [PMC free article] [PubMed] [Google Scholar]
- 17.Schmied JJ, Raab M, Forthmann C, Pibiri E, Wünsch B, Dammeyer T, Tinnefeld P. DNA origami-based standards for quantitative fluorescence microscopy. Nature Protocols. 2014;9(6):1367–1391. doi: 10.1038/nprot.2014.079. [DOI] [PubMed] [Google Scholar]
- 18.Vulovic M, Ravelli RBG, van Vliet LJ, Koster AJ, Lazic I, Lücken U, Rullgårgd H, Öktem O, Rieger B. Image formation modeling in cryo electron microscopy. Journal of Structural Biology. 2013;183(1):19–32. doi: 10.1016/j.jsb.2013.05.008. [DOI] [PubMed] [Google Scholar]
- 19.Ries J, Kaplan C, Platonova E, Eghlidi H, Ewers H. A simple, versatile method for GFP-based super-resolution microscopy via nanobodies. Nature Methods. 2012;9(6):582–587. doi: 10.1038/nmeth.1991. [DOI] [PubMed] [Google Scholar]
- 20.Dempsey GT, Vaughan JC, Chen KH, Bates M, Zhuang X. Evaluation of fluorophores for optimal performance in localization-based super-resolution imaging. Nature Methods. 2011;8(12):1027–1031. doi: 10.1038/nmeth.1768. [DOI] [PMC free article] [PubMed] [Google Scholar]
- 21.Annibale P, Vanni S, Scarelli M, Rothlisberger U, Radenovic A. Identification of clustering artifacts in photoactivated localization microscopy. Nature Methods. 2011;8(7):527–528. doi: 10.1038/nmeth.1627. [DOI] [PubMed] [Google Scholar]
- 22.Rieger B, Stallinga S. The lateral and axial localization uncertainty in super-resolution light microscopy. Chem Phys Chem. 2014;15(4):664–670. doi: 10.1002/cphc.201300711. [DOI] [PubMed] [Google Scholar]
- 23.Nieuwenhuizen RPJ, Stallinga S, Rieger B. Cell Membrane Nanodomains: from Biochemistry to Nanoscopy. Taylor and Francis; 2014. chapter Visualization and Resolution in Localization Microscopy. [Google Scholar]
- 24.Liao HY, Frank J. Definition and estimation of resolution in single-particle reconstructions. Structure. 2010 Jul;18(7):768–775. doi: 10.1016/j.str.2010.05.008. [DOI] [PMC free article] [PubMed] [Google Scholar]
- 25.Kudrayashev M, Castano-Diez D, Stahlberg H. Limiting factors in single particle cryo electron tomography. Computational and Structural Biotechnology Journal. 2012;1(2):e201207002. doi: 10.5936/csbj.201207002. [DOI] [PMC free article] [PubMed] [Google Scholar]
- 26.D’Angelo MA, Hetzer MW. Structure, dynamics and function of nuclear pore complexes. Trends in Cell Biology. 2008;18(10):456–466. doi: 10.1016/j.tcb.2008.07.009. [DOI] [PMC free article] [PubMed] [Google Scholar]
- 27.Huy Bui K, van Appen A, DiGuilio AL, Ori A, Sparks L, Mackmull M-T, Bock T, Hagen W, Andres-Pons A, Glavy JS, Beck M. Integrated structural analysis of the human nuclear pore complex scaffold. Cell. 2013;155(6):1233–1243. doi: 10.1016/j.cell.2013.10.055. [DOI] [PubMed] [Google Scholar]
- 28.Smith CS, Joseph N, Rieger B, Lidke KA. Fast, single-molecule localization that achieves theoretically minimum uncertainty. Nature Methods. 2010;7(5):373–375. doi: 10.1038/nmeth.1449. [DOI] [PMC free article] [PubMed] [Google Scholar]
- 29.Liu S, Kromann EB, Krueger WD, Bewersdorf J, Lidke KA. Three dimensional single molecule localization using a phase retrieved pupil function. Optics Express. 2013;21(24):29462–29487. doi: 10.1364/OE.21.029462. [DOI] [PMC free article] [PubMed] [Google Scholar]
- 30.Shtengel G, Galbraith JA, Galbraith CG, Lippincott-Schwartz J, Gillette JM, Manely S, Sougrat R, Waterman CM, Knachanawong P, Davidson MW, Fetter RD, Hess HF. Interferometric fluorescent super-resolution microscopy resolves 3d cellular ultrastructure. Proceeding of the National Academy of Science USA. 2009;106(9):3125–3130. doi: 10.1073/pnas.0813131106. [DOI] [PMC free article] [PubMed] [Google Scholar]
- 31.Horn BKP. Closed-form solution of absolute orientation using unit quaternions. Journal of the Optical Society of America A. 1987;4(4):629–642. [Google Scholar]
- 32.Cha SH. Comprehensive survey on distance/similarity measures between probability density functions. International Journal of Mathematical Models and Methods in Applied Sciences. 2007;4(1):300–307. [Google Scholar]
- 33.Theodoridis S, Koutroumbas K. Pattern Recognition. 2. Elsevier; 2009. [Google Scholar]
- 34.Pekalska E, Duin RPW. The Dissimilarity Representation for Pattern Recognition. Foundations and Applications. World Scientific; Singapore: 2005. [Google Scholar]
- 35.Kuffner JJ. IEEE International Conference on Robotics and Automation. New Orleans, USA: Apr, 2004. Effective sampling and distance metrics for 3d rigid body path planning; pp. 3993–3998. [Google Scholar]
- 36.van Vliet LJ, Verbeek PW. Edge localization by MoG filters: Multiple-of-Gaussians. Pattern Recognition Letters. 1994;15(5):485–496. [Google Scholar]
- 37.Rosenthal PB, Henderson R. Optimal determination of particle orientation, absolute hand, and contrast loss in single-particle electron cryomicroscopy. Journal of Molecular Biology. 2003;333(4):721–745. doi: 10.1016/j.jmb.2003.07.013. [DOI] [PubMed] [Google Scholar]
- 38.Voortman LM, Vulovic M, Maletta M, Voigt A, Franken EM, Simonetti A, Peter P, van Vliet LJ, Rieger B. Quantifying resolution limiting factors in subtomogram averaged cryo-electron tomography using simulations. Journal of Structural Biology. 2014;187:103–111. doi: 10.1016/j.jsb.2014.06.007. [DOI] [PubMed] [Google Scholar]
- 39.Small AR. Theoretical limits on errors and acquisition rates in localizing switchable fluorophores. Biophysical Journal - Biophysical Letters. 2009;92(2):L16–L18. doi: 10.1016/j.bpj.2008.11.001. [DOI] [PMC free article] [PubMed] [Google Scholar]
- 40.van de Linde S, Wolter S, Heilemann M, Sauer M. The effect of photoswitching kinetics and labeling densities on super-resolution fluorescence imaging. Journal of Biotechnology. 2010;149:260–266. doi: 10.1016/j.jbiotec.2010.02.010. [DOI] [PubMed] [Google Scholar]
- 41.Sinko J, Kakonyi R, Rees E, Metcalf D, Knight AE, Kaminski CF, Szabo G, Erdelyi M. TestSTORM: simulator for optimizing sample labeling and image acquisition in localization based super-resolution microscopy. Biomedical Optics Express. 2014;5(3):778–787. doi: 10.1364/BOE.5.000778. [DOI] [PMC free article] [PubMed] [Google Scholar]
- 42.Scheres SHW, Chen S. Prevention of overfitting in cryo-EM structure determination. Nature Methods. 2012 Jul;9(9):853–854. doi: 10.1038/nmeth.2115. [DOI] [PMC free article] [PubMed] [Google Scholar]
- 43.Ram S, Ward ES, Ober RJ. Beyond Rayleighs criterion: A resolution measure with application to single-molecule microscopy. Proceedings of the National Academy of Sciences USA. 2006;103(12):4457–4462. doi: 10.1073/pnas.0508047103. [DOI] [PMC free article] [PubMed] [Google Scholar]
- 44.Briggs JA. Structural biology in situ - the potential of subtomogram averaging. Current Opinion in Structural Biology. 2013;23(2):261–267. doi: 10.1016/j.sbi.2013.02.003. [DOI] [PubMed] [Google Scholar]
- 45.Schur FKM, Hagen WJH, de Marco A, Briggs JAG. Determination of protein structure at 8.5 å resolution using cryo-electron tomography and sub-tomogram averaging. Journal of Structural Biology. 2013;184(3):394–400. doi: 10.1016/j.jsb.2013.10.015. [DOI] [PubMed] [Google Scholar]