

Abstract
Insulin-like growth factor-1 (IGF-1) is a multipromoter gene that has complex biological functions and plays an important role in Chinese sika deer antler cell differentiation and proliferation. microRNAs and their roles in deer antler growth have attracted much attention. In the present study, to investigate the effect of microRNAs on the regulation of IGF-1 during the rapid growth of antlers, miRNA GeneChip analysis and TargetScan Human software were used to screen microRNAs that bind to the 3′ untranslated region (3′UTR) of IGF-1. The results indicated that a significantly differential expression of miR-18b was observed in cartilage and mesenchymal of antler tip tissue and the presence of miR-18b-binding sites within the IGF-1 3′UTR. A miR-18b mimic was then transfected into antler cartilage cells to overexpress miR-18b and the expression levels were quantified by real-time PCR. Real-time PCR showed that the expression level of miR-18b in transfected cells was significantly increased compared with the control group (p<0.01). Dual luciferase assays revealed that miR-18b decreased the fluorescence value of the luciferase reporter gene in the group transfected with the wild-type vector of IGF-1 3′UTR. In contrast, the relative luciferase activity in the group transfected with the mutant vector of IGF-1 3′UTR did not change obviously. MTT assays and cell cycle analyses confirmed that overexpression of the miR-18b mimic inhibited the proliferation of cartilage cells. In contrast, transfection of a miR-18b inhibitor increased the cell proliferation rate. Furthermore, Western blot analyses revealed that overexpression of miR-18b mimics downregulated the protein levels of IGF-1, while IGF-1 expression increased after transfection of miR-18b inhibitors. Taken together, our findings show that miR-18b is a potentially novel target in deer antler cell proliferation. miR-18b may modulate IGF-1 expression of sika deer antler.
Introduction
Insulin-like growth factor-1 (IGF-1) is produced primarily by the liver as an endocrine hormone, as well as in target tissues, in a paracrine/autocrine manner. Approximately 98% of IGF-1 is bound to one of the six binding proteins (IGFBP). IGFBP-3, the most abundant of these proteins, accounts for 80% of all IGF binding (Jones and Clemmons, 1995; Kheralla et al., 2010). IGF-1 is a primary mediator of the effects of growth hormone (GH). The GH is released into the blood stream and then stimulates the liver to produce IGF-1 (Jing and Li, 2010). IGF-1 then stimulates systemic body growth and has growth-promoting effects on almost every cell in the body, especially skeletal muscle, cartilage, and bone (Laron, 2001; Govoni et al., 2005). In addition to the insulin-like effects, numerous studies have shown that the biological activation of IGF-1 plays various important roles in cell growth, embryonic differentiation, and cellular DNA synthesis (Panagakos, 1993; Werther et al., 1998; Zheng et al., 2002).
Deer antlers are a male secondary sexual characteristic and contain the fastest growing mammalian tissues. The timing of the antler cycle is controlled by the seasonal fluctuations of testosterone, and the actual growth of antlers is mainly stimulated by growth factors, including IGF-1 (Miller et al., 1995; Kierdorf et al., 2009). IGF-1 has been shown to increase the proliferation of the mesenchymal and cartilaginous cells in the antler growth zone in a dose-dependent manner. Therefore, the growth of deer antlers can be regulated obviously by IGF-1, which has a major promoting effect on the formation of cartilage (Francis and Suttie, 1998). Furthermore, the expression and localization of IGF-1 in the four antler parts (tip, upper, middle, and base) of the red deer (Cervus elaphus) have been extensively investigated (Gu et al., 2007). The mRNA expression level of IGF-1 decreases gradually from the top to the bottom of each antler; it is highest in cartilage and lowest in mesenchyme (Hu et al., 2011). Our understanding of IGF-1 has been limited mostly to its effects on antler development in red deer, roe deer (Capreolus capreolus), fallow deer (Dama dama), and pudu (Pudu puda).
The microRNAs are a class of short (21–24 nucleotides); they are noncoding RNA molecules that are evolutionarily conserved and function as negative regulators of gene expression (Ambros, 2004; Bartel, 2004). The involvement of microRNAs as novel regulators of a variety of biological processes in the cell, as well as their roles in diverse pathologies and physiologies, has been increasingly reported (He and Hannon, 2004; Tang et al., 2007; Long et al., 2010). Numerous studies of microRNA have revealed its role in a deeper gene expression regulation system, and even more studies have highlighted the important role of microRNA in network control systems (Stark et al., 2005; Tay et al., 2008). The precise regulation mechanism of IGF-1 in antler development might be through microRNAs.
Despite the important role of IGF-1 in antler proliferation and regeneration, the regulatory role of microRNAs on IGF-1 remains unknown. In this study, we investigated the role of microRNAs on IGF-1 expression in the proliferation environment using an integrated in vitro approach. The aim of the present study was to investigate the effect of microRNA-18b on the growth of deer antlers. We identified and validated miR-18b as an important regulator of IGF-1 in the deer antler cell proliferation in tissue.
Materials and Methods
Cell culture
Tissue samples of deer antler tip were obtained from a 4-year-old male sika deer (Cervus nippon) provided by the Jilin Agricultural University Deer Farm (Changchun, China). Cartilage tissues were isolated under a dissecting microscope. The tissues were homogenized and digested using collagenase I and hyaluronic acid for 1.5 h at 37°C. The tissues were then digested by adding collagenase II for 3 h at 37°C. Cartilage cells were cultured in Dulbecco's Modified Eagle's medium supplemented with 20% fetal bovine serum, 200 U/mL penicillin, and 100 U/mL streptomycin at 37°C under a 5% CO2 atmosphere. The study was approved by the ethics committee of the Institute of Life Sciences, Jilin Agriculture University (Changchun, China).
microRNA gene chip preparation and microRNA screening
After culturing mesenchymal and cartilage cells for 72 h, they were centrifuged and washed with phosphate-buffered saline (PBS), respectively. microRNA gene chips were synthesized by Beijing Boao Biological Co., Ltd. Data were analyzed using microRNA QC Tool 1 software to detect differentially expressed microRNAs between cartilage tissues and mesenchymal tissues of the antler tip. The signal value indicates microRNA expression abundance in antler tissues. The ratio of C/M shows the differential expression of microRNAs in cartilage cells and mesenchymal cells. Ratios of microRNA abundance between the two cell types that were more than double or less than half were considered to indicate differential expression. In addition, total RNA of mesenchymal and cartilage cells was isolated and then reverse-transcribed to cDNA with a stem-loop RT primer (RiboBio) for screening microRNAs. The relative expression levels of endogenous microRNAs screened in antler cells were further verified by real-time PCR. The results were calculated using the 2−ΔΔCt method.
Analysis of microRNA-binding sites in 3′ untranslated region of IGF-1
The wild-type sequences of 3′ untranslated region (3′UTR) of sika deer IGF-1 and its mutant were synthesized by Beijing Sunbiotech Co., Ltd. The software package Target Scan Human 5.1 was used to predict binding sites of the microRNA to the 3′UTR of IGF-1 and to identify highly conserved microRNAs with a high degree of sequence homology with the 3′UTR of IGF-1 and a stable secondary structure. The sequences of the 3′UTR of IGF-1 were analyzed to determine the binding sites for miR-18b seed sequences.
IGF-1 3′UTR luciferase reporter assay
To construct the luciferase reporter vector, the wild type of IGF-1 3′UTR sequence and its mutant acquired were cloned downstream of a cytomegalovirus promoter-driven firefly luciferase cassette in the pmiR-RB-Report™ vector, yielding pmiR-Report™-IGF-1-3′UTR. Dual luciferase reporter vectors of IGF-1 3′UTR contained the wild type or the mutant. The cells were transiently transfected with 50 ng of luciferase reporter plasmid (wild type or mutant) 5 pmol and miR-18b mimic using the X-tremeGENE HP transfection reagent. After culture for 24, 48, and 72 h, total cell protein was extracted. The luciferase activity was measured using the Dual-Luciferase Reporter Assay System (Promega) following the manufacturer's instructions. Data were normalized to the Photinus (firefly) luciferase activity.
Cell transfection
When the growth of cell is in good condition under the microscope, being in logarithmic phase, the trypsin solution is joined to the cell culture for digesting the cell and taking count of the number of cells. The density of cartilage cells was adjusted to approximately 1×10⁶ L−1. Next, cartilage cells were seeded into six-well plates and incubated overnight. Cells were divided into three groups: a normal group, a negative control group (i.e., cells transfected with a negative plasmid), and an experimental group (i.e., cells transfected with microRNA mimics or inhibitors). Each treatment was performed in triplicate wells for each group. When the cells reached a growth density greater than 80%, cells were transfected using the Roche HP transfection reagent (Roche) and then were incubated under a 5% CO2 atmosphere at 37°C.
Real-time quantitative PCR
After transfection with a miR-18b mimic for 24, 48, and 72 h, total RNA (including microRNA) was isolated and then reverse transcribed to cDNA with the stem-loop RT primer for miR-18b and the U6. For miR-18b analysis, the stem-loop RT primers were 5′-GCATCTCCAGCCTCCTCAGAT-3′ and 5′-GCGCTGGAATGTAAAGA AGTATGTAT-3′. PCR primers for the internal control U6 were 5′-TGACCCTTAAG TACCCCATCGA-3′ and 5′-TTGTAGAAGGTGTGGTGCCAGAT-3′. The relative expression levels were calculated using the 2−ΔΔCt method.
Cell proliferation assays
After culture for 24, 48, and 72 h, cell growth was measured using an MTT assay. In brief, the spent cell cultural medium was replaced with 0.1 mL fresh medium containing 0.5 mg/mL MTT. Cells were incubated at 37°C for 4 h, and then a bluish violet crystal precipitate was resolved by 0.1 mL DMSO (Sigma-Aldrich). The absorbance was measured at a wavelength of 570 nm.
Cell cycle analysis
At 24, 48, and 72 h post-transfection, cartilage cells were harvested and resuspended in PBS, fixed with 75% ice-cold ethanol at 4°C overnight, and then stained using 10% RNase A and 4% propidium iodide for 1 h at 37°C. Stained cells were detected by flow cytometry and data were analyzed using CellQuest software (Becton Dickinson).
Western blot analysis
At 24, 48, and 72 h post-transfection, cartilage cells were harvested; the total protein was extracted using the RIPA lysis buffer with 1 mM phenylmethyl sulfonylfluoride at 0°C. After mixing with a loading buffer, the protein was separated by 12% SDS-PAGE and transferred to polyvinylidene fluoride membranes. Nonspecific binding was blocked with 5% dried skim milk in a Tris-buffered saline and Tween-20 (TBST) mixture for 2 h. The membranes were then incubated with primary antibodies against IGF-1 (1:500) and GAPDH (1:1000) at 4°C overnight. After washing thrice with TBST, the membranes were incubated with appropriate secondary antibodies (1:2000) at 25°C for 2 h. After washing thrice with TBST, immunoreactive bands were visualized using enhanced chemiluminescence reagents. The densitometric data of groups were analyzed by Image-Pro Plus 6.0.
Statistical analyses
All data are presented as mean±SD. SPSS 12.0 statistics software (SPSS, Inc.) was used for all statistical analyses, and p-values <0.05 were considered to be statistically significant.
Results
Screening of microRNAs targeting the IGF-1 3′UTR
More than 5000 currently known microRNAs have been catalogued by Affymetrix microRNA GeneChip of antler tip tissues, including mesenchyme and cartilage; among them, we identified 158 microRNAs with obviously differential expression in mesenchymal and cartilage tissue. Furthermore, we used TargetScan Human 5.1 software to analyze microRNA-binding sites on the 3′UTR of IGF-1. Our results indicated that eight kinds of microRNAs may target the 3′UTR of IGF-1 and inhibit IGF-1 expression, including miR-18b, miR-16a, miR-26a, miR-152, miR-424, miR-130b, miR-365-3p, and miR-1. However, miR-365-3p does not belong to differentially expressed microRNAs between cartilage cells and mesenchymal cells (Table 1). We also found the most significant difference in miR-18b expression between cartilage tissues and mesenchymal tissues for screened microRNAs targeting IGF-1 3′UTR. Therefore, miR-18b was selected for investigation after the primary screen using TargetScan (www.targetscan.org). Meanwhile, the sequence of the 3′UTR of IGF-1 was analyzed, and binding sites for miR-18b seed sequences were identified (Fig. 1A). Real-time PCR analysis for endogenous microRNAs further verified this result (Fig. 1B). These data implicated that miR-18b was in the regulation of IGF-1 expression. Next, miR-18b would be investigated in deer antler cell proliferation after the primary screen.
Table 1.
Single Array Analysis of microRNAs Targeted to the 3′ Untranslated Region Sequence of Insulin-Like Growth Factor-1 in Antler Tissue
| miRNA name | Mesenchyme signal value | Cartilage signal value | C/M ratio | Sequence |
|---|---|---|---|---|
| miRNA-1 | 10.6704 | 23.9115 | 2.241 | UGGAAUGUAAAGAAGUAUGUAU |
| miRNA-16a | 112.984 | 260.714 | 2.307 | UAGCAGCACGUAAAUAUUGGUG |
| miRNA-18b | 53.9114 | 131.4962 | 2.439 | UAAGGUGCAUCUAGUGCAGUUA |
| miRNA-26a | 4534.898 | 10376.14 | 2.288 | UUCAAGUAAUCCAGGAUAGGCU |
| miRNA-152 | 1019.942 | 2274.004 | 2.229 | UCAGUGCAUGACAGAACUUGGG |
| miRNA-424 | 15.3830 | 31.2552 | 2.031 | CAGCAGCAAUUCAUGUUUUGA |
| miRNA-130b | 2536.25 | 1214.001 | 0.478 | CAGUGCAAUGAUGAAAGGGCAU |
Signal value indicates microRNA expression abundance in antler tissues. The ratio of C/M indicates the differential expression of microRNAs in cartilage cell and mesenchymal cell. Ratios of microRNA abundance between the two cell types that were more than double or less than half were considered to indicate differential expression.
FIG. 1.

Conservative analysis of the microRNA-binding sites in the 3′UTR of IGF-1. (A) microRNAs targeting the 3′UTR of IGF-1 were screened using a microRNA GeneChip to determine the microRNA content in cartilage and mesenchymal cells. Ratios of microRNA content between the two cell types that were more than double or less than half were considered to indicate differential expression. This figure shows the seed region sequence of miR-18b and its conserved target site in the 3′UTR of IGF-1, which was downloaded from the TargetScan website. Predicted miR-18b target sequences in the 3′UTR of IGF-1 are presented. (B) Comparison of microRNA fold changes. The relative quantitative results for endogenous microRNAs screened in cartilage and mesenchymal cells are shown. The U6 was used as an internal control. The results showed that the level of endogenous microR-18b was differentially expressed in cartilage and mesenchymal cells. Data are presented as the mean±SD (n=3). 3′UTR, 3′ untranslated region; IGF-1, insulin-like growth factor-1.
miR-18b regulates IGF-1 by binding its 3′UTR
microRNAs regulate the expression of target genes by binding to the 3′UTR of specific mRNAs and triggering mRNA degradation or translational repression. To confirm whether IGF-1 is a direct target of miR-18b in cartilage cells, we cloned a 510-bp fragment of the IGF-1 3′UTR containing the target sequence and its mutant into a luciferase reporter vector (Fig. 2A), and the effect of wild type or mutant on luciferase activity in transfected cartilage cells was analyzed. As shown in Figure 2B, compared with the negative control group, the relative luciferase activity of the wild-type IGF-1 3′UTR-transfected group decreased (p<0.05), with the lowest luciferase activity detected at 48 h after transfection. This evidence of the activity of the miR-18b mimic indicates that it obviously inhibited the fluorescence value of the luciferase reporter gene. This result validated this transfection system to be stable and efficient. Whereas the reduction of the luciferase activity with mutant IGF-1 3′UTR was not as sharp as that observed in the wild-type counterpart, suggesting that miR-18b could directly bind to the 3′UTR of IGF-1. Considered in combination, these results suggest the presence of miR-18b-binding sites within the IGF-1 3′UTR and that IGF-1 is a direct downstream target for miR-18b in cartilage cells.
FIG. 2.

IGF-1 is a direct target of microRNA-18b. (A) Schematic diagram of the IGF-1 3′UTR luciferase reporters with wild type or one target site mutated. Constructs were generated using PCR. The seed sequence is underlined and mutant site is in red font. (B) Relative luciferase activity analysis in cartilage cells. Sika deer cartilage cells were cotransfected with the recombination firefly luciferase reporter plasmid pmiR-RB-Report™-IGF-1-3′UTR (wild type or mutant), the scramble group, and miR-18b mimic as indicated. Following 24, 48, and 72 h, the activity of firefly luciferase was measured. Luciferase activity decreased compared with the control group in cells that were transfected with the wild type of IGF-1 3′UTR. Luciferase activity did not change obviously compared with the control group, in cells that were transfected with the mutant of IGF-1 3′UTR. Data are presented as the mean±SD (n=3). Similar results were found after three independent experiments. *p<0.05; **p<0.01 compared with the control.
Detection of expression level of miR-18b by real-time PCR
Subsequently, the expression level of miR-18b in cartilage cells was determined by real-time PCR analysis. Real-time PCR analysis showed that the expression level of miR-18b in transfected cells was significantly increased compared with the control group (p<0.01). As shown in Figure 2, miR-18b expression levels were higher at 48 h after transient transfection compared with the levels detected at 24 and 72 h. This result indicated successful miR-18b transfection of cartilage cells; therefore, miR-18b would be conducted in the following tests (Fig. 3).
FIG. 3.

miR-18b content increased markedly following transfection. The relative quantitative results for the content of miR-18b in cartilage cells following transfection for 24, 48, and 72 h are shown. The U6 gene was used as a loading control. The content of miR-18b in the cartilage cells increased markedly compared with that of the control cells and untransfected cells. Data are presented as the mean±SD (n=3). Similar results were found in three independent experiments. **p<0.01 compared with the control. NG, normal group.
Restoration of miR-18b inhibits cartilage cell growth
The effects of miR-18b transfection on cartilage cell proliferation were investigated using MTT assays at 24, 48, and 72 h post-transfection. Compared with the control group, antler cells exhibited significantly decreased proliferation at 48 h after miR-18b mimic transfection (p<0.01; Fig. 4). Therefore, antler cartilage cell proliferation was inhibited obviously by mimics of miR-18b. In contrast, transfection of antler cells with the miR-18b inhibitor resulted in a time-dependent increase in cell proliferation compared with the control group (p<0.01, Fig. 4), further verifying the important role that miR-18b plays in promoting deer antler growth. These results indicate conclusively that antler cartilage cell proliferation is regulated by miR-18b.
FIG. 4.

miR-18b inhibits cartilage cell growth. Cartilage cells were transfected with the negative scramble control, microRNA-18b mimic, or inhibitor as indicated. The rate of cell inhibition was measured at the indicated times post-transfection using an MTT assay. Compared with the control, cell inhibition decreased after 24, 48, and 72 h, in cells that were transfected with miR-18b mimic. Also, cell inhibition increased after 24, 48, and 72 h in cells that were transfected with the miR-18b inhibitors compared with the control. Data are presented as the mean±SD (n=3). Similar results were found in three independent experiments. *p<0.05; **p<0.01, compared with the control.
To further determine the effect of miR-18b on cartilage cells, cell cycle analyses were performed. As shown in Figure 5, in cartilage cells, significant slowing in the cell cycle was induced by miR-18b, and an increase in the cell cycle was induced by a miR-18b inhibitor. The cell numbers at G1 phase and G2 phase were significantly increased following transfection with a miR-18b mimic (p<0.05), whereas the miR-18b inhibitor had the opposite effect compared with the control group. At the same time, the cell numbers at S phase were decreased by the miR-18b mimic and increased by the miR-18b inhibitor (p<0.05). Together, these results demonstrate that miR-18b acts to inhibit antler cell proliferation directly and dramatically.
FIG. 5.

miR-18b affects cell cycle distribution. After 24, 48, and 72 h, the cultured cell medium was replaced with a fresh serum-free medium. Cell cycle analysis was conducted at the indicated times postserum deprivation. Cell cycle analysis revealed that a miR-18b mimic prevented cartilage cells from entering S phase. The percentage of cells in G1 was higher compared with the control, and the percentage of cells in S phase was lower compared with the control. Meanwhile, the percentage of cells in S phase that were transfected with a miR-18b inhibitor was higher compared with the control. Data are presented as the mean±SD (n=3). Similar results were found in three independent experiments. *p<0.05, compared with the control.
Western blot analysis of IGF-1 protein levels
Western blotting assays showed that, with the miR-18b mimic, IGF-1 expression was markedly decreased compared with the negative control following transfection of antler cells. With the miR-18b inhibitor, IGF-1 expression increased following transfection of antler cells. Furthermore, these effects occurred in a time-dependent manner (Fig. 6). The analysis of densitometric data is consistent with the results of electrophoresis (Table 2)
FIG. 6.
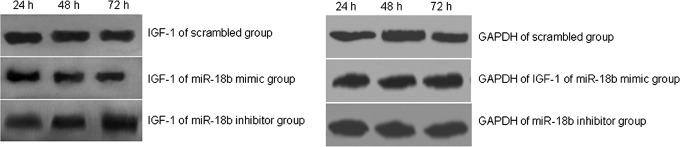
Western blotting analysis of the effect of the microRNA mimic or inhibitor on the expression of IGF-1 protein. miR-18b inhibited the expression of IGF-1 protein. The expression of IGF-1 protein and GAPDH in sika deer cartilage cells was determined using Western blot analysis. Protein levels of IGF-1 decreased compared with the control group following 24, 48, and 72 h in cells that were transfected with the miR-18b mimic. Protein levels of IGF-1 increased compared with the control group transfected with the miR-18b inhibitor. Each panel includes three lanes and indicates the change of IGF-1 protein expression level after transfection for 24, 48, and 72 h. Primary antibodies against IGF-1 for the scrambled group, miR-18b mimics, and miR-18b inhibitor are rabbit polyclonal anti-IGF-1 antibodies. The primary antibody against GAPDH is the rabbit polyclonal anti-GAPDH antibody. Secondary antibodies are all goat anti-rabbit IgG-HRP conjugated.
Table 2.
The Analysis of Densitometric Data for Insulin-Like Growth Factor-1 Expression Level After Transfection with Mimic or Inhibitor
| Group | 24 h after transfection | 48 h after transfection | 72 h after transfection |
|---|---|---|---|
| IGF-1 of scrambled group | 1310 | 1298 | 1207 |
| GAPDH of scrambled group | 1633 | 1639 | 1624 |
| IGF-1 of miR-18b mimic group | 1035 | 825 | 672 |
| GAPDH of miR-18b mimic group | 1618 | 1629 | 1637 |
| IGF-1 of miR-18b inhibitor group | 1249 | 1473 | 1685 |
| GAPDH of miR-18b inhibitor group | 1642 | 1632 | 1638 |
Discussion
A large number of studies have confirmed that IGF-1 is one of the important cytokines that promotes the rapid growth of cartilaginous tissue. When the expression of IGF-1 is inhibited, cell proliferation is influenced (Yu et al., 2008; Li et al., 2012). In this study, we used the Affymetrix microRNA GeneChip technology to detect mRNA expression in the cartilage and mesenchyme of sika deer antler. The known levels of endogenous microRNA expression were observed. More than 158 microRNAs with differential expression were identified. For our investigation, we selected miR-18b because the results of microRNA GeneChip analysis indicated that significantly differential expression of miR-18b was observed in the cartilage and mesenchyme of antler tip tissue. Subsequently, using Target ScanHuman 5.1 bioinformatics software, we predicted seven kinds of microRNA seeding sequences in the 3′UTR area of IGF-1, including miR-18b. miR-18b is also highly expressed and plays an important regulatory role in processes such as mesenchymal stem cell proliferation and differentiation (Liu et al., 2013).
Then, antler cells were cotransfected using the luciferase reporter gene vector, including the wild type of IGF-1 3′UTR or its mutant, and miR-18b mimics. The results of dual luciferase assay revealed that miR-18b inhibited the fluorescence activity in the group transfected with the wild type of IGF-1 3′UTR. Therefore, the transfection system used was stable and effective. In contrast, the relative luciferase activity in the group transfected with the mutant of IGF-1 3′UTR did not change obviously. These results prove that miR-18b can bind to the 3′UTR of IGF-1, which is the binding site of miRNA to IGF-1. miR-18b mimics can form a complementary combination in the IGF-1 3′UTR area.
MicroRNA mimics are chemically synthesized mimics of mature microRNAs that simulate the role of endogenous microRNAs after being transfected into cells. miR-18b and the mimics have the same sequence and the mimics are double-stranded RNA. This procedure provides a simple and efficient tool for microRNA research. With the transfection of mimics, microRNA can be transiently overexpressed. The mimics can ensure that the antisense strand of microRNA combines with the RISC complex first. Thus, gain-of-function research can be conducted. In contrast, chemically synthesized and specially modified microRNA inhibitors can specifically combine with mature microRNAs and inhibit their role. That is, the endogenous microRNA might also be targeted by inhibitors, increasing the expression level of protein. Thereby, a loss-of-function research can be conducted. In this study, when mimics of miR-18b were transfected into antler chondrocytes, the expression levels of miR-18b were detected by qPCR. Compared to the control, the expression levels of miR-18b increased, indicating that mimics of miR-18b can be stably and efficiently expressed in cells. The results of qPCR also validated the accuracy of miR-18b in expression profiles of microRNA microarray.
The MTT assay was used to detect the growth curve of antler cells transfected with a miR-18b mimic and a miR-18b inhibitor, respectively. Our results indicate that the speed of antler chondrocyte cell proliferation transfected with a miR-18b mimic slowed down, while the speed of cell proliferation in cells transfected with a miR-18b inhibitor increased. Furthermore, we found that cell cycle distribution was adversely affected by miR-18b expression in cartilage cells. The percentage of cells in S phase is an important indicator of proliferation; lower percentages of cells in S phase reflect low levels of proliferation. Flow cytometry analysis revealed that transfection with a miR-18b mimic resulted in a reduced number of cells in S phase, while the opposite effect was observed following transfection with the miR-18b inhibitor. These data indicate that miR-18b effectively interferes with antler cell mitosis. Then, overexpression of miR-18b could suppress antler cartilage growth. Western blotting assays further suggested that the expression level of IGF-1 in groups of miR-18b mimics decreased and, as time increased, the amount of protein was gradually reduced. In contrast, the expression level of IGF-1 in the experimental group in which cells were transfected with inhibitors of miR-18b increased. Indeed, the expression level of IGF-1 would be regulated by microRNAs and effecting on cell development. Liu et al. (2012) showed that miR-1 and miR-206 likely play the regulation role in the expression of the IGF-1 gene in mice. IGF-1 has the activity of activating RNA polymerase and increases the level of mRNA and thereby stimulates to synthesize RNA or DNA and to promote the growth and differentiation of cell. Thus, miR-18a could regulate IGF-1 expression by binding to the 3′UTR of IGF-1 and further influence antler growth.
In summary, our results suggest that miR-18b can regulate the expression of the IGF-1 gene of sika deer antler; thus, miR-18b may participate in the antler regeneration and growth process. We intend to further prove the important regulatory effect of IGF-1 on the rapid growth of antlers by microRNA technology in our future studies. This study is the first investigation of the regulating effect of miR-18b on the expression of the IGF-1 gene in sika deer antler cells, but the detailed regulatory mechanisms are yet to be elucidated.
Acknowledgments
This project was supported by grants from the National Natural Science Foundation of China (No. 30972083). This work was performed by the Jilin Provincial Science Technology Development Foundation of China (No. 20090574).
Disclosure Statement
No competing financial interests exist.
References
- Ambros V. (2004). The functions of animal microRNAs. Nature 431,350–355 [DOI] [PubMed] [Google Scholar]
- Bartel D.P. (2004). MicroRNAs: genomics, biogenesis, mechanism, and function. Cell 116,281–297 [DOI] [PubMed] [Google Scholar]
- Francis S.M., and Suttie J.M. (1998). Detection of growth factors and proto-oncogene mRNA in the growing tip of red deer (Cervus elaphus) antler using reverse-transcriptase polymerase chain reaction (RT-PCR). J Exp Zool 281,36–42 [DOI] [PubMed] [Google Scholar]
- Govoni K.E., Baylink D.J., and Mohan S. (2005). The multi-functional role of insulin-like growth factor binding proteins in bone. Pediatr Nephrol 20,261–268 [DOI] [PMC free article] [PubMed] [Google Scholar]
- Gu L., Mo E., Yang Z., Zhu X., Fang Z., Sun B., Wang C., Bao J., and Sung C. (2007). Expression and localization of insulin-like growth factor-I in four parts of the red deer antler. Growth Factors 25,264–279 [DOI] [PubMed] [Google Scholar]
- He L., and Hannon G.J. (2004). MicroRNAs: small RNAs with a big role in gene regulation. Nat Rev Genet 5,522–531 [DOI] [PubMed] [Google Scholar]
- Hu W., Meng X., Tian Y., and Liu N. (2011). Cloning of a full-length cDNA encoding insulin-like growth factor I and its expression in antler tissue. J Northeast Forest Univ 39,71–75 [Google Scholar]
- Jing W.Q., and Li F.C. (2010). Effects of dietary lysine on growth performance, serum concentrations of insulin-like growth factor-I (IGF-I) and IGF-I mRNA expression in growing rabbits. Agric Sci Chin 9,887–895 [Google Scholar]
- Jones J.I., and Clemmons D.R. (1995). Insulin-like growth factors and their binding proteins: biological actions. Endocr Rev 16,3–34 [DOI] [PubMed] [Google Scholar]
- Kheralla Y., Gotz W., Kawarizadeh A., Rath-Deschner B., and Jager A. (2010). IGF-I, IGF-IR and IRS1 expression as an early reaction of PDL cells to experimental tooth movement in the rat. Arch Oral Biol 55,215–222 [DOI] [PubMed] [Google Scholar]
- Kierdorf U., Li C., and Price J.S. (2009). Improbable appendages: deer antler renewal as a unique case of mammalian regeneration. Semin Cell Dev Biol 20,535–542 [DOI] [PubMed] [Google Scholar]
- Laron Z. (2001). Insulin-like growth factor 1 (IGF-1): a growth hormone. Mol Pathol 54,311–316 [DOI] [PMC free article] [PubMed] [Google Scholar]
- Liu X., Song L., Liu J., Wang S., Tan X., Bai X., Bai T., Wang Y., Li M., Song Y., and Li Y. (2013). miR-18b inhibits TGF-β1-induced differentiation of hair follicle stem cells into smooth muscle cells by targeting SMAD2. Biochem Biophys Res Commun 438,551–556 [DOI] [PubMed] [Google Scholar]
- Li Y., Shelat H., and Geng Y.J. (2012). IGF-1 prevents oxidative stress induced-apoptosis in induced pluripotent stem cells which is mediated by microRNA-1. Biochem Biophys Res Commun 426,615–619 [DOI] [PubMed] [Google Scholar]
- Liu J.T., Li H.Z., Wu D., Zhang C.L., Yuan X.H., Zhao B.H., Jin X.D., and Chu Y.H. (2012). The relationship between miR-1/miR-206, IGF-1 and diabetic cardiomyopathy. Chin J Biochem Pharm 33,389–391 [Google Scholar]
- Long J., Wang Y., Wang W., Chang B.H., and Danesh F.R. (2010). Identification of microRNA-93 as a novel regulator of vascular endothelial growth factor in hyperglycemic conditions. J Biol Chem 285,23457–23465 [DOI] [PMC free article] [PubMed] [Google Scholar]
- Miller S.C., Bowman B.M., and Jee W.S. (1995). Available animal models of osteopenia—small and large. Bone 17,117S–123S [DOI] [PubMed] [Google Scholar]
- Panagakos F.S. (1993). Insulin-like growth factors-I and -II stimulate chemotaxis of osteoblasts isolated from fetal rat calvaria. Biochimie 75,991–994 [DOI] [PubMed] [Google Scholar]
- Stark A., Brennecke J., Bushati N., Russell R.B., and Cohen S.M. (2005). Animal microRNAs confer robustness to gene expression and have a significant impact on 3′UTR evolution. Cell 123,1133–1146 [DOI] [PubMed] [Google Scholar]
- Tang F., Kaneda M., O'Carroll D., Hajkova P., Barton S.C., Sun Y.A., Lee C., Tarakhovsky A., Lao K., and Surani M.A. (2007). Maternal microRNAs are essential for mouse zygotic development. Genes Dev 21,644–648 [DOI] [PMC free article] [PubMed] [Google Scholar]
- Tay Y., Zhang J., Thomson A.M., Lim B., and Rigoutsos I. (2008). MicroRNAs to Nanog, Oct4 and Sox2 coding regions modulate embryonic stem cell differentiation. Nature 455,1124–1128 [DOI] [PubMed] [Google Scholar]
- Werther G.A., Russo V., Baker N., and Butler G. (1998). The role of the insulin-like growth factor system in the developing brain. Horm Res 49Suppl 1,37–40 [DOI] [PubMed] [Google Scholar]
- Yu X.Y., Song Y.H., Geng Y.J., Lin Q.X., Shan Z.X., Lin S.G., and Li Y. (2008). Glucose induces apoptosis of cardiomyocytes via microRNA-1 and IGF-1. Biochem Biophys Res Commun 376,548–552 [DOI] [PubMed] [Google Scholar]
- Zheng W.H., Kar S., and Quirion R. (2002). Insulin-like growth factor-1-induced phosphorylation of transcription factor FKHRL1 is mediated by phosphatidylinositol 3-kinase/Akt kinase and role of this pathway in insulin-like growth factor-1-induced survival of cultured hippocampal neurons. Mol Pharmacol 62,225–233 [DOI] [PubMed] [Google Scholar]