

Abstract
Background
Salivary biomarkers are potentially important for determining the presence, risk, and progression of periodontal disease. However, clinical translation of biomarker technology from lab to chairside requires studies that identify biomarkers associated with the transitional phase between health and periodontal disease (i.e., gingivitis).
Methods
Eighty participants (40 with gingivitis, 40 healthy) provided saliva at baseline and 7 to 30 days later. An additional sample was collected from gingivitis participants 10 to 30 days after dental prophylaxis. Clinical parameters of gingival disease were recorded at baseline and the final visit. Salivary concentrations of interleukin (IL)-1β, IL-6, matrix metalloproteinase (MMP)-8, macrophage inflammatory protein (MIP)-1α, and prostaglandin E2 (PGE2) were measured.
Results
Clinical features of health and gingivitis were stable at both baseline visits. Participants with gingivitis demonstrated significantly higher bleeding on probing (BOP), plaque index (PI), and gingival index (GI) (P ≤ 0.002) and a significant drop in BOP, PI, and GI post-treatment (P ≤ 0.001). Concentrations of MIP-1α and PGE2 were significantly higher (2.8 times) in the gingivitis group than the healthy group (P ≤ 0.02). After dental prophylaxis, mean biomarker concentrations did not decrease significantly from baseline in the gingivitis group, although concentrations of IL-1β, IL-6, and MMP-8 approached healthy levels, whereas MIP-1α and PGE2 concentrations remained significantly higher than in the healthy group (P ≤ 0.04). Odds ratio analyses showed that PGE2 concentrations, alone and in combination with MIP-1α, readily discriminated gingivitis from health.
Conclusions
Salivary PGE2 and MIP-1α discriminate gingivitis from health, and patients with gingivitis who return to clinical health continue to produce inflammatory mediators for weeks after dental prophylaxis.
Keywords: Biological markers, gingivitis, metalloproteases, periodontitis, prostaglandins, saliva
Gingivitis is a reversible condition associated with bacterial plaque that resolves in about 1 week after the reinstitution of oral hygiene procedures.1,2 The third National Health and Nutrition Examination Survey estimates that about 54% of the United States population, age 13 years and older, has at least one site of gingival bleeding,3,4 and it is generally accepted that gingivitis, if left untreated, may ultimately progress to periodontitis in a subset of individuals.5,6 Differential host responses are thought to contribute to various susceptibilities that play an important role in determining progression of the inflammatory lesion.7–11 At the cellular level, exposure to bacterial products and lipopolysaccharide elicit activation of monocytes/macrophages that promote secretion of cytokines and inflammatory mediators such as interleukin (IL)-1, IL-6, and tumor necrosis factor (TNF), resulting in the release of matrix metalloproteinases (MMPs).12 These inflammatory cytokines and enzymes are detectable in oral fluids.13,14
Saliva is an easily accessible biologic fluid that contains an array of important proteins that are produced locally or derived from the vascular beds in the gingival tissues.15 As such, saliva has become an emerging tool for the diagnostic assessment of various oral and systemic diseases, particularly periodontal disease.15–17 Although a data- bank of salivary biomarkers associated with periodontitis exists,18,19 the number of biomarkers identified in saliva associated with gingivitis that are unique (different from those of periodontitis) is incomplete. Elevated concentrations of salivary total protein, albumin, IL-6, and IL-8 have been reported to be associated with gingivitis.20–22 Additional biomarkers have also been detected in elevated concentrations in gingival crevicular fluid during experimental gingivitis,23,24 which would be predicted to contribute to elevated levels in saliva.
Because of the relationship of gingivitis with periodontitis and the unidentified biologic processes that lead to the transition between these two inflammatory conditions, diagnostic tools for early detection at the biochemical level are desirable. The goal of this study was to identify novel salivary biomarkers associated with gingivitis. The hypothesis was that select biomarkers associated with inflammation and host responses are present in whole saliva in greater concentrations in gingivitis participants than healthy participants. The primary aim was to compare the concentrations of IL-1β, IL-6, pros taglandin E2 (PGE2), MMP-8, and macrophage inflammatory protein (MIP)-1α in whole saliva from patients with gingivitis with concentrations of these substrates in the saliva of patients with a clinically healthy periodontium. The secondary aim was to determine how periodontal treatment (i.e., dental prophylaxis) affected the concentration of these biomarkers in the saliva of patients with gingivitis.
MATERIALS AND METHODS
Participants
This case-control longitudinal study was conducted at the University of Kentucky College of Dentistry from October 2012 to May 2013. The protocol was approved by the Institutional Review Board of the University of Kentucky. Participants were recruited from the general clinic and student population of the College of Dentistry. Eighty people (37 males and 43 females, aged 23 to 38 years; mean age: 26.9 – 3.85 years) participated. Each participant was given verbal and written information that described the nature of the study, and each signed an informed consent form before enrollment in the study. Inclusion criteria included participants older than 18 years of age who were in good general health (excluding the case definition) and had a minimum of 20 teeth. Participants in the gingivitis group had bleeding on probing (BOP) at ≥20% of sites (six sites per tooth), probing depth (PD) ≤4 mm at all sites, and no sites with clinical attachment loss (AL) ≤2 mm. Participants in the healthy group had BOP at <20% of sites, PD ≤4 mm at all sites, and no AL ≥2 mm. Individuals were excluded from either group for: 1) alcoholism, liver, kidney, or salivary gland dysfunction; 2) inflammatory bowel disease; 3) granulomatous diseases; 4) diabetes; 5) organ transplant or cancer therapy; and 6) periodontal abscess or previous treatment for periodontal disease or aggressive periodontitis. Additional exclusion criteria were: 1) pregnancy or lactation; 2) use of antibiotics or immunosuppressant medication within the last 1 month; 3) need for antibiotics for infective endocarditis prophylaxis during dental procedures; 4) symptoms of acute illness (i.e., fever, sore throat, body aches, and diarrhea); 5) removable prosthodontic or orthodontic appliances; or 6) presence of an oral mucosal inflammatory condition (e.g., aphthous, lichen planus, leukoplakia, and oral cancer).
Clinical Evaluation
All participants received full-mouth periodontal examination by one calibrated examiner (BS). Before this examination, the medical and dental history was obtained and reviewed along with exclusion criteria. Findings from the head, neck, and oral examination were recorded as normal or abnormal. All clinical findings were recorded on data collection worksheets.
The gingival index (GI) score was recorded as suggested by Löe, 25 where a score of 0 = normal gingiva; 1 = mild inflammation, slight change in color, slight edema, no BOP; 2 = moderate inflammation, redness, edema, and glazing, BOP; 3 = severe inflammation, marked redness and edema, ulceration, spontaneous bleeding.
PD was measured at six locations per tooth (mesial-buccal, mid-buccal, distal-buccal, mesial lingual, mid-lingual, and distal-lingual) using a periodontal probe. § After PD measurements, all sites were examined for BOP, and these measures were recorded. AL was measured at all six locations per tooth.
The plaque index (PI) score was recorded where 0 = no plaque; 1 = a film of plaque adheres to the gingival margin, recognized by running a probe across the tooth surface; 2 = moderate accumulation of plaque visible to the naked eye within the gingival pocket, and/or at the gingival margin and tooth surface; 3 = abundant accumulation (1 to 2 mm thick) of plaque visible to the naked eye within the gingival pocket, and/or at the gingival margin and tooth surface.25
Healthy participants received a full-mouth periodontal examination at baseline (H1) and a second full-mouth periodontal examination 7 to 30 days after the initial visit (H2). Gingivitis participants had three research visits: baseline (G1), a dental prophylaxis visit performed 7 to 30 days after the baseline visit (G2), and a follow-up visit 7 to 30 days after the dental prophylaxis visit (G3). The gingivitis participants received two full-mouth periodontal examinations, at baseline and G3.
Treatment
Treatment was provided to the gingivitis group only. Dental prophylaxis was performed by the provider who performed the clinical examinations. Treatment included hand instrumentation of the teeth to remove dental plaque and/or calculus, ultrasonic scaling therapy, flossing, irrigation with 0.12% chlorhexidine mouth rinse for 45 seconds, and oral hygiene instruction.
Collection of Salivary Samples
Saliva samples were collected from both groups at each examination. Healthy participants had saliva collected at H1 and H2. Gingivitis participants had saliva collected at three visits: G1, G2, and G3. All participants rinsed with tap water (10 mL) for 30 seconds and expectorated before saliva collection. Unstimulated whole saliva was collected according to a method previously described.13 Participants were asked to avoid oral hygiene measures (i.e., flossing, brushing, and mouth rinses), eating, drinking, or gum chewing for 1 hour before saliva collection. Participants expectorated at least 5 mL of unstimulated whole saliva into sterile tubes containing lyophilized protease inhibitor solution.i Saliva samples were collected on ice. Aliquots were prepared and samples were frozen at −80°C until analysis.
Biomarker Analyses
An immunology multiplex assay kit¶ was used to detect IL-1β, IL-6, MMP-8, and MIP-1α. PGE2 was detected using an enzyme-linked immunoassay kit.# All analyses were performed in duplicate within 6 months of sample procurement. Standards were included on all runs, and all results are reported within the linearity of the assays. A timeline of the study is shown in Figure 1.
Figure 1.
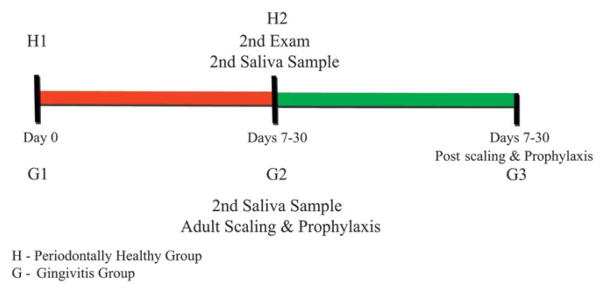
Timeline of the examinations, saliva collections, and adult prophylaxis.
Data Handling and Statistical Analyses
The percentage of sites affected (BOP, PI, and GI) were calculated by dividing the number of number of sites affected by the total number of sites present. A weighted GI score was calculated by adding the number of sites with scores 1, 2, and 3 and dividing this by twice the number of teeth. Demographic variables and smoking status were compared between groups using the Fisher exact test and two- sample t tests. Comparative differences in analyte concentrations between test and control groups were determined using paired t tests and two-sample t tests after log transformation. Clinical measures were compared between groups using Wilcoxon rank-sum tests (between groups) and Wilcoxon signed-rank tests (within groups). Mean periodontal indices, age, and concentration of salivary biomarkers were compared between test and control groups using two-way analysis of covariance to adjust for differences in patient demographics. Relationships among analytes and periodontal indices were determined using Pearson and Spearman correlation coefficients. Analyte levels associated with clinical parameters of gingivitis as well as those that discriminated gingivitis from health were determined using logistic regression analysis. In the latter analysis, measurements below the limit of detection were set at one half the detection limit. A stepwise logistic model was used to identify which subset of analytes and/or PI and GI correlated with a response to therapy in the gingivitis group. Analysis of variance was used to determine if the time interval between dental prophylaxis and the last visit (i.e., G3) influenced the clinical parameters or biomarker concentrations evaluated. All analyses were performed using software,** with statistical significance determined at the 0.01 level to protect against inflation of the Type I error rate. A sample of 40 individuals per group has 81% power to detect a two- fold change in means if the coefficient of variability is as large as 20%. This assumes a log-normal distribution for a given biomarker within each group and a significance level of 0.01, using a Bonferroni correction due to testing the significance of five biomarkers.
RESULTS
Demographics and Clinical Parameters
Eighty participants were evaluated. Forty participants had gingivitis and 40 were healthy according to the clinical protocol guidelines. The demographic characteristics were similar between the groups and are summarized with the clinical data in Table 1. As expected, participants who had gingivitis presented with significantly higher mean BOP (P < 0.0001), PI (P = 0.024), and GI (P <0.0001) scores compared with the healthy participants. Significant differences were not observed for mean BOP and PI scores at the first and second visit in the healthy group (H1 and H2), as determined by paired t test; however, the GI score improved significantly between H1 and H2 (P = 0.02) (data not shown).
Table 1.
Demographics and Clinical Parameters (mean ± SD) of the Study Population (n = 80) at Baseline and Compared with Post-Treatment
| Category | Healthy (H1), n = 40 | Gingivitis (G1), n = 40 | P, H1 versus G1 | G3 | P, G1 versus G3 |
|---|---|---|---|---|---|
|
| |||||
| Females (n [%]) | 23 (57.5) | 20 (50) | NS | — | — |
| Age (years) | 26.3 ± 3.05 | 27.5 ± 4.5 | NS | — | — |
| No. teeth | 27.6 ± 1.1 | 27.6 ± 1.1 | NS | — | — |
| BOP (%) | 5.5 ± 3.6 | 25.7 ± 5.5 | <0.0001 | 7.9 ± 3.0 | <0.0001 |
| PI (%) | 10.0 ± 10.8 | 17.5 ± 17.3 | 0.024 | 3.0 ± 7.2 | <0.0001 |
| GI | 0.34 ± 0.21 | 1.12 ± 0.25 | <0.0001 | 0.4 ± 0.14 | <0.0001 |
NS = not significant. SD = standard deviation. Values in bold have P values <0.05 as determined by t test.
Clinical Response to Treatment in the Gingivitis Group
Study participants who had gingivitis were clinically evaluated at baseline (G1) and after dental prophylaxis (G3). The G3 visit ranged from 7 to 30 days after dental prophylaxis (G2) with a mean of 18.1 – 5.3 days. Table 1 shows that the mean BOP, PI, and GI scores significantly improved in the gingivitis group after treatment. The frequency of BOP decreased across the group from 25.7% to 7.9% of sites (P <0.0001). All gingivitis participants returned to <20% sites with BOP post-treatment; however, 20% of participants had BOP remain at >10% of sites. The PI scores decreased from 17.5% to 3% of sites (P <0.0001), and weighted GI scores decreased from an index of 1.12 to 0.4 (P <0.0001). These data demonstrate clearly that dental prophylaxis improved the clinical measures of gingival health of the participants with gingivitis such that the measured periodontal parameters shifted toward health.
Variability of Salivary Biomarker Concentrations Before Treatment
Table 2 shows the mean salivary concentrations of IL-1β, IL-6, PGE2, MMP-8, and MIP-1α at the two baseline visits for both groups. Mean concentrations of IL-1β, IL-6, MMP-8, and MIP-1α were stable between visit 1 and visit 2 for both groups. However, concentrations of PGE2 decreased significantly in the healthy group (P = 0.004) but increased in the gingivitis group (P = 0.019). These findings suggest that the salivary concentrations of IL-1β, IL-6, MMP-8, and MIP-1α are rather stable in health and gingivitis, whereas concentrations of PGE2 demonstrate greater within-participant fluctuations over a 1- to 4-week time interval.
Table 2.
Variability of Biomarker Concentrations Within Groups Before Treatment (mean ± SD)
| Analyte | Healthy (H1) | Healthy (H2) | P, H1 versus H2 | Gingivitis (G1) | Gingivitis (G2) | P, G1 versus G2 |
|---|---|---|---|---|---|---|
|
| ||||||
| IL-1β (pg/mL) | 17.4 ± 25.3 | 25.3 ± 38.9 | 0.165 | 29.6 ± 49.5 | 30.3 ± 39.1 | 0.196 |
| IL-6 (pg/mL) | 3.20 ± 4.0 | 3.3 ± 4.5 | 0.993 | 3.9 ± 5.9 | 4.9 ± 10.5 | 0.619 |
| MMP-8 (ng/mL) | 156.7 ± 121.9 | 165.9 ± 153.5 | 0.751 | 208.2 ± 194.2 | 234.1 ± 241.6 | 0.5 |
| MIP-1α (pg/mL) | 4.5 ± 9.6 | 3.6 ± 7.1 | 0.651 | 10.9 ± 14.5 | 12.4 ± 16.7 | 0.487 |
| PGE2 (ng/mL) | 292.8 ± 219.4 | 211.2 ± 146.4 | 0.004 | 602.8 ± 582.6 | 791.4 ± 761.7 | 0.019 |
Values in bold have P values <0.05 as determined by Wilcoxon signed-rank statistics. Time between visits averaged 14 days (range 7 to 27 days, H1 to H2) for the healthy group, and 18.1 days (range 7 to 30 days, G2 to G3) for the gingivitis group.
Between-Group Comparisons (health versus gingivitis) of Salivary Biomarker Concentrations at Baseline
Table 3 provides comparative P values between the healthy and gingivitis groups at the two baseline visits. The data show multiple comparisons to provide insight into the differences in biomarker concentrations between the groups. Significant elevations in concentrations were observed for MIP-1α and PGE2 in the patients with gingivitis compared with the healthy participants, with mean concentrations of the two analytes being about 2.8 times higher in the gingivitis group (P 0.0001 when the average of the healthy determinations was compared with the average of the two baseline gingivitis determinations). Similar results were obtained when H1 was compared with G1 and G2, and again when H2 was compared with G1 and G2. The comparisons did not differ. For IL-1β, IL-6, and MMP-8, salivary concentrations were slightly higher in the gingivitis group (1.4 to 1.5 times) compared with the healthy group, but these were not significantly different between groups (P >0.01). Correlations were not observed among periodontal parameters and concentrations of the five biomarkers when analyses were performed by group. In contrast, when the healthy individuals and patients with gingivitis were collapsed into one group, Pearson correlation analyses showed that salivary PGE2 concentrations correlated with percentage of sites with BOP (R = 0.33, P = 0.003), percentage of sites with GI (R = 0.26 P = 0.02), and weighted GI (R = 0.29, P = 0.009). Similar results were observed using Spearman rank correlation analyses (data not shown).
Table 3.
Comparisons of Concentrations (P value) of Biomarkers in Healthy and Gingivitis Groups
| Biomarker | H1 versus G1 | H1 versus G2 | H2 versus G1 | H2 versus G2 | Average H1/H2 versus Average G1/G2 |
|---|---|---|---|---|---|
|
| |||||
| IL-1β | 0.114 | 0.276 | 0.85 | 0.73 | 0.258 |
| IL-6 | 0.439 | 0.66 | 0.41 | 0.187 | 0.435 |
| MMP-8 | 0.419 | 0.365 | 0.424 | 0.284 | 0.327 |
| MIP-1α | 0.014 | 0.02 | 0.007 | 0.001 | 0.002 |
| PGE2 | 0.015 | 0.008 | 0.0002 | 0.004 | 0.001 |
Values in bold have P values <0.05 by Wilcoxon signed-rank (within groups) and rank-sum (between groups) tests.
Concentrations of Salivary Biomarkers in the Gingivitis Group in Response to Dental Prophylaxis
As mentioned, the clinical parameters (BOP, PI, and GI) of the gingivitis group improved significantly after treatment (P <0.001). Thus, it was important to investigate how the salivary biomarkers responded to therapy. Data presented in Tables 2 and 4 demonstrate that the mean concentrations of IL-1β and MMP-8 decreased after treatment and approximated concentrations observed in the healthy group. In contrast, PGE2 concentrations did not change significantly in the gingivitis group after dental prophylaxis, and remained significantly higher than the mean concentration of the healthy group (P ≤ 0.037). MIP-1α concentrations trended downward after treatment, but were still significantly higher than healthy levels (P ≤ 0.014). The variation in time interval (i.e., 7 to 30 days) between G2 (dental prophylaxis) and G3 (last visit) had no influence on the clinical parameters or biomarker concentrations observed at G3, nor did the poor responders directly influence levels of PGE2 or MIP-1α at G3 (data not shown).
Table 4.
Comparative Concentrations (mean ± SD) of Biomarkers Post-Treatment of Patients With Gingivitis
| Analyte | Post-treatment (G3) | P, H1 versus G3 | P, H2 versus G3 | P, G1 versus G3 | P, G2 versus G3 |
|---|---|---|---|---|---|
|
| |||||
| IL-1β (pg/mL) | 17.4 ± 21.9 | 0.302 | 0.734 | 0.247 | 0.055 |
| IL-6 (pg/mL) | 4.5 ± 9.1 | 0.765 | 0.714 | 0.652 | 0.368 |
| MMP-8 (ng/mL) | 179.9 ± 163.9 | 0.966 | 0.719 | 0.570 | 0.134 |
| MIP-1α (pg/mL) | 8.6 ± 10.4 | 0.014 | 0.006 | 0.402 | 0.500 |
| PGE2 (ng/mL) | 735.5 ± 754.6 | 0.037 | 0.001 | 0.526 | 0.364 |
Values in bold have P values <0.05 by Wilcoxon signed-rank (within groups) and rank-sum (between groups) tests.
Salivary Biomarkers and Discriminatory Capacity
Odds ratios (ORs) were calculated for the biomarkers’ capacity to discriminate gingivitis from health based on a cutoff of >2 standard deviations above the mean of the healthy controls (Table 5). This method has been used previously for distinguishing health from other diseases such as osteoporosis26 and periodontitis.13 On the basis of single biomarker analyses, PGE2 and MIP-1α produced the greatest ORs that discriminated gingivitis from health. PGE2 had an OR of 35.2 (95% confidence interval [CI]: 4.4 to 282.4) and MIP-1α had an OR of 8.1 (CI: 1.7 to 39.3), respectively. These data demonstrate that when salivary MIP-1α and PGE2 are elevated, participants are highly likely to have gingivitis.
Table 5.
ORs for Gingivitis Predicting Altered Salivary Biomarkers
| 95% CI | |||
|---|---|---|---|
| Biomarker | OR | Lower | Upper |
|
| |||
| IL-1β | 4.0 | 0.78 | 20.8 |
| PGE2 | 35.2 | 4.4 | 282.3 |
| MMP-8 | 2.7 | 0.5 | 14.9 |
| IL-6 | 1.8 | 0.4 | 7.9 |
| MIP-1α | 8.1 | 1.7 | 39.3 |
Response to Therapy
In the therapeutic arm of the study, all participants who had gingivitis responded to therapy such that BOP was reduced to <20% of sites. However, when a more stringent measure of return to health was set at ≤ 10% BOP, 32 of the 40 gingivitis participants (80%) had BOP at G3 that fell below this threshold (P <0.0001). Interestingly, the clinical and biomarker parameters of the gingivitis participants whose BOP was >10% at G3 (i.e., poorer responders) were not significantly different at the baseline visit from the better responders; thus, the authors were unable to predict in advance which participants would respond to this therapeutic intervention. However, the authors did note that the poorer responders were characterized by a significantly higher GI measure than the responders at both the first and last visits.
DISCUSSION
This case-control longitudinal study sought to expand the profile of salivary biomarkers that could be used to assess periodontal health. The study focuses on gingivitis, a condition that affects a large percentage of the population27 and may serve as a transitional phase between health and periodontal disease. Unlike periodontal disease, gingivitis has lacked evidence of salivary biomarkers with strong discriminatory capacity, a feature critical for the translational utility of salivary biomarkers to chair-side diagnostics.28 The study design involves healthy and naturally occurring gingivitis groups, two baseline visits, and a treatment arm to examine biomarker discriminatory capacity. The two baseline visits provide evidence that the clinical conditions were stable in these groups, and the findings show that elevated salivary concentration of PGE2 is a biomarker that is affected by gingivitis. Although dental prophylaxis improved the clinical parameters of the gingival and periodontal tissues, mean salivary biomarker concentrations of PGE2 and MIP-1α remained significantly above healthy levels after treatment.
Gingivitis is an inflammatory condition affecting the soft tissues of the periodontium. The condition is characterized by elevated BOP, PI, and GI scores, as observed in the gingivitis group. Commensurate with the inflammatory profile of gingivitis, salivary concentrations of IL-1β, IL-6, MMP-8, MIP-1α, and PGE2 were higher in the gingivitis group compared with healthy participants. The present authors and others have previously reported that salivary concentrations of IL-1β, IL-6, MMP-8, MIP-1α, and PGE2 are significantly higher in people with periodontal disease than healthy individuals.13,23,29–35 However, in this study, only salivary concentrations of MIP-1α and PGE2 are significantly higher in the gingivitis group compared with healthy participants, whereas concentrations of IL-1β, IL-6, and MMP-8 lack the ability to distinguish gingivitis from health. Thus, these findings and the accumulated evidence from a limited number of salivary biomarker studies15,22 suggest that gingivitis is associated with salivary cytokine and enzyme concentration profiles that are juxtaposed between health and periodontitis. This is consistent with the notion that these host-response biomolecules, when present at prolonged and elevated concentrations, may contribute to the progression of gingivitis to periodontitis.
As previously described by the authors’ group, salivary biomarker concentrations have day-to-day and week-to-week variability.36 Yet the variation displayed appears to fluctuate around a homeostatic set point, and several salivary biomarkers have a reliable upper limit that allows for a threshold to be determined that distinguishes health from disease.35 Using diverse statistical approaches, salivary biomarker concentration thresholds have been reported to provide high sensitivity and specificity for discriminating periodontitis from health,13,18,29,31,32,37 particularly when unstimulated whole saliva is used rather than stimulated whole or glandular saliva.15 However, there are few salivary biomarkers that have been studied that reflect the underlying biology of gingivitis in its natural setting. Early studies focused on detecting elevated levels of salivary biochemicals (i.e., albumin, protein, and cystatin) associated with plasma protein leakage, a consequence of vasculitis within the gingival tissues, during experimentally induced gingivitis,20,21 and more recent studies have detected elevated concentrations of IL-1β, IL-6, IL-8, and calprotectin associated with experimental gingivitis.22,38 However, to the best of the authors’ knowledge, this is the first study to examine host-response biomarker concentrations in saliva as a tool to discriminate existing chronic gingivitis from health. This is important because chronic gingivitis in its natural setting is somewhat different biologically from experimentally induced gingivitis.39,40
The therapeutic arm of the current study allows us to observe heterogeneity in response to therapy within the gingivitis cohort. Here, all participants who had gingivitis demonstrated marked resolution of inflammation after dental prophylaxis such that their BOP was reduced to <20% of sites; however, 20% of participants had BOP at >10% of sites post-therapy. Thus, not all patients returned to a state of health within 7 to 30 days post-treatment, and the day of return for the clinical evaluation did not appear to influence the outcome. These findings are consistent with previous studies of experimental gingivitis demonstrating the variable response to bacterial plaque and therapy,22,41 and suggest that susceptibilities differ in a subgroup of individuals within the gingivitis population, potentially related to inherent response differences. Also, these findings point to biomarkers that might be useful for identifying those who might be at risk for continued chronic inflammation, and could hallmark those with greater propensity to progress to destructive disease.
Although these findings are limited by the short duration of this study and the absence of information concerning the impact of individual oral hygiene products or measures that could have influenced the outcomes, the findings are strengthened by the low intraindividual and intragroup variability in BOP and PI scores at the two baseline visits, and the commensurate low variability in salivary biomarker concentrations at these two visits, which are suggestive of the steady states of health and gingivitis in the study population. Inasmuch as the biomarker variability was low and the mean concentrations differed by about 2.8-fold between the healthy and gingivitis groups, data from the OR analyses were robust and suggested that salivary MIP-1α and PGE2 were biomarkers reflective of gingivitis. However, it was somewhat surprising to see that post-treatment concentrations of MIP-1α and PGE2 did not decrease to healthy levels, whereas post-treatment salivary concentrations of IL-1β, IL-6, and MMP-8 tended to reflect concentrations more similar to those of health. Although it is not completely clear why two proinflammatory cytokines and a collagenase responded better to mechanical debridement than PGE2 and MIP-1α, similar decreases in salivary concentrations of IL-1β and MMP-8 have been reported after phase I therapy in patients with chronic periodontitis.33,42 One possible explanation is the potential role of PGE2 in suppressing the release of IL-1β, IL-6, and TNF-α,43,44 and these cytokines regulating the release of MMPs, which play a key role in degrading the extracellular matrix of connective tissue occurring in periodontal disease.45 Thus, elevated levels of PGE2 could be a protective mechanism to prevent the release of MMPs that would result in tissue breakdown. However, PGE2 has also been reported to inhibit MIP-1α release from dendritic cells;46 thus, additional factors besides elevated concentrations of PGE2 are likely contributory. Another possibility is that PGE2 levels may reflect a more general lipid mediator response in the gingival tissues that would encompass the production of inflammation-resolving molecules (e.g., resolvins, protectins) that could contribute to improvement of the local inflammatory effects on the tissues.47–49
From a diagnostic perspective, it is interesting to speculate that PGE2 and MIP-1α may be biomarkers reflective of an altered state of the periodontium that is changed by the repeated insults of bacteria and their byproducts associated with chronic gingivitis. Offenbacher et al.50 demonstrated elevated concentrations of PGE2 in gingival crevicular fluid, which predicted the development of periodontal disease; thus, these two biomarkers in saliva may also be related to the inherent risk of progression to periodontitis.
CONCLUSIONS
These findings indicate that salivary concentrations of PGE2 and MIP-1α can discriminate gingivitis from health, and patients with gingivitis who return to clinical health continue to produce inflammatory mediators for weeks after dental prophylaxis. The findings suggest the need for studies that investigate why certain concentrations of salivary biomarkers do not return to healthy levels after treatment and what therapies may be required to return a patient to biologic health. Future longitudinal studies in larger populations should provide greater insight, especially for answering questions of how frequently an individual patient should receive oral prophylaxis to achieve clinical and, importantly, biologic health and whether a salivary biomarker profile predicts patients with gingivitis who are prone to progressing to destructive disease.
Acknowledgments
BS and MAS contributed equally to this study. Presented in part at the AADR Fall Focus Symposium, Ann Arbor, Michigan, October 24, 2013. This study was supported by the University of Kentucky Periodontology fund and grants P20 GM103538 from the National Institute of General Medical Sciences (NIGMS) and UL1TR000117 from the National Center for Applied and Translational Sciences (NCATS). The content is solely the responsibility of the authors and does not necessarily represent the official view of NIH. The authors thank Danny Noll, research asssistant, Jason Stevens, research analyst, and Malini Bharadwaj, data management specialist, of the Center for Oral Health Research of the University of Kentucky for clinical, laboratory, and data management support.
Footnotes
Sigma-Aldrich, St. Louis, MO.
EMD, Millipore, Billerica, MA.
Assay Design, Ann Arbor, MI.
SAS Institute, Cary, NC.
The authors report no conflicts of interest related to this study.
References
- 1.Loe H, Theilade E, Jensen SB. Experimental gingivitis in man. J Periodontol. 1965;36:177–187. doi: 10.1902/jop.1965.36.3.177. [DOI] [PubMed] [Google Scholar]
- 2.Pihlstrom BL, Michalowicz BS, Johnson NW. Periodontal diseases. Lancet. 2005;366:1809–1820. doi: 10.1016/S0140-6736(05)67728-8. [DOI] [PubMed] [Google Scholar]
- 3.Albandar JM, Kingman A. Gingival recession, gingival bleeding, and dental calculus in adults 30 years of age and older in the United States, 1988–1994. J Periodontol. 1999;70:30–43. doi: 10.1902/jop.1999.70.1.30. [DOI] [PubMed] [Google Scholar]
- 4.Tomar SL, Asma S. Smoking-attributable periodontitis in the United States: Findings from NHANES III. National Health and Nutrition Examination Survey. J Periodontol. 2000;71:743–751. doi: 10.1902/jop.2000.71.5.743. [DOI] [PubMed] [Google Scholar]
- 5.Schätzle M, Faddy MJ, Cullinan MP, et al. The clinical course of chronic periodontitis: V. Predictive factors in periodontal disease. J Clin Periodontol. 2009;36:365–371. doi: 10.1111/j.1600-051X.2009.01391.x. [DOI] [PubMed] [Google Scholar]
- 6.Offenbacher S. Periodontal diseases: Pathogenesis. Ann Periodontol. 1996;1:821–878. doi: 10.1902/annals.1996.1.1.821. [DOI] [PubMed] [Google Scholar]
- 7.Van Dyke TE, Sheilesh D. Risk factors for periodontitis. J Int Acad Periodontol. 2005;7:3–7. [PMC free article] [PubMed] [Google Scholar]
- 8.Trombelli L. Susceptibility to gingivitis: A way to predict periodontal disease? Oral Health Prev Dent. 2004;2(Suppl 1):265–269. [PubMed] [Google Scholar]
- 9.Grigoriadou ME, Koutayas SO, Madianos PN, Strub JR. Interleukin-1 as a genetic marker for periodontitis: Review of the literature. Quintessence Int. 2010;41:517–525. [PubMed] [Google Scholar]
- 10.Kornman KS, Page RC, Tonetti MS. The host response to the microbial challenge in periodontitis: Assembling the players. Periodontol 2000. 1997;14:33–53. doi: 10.1111/j.1600-0757.1997.tb00191.x. [DOI] [PubMed] [Google Scholar]
- 11.Ebersole JL, Dawson DR, 3rd, Morford LA, Peyyala R, Miller CS, Gonzaléz OA. Periodontal disease immunology: ‘Double indemnity’ in protecting the host. Periodontol 2000. 2013;62:163–202. doi: 10.1111/prd.12005. [DOI] [PMC free article] [PubMed] [Google Scholar]
- 12.Yucel-Lindberg T, Båge T. Inflammatory mediators in the pathogenesis of periodontitis. Expert Rev Mol Med. 2013;15:e7. doi: 10.1017/erm.2013.8. [DOI] [PubMed] [Google Scholar]
- 13.Miller CS, King CP, Jr, Langub MC, Kryscio RJ, Thomas MV. Salivary biomarkers of existing periodontal disease: A cross–sectional study. J Am Dent Assoc. 2006;137:322–329. doi: 10.14219/jada.archive.2006.0181. [DOI] [PubMed] [Google Scholar]
- 14.Sorsa T, Mäntylä P, Rönkä H, et al. Scientific basis of a matrix metalloproteinase-8 specific chair-side test for monitoring periodontal and peri-implant health and disease. Ann N Y Acad Sci. 1999;878:130–140. doi: 10.1111/j.1749-6632.1999.tb07679.x. [DOI] [PubMed] [Google Scholar]
- 15.Miller CS, Foley JD, Bailey AL, et al. Current developments in salivary diagnostics. Biomarkers Med. 2010;4:171–189. doi: 10.2217/bmm.09.68. [DOI] [PMC free article] [PubMed] [Google Scholar]
- 16.Kinney JS, Ramseier CA, Giannobile WV. Oral fluid- based biomarkers of alveolar bone loss in periodontitis. Ann N Y Acad Sci. 2007;1098:230–251. doi: 10.1196/annals.1384.028. [DOI] [PMC free article] [PubMed] [Google Scholar]
- 17.Giannobile WV, Beikler T, Kinney JS, Ramseier CA, Morelli T, Wong DT. Saliva as a diagnostic tool for periodontal disease: Current state and future directions. Periodontol 2000. 2009;50:52–64. doi: 10.1111/j.1600-0757.2008.00288.x. [DOI] [PMC free article] [PubMed] [Google Scholar]
- 18.Fine DH, Markowitz K, Furgang D, et al. Macrophage inflammatory protein-1alpha: A salivary biomarker of bone loss in a longitudinal cohort study of children at risk for aggressive periodontal disease? J Periodontol. 2009;80:106–113. doi: 10.1902/jop.2009.080296. [DOI] [PubMed] [Google Scholar]
- 19.Prakasam S, Srinivasan M. Evaluation of salivary biomarker profiles following non-surgical management of chronic periodontitis. Oral Dis. 2013;20:171–177. doi: 10.1111/odi.12085. [DOI] [PubMed] [Google Scholar]
- 20.Henskens YM, van der Velden U, Veerman EC, Nieuw Amerongen AV. Protein, albumin and cystatin concentrations in saliva of healthy subjects and of patients with gingivitis or periodontitis. J Periodontal Res. 1993;28:43–48. doi: 10.1111/j.1600-0765.1993.tb01049.x. [DOI] [PubMed] [Google Scholar]
- 21.Shaila M, Pai GP, Shetty P. Salivary protein concentration, flow rate, buffer capacity and pH estimation: A comparative study among young and elderly subjects, both normal and with gingivitis and periodontitis. J Indian Soc Periodontol. 2013;17:42–46. doi: 10.4103/0972-124X.107473. [DOI] [PMC free article] [PubMed] [Google Scholar]
- 22.Lee A, Ghaname CB, Braun TM, et al. Bacterial and salivary biomarkers predict the gingival inflammatory profile. J Periodontol. 2012;83:79–89. doi: 10.1902/jop.2011.110060. [DOI] [PubMed] [Google Scholar]
- 23.Heasman PA, Collins JG, Offenbacher S. Changes in crevicular fluid levels of interleukin-1 beta, leukotriene B4, prostaglandin E2, thromboxane B2 and tumour necrosis factor alpha in experimental gingivitis in humans. J Periodontal Res. 1993;28:241–247. doi: 10.1111/j.1600-0765.1993.tb02090.x. [DOI] [PubMed] [Google Scholar]
- 24.Andriankaja OM, Barros SP, Moss K, et al. Levels of serum interleukin (IL)-6 and gingival crevicular fluid of IL-1beta and prostaglandin E(2) among non-smoking subjects with gingivitis and type 2 diabetes. J Periodontol. 2009;80:307–316. doi: 10.1902/jop.2009.080385. [DOI] [PubMed] [Google Scholar]
- 25.Löe H. The gingival index, the plaque index and the retention index systems. J Periodontol. 1967;38(Suppl 6):610–616. doi: 10.1902/jop.1967.38.6.610. [DOI] [PubMed] [Google Scholar]
- 26.Worsfold M, Powell DE, Jones TJ, Davie MW. Assessment of urinary bone markers for monitoring treatment of osteoporosis. Clin Chem. 2004;50:2263–2270. doi: 10.1373/clinchem.2004.037424. [DOI] [PubMed] [Google Scholar]
- 27.Li Y, Lee S, Hujoel P, et al. Prevalence and severity of gingivitis in American adults. Am J Dent. 2010;23:9–13. [PubMed] [Google Scholar]
- 28.Giannobile WV, McDevitt JT, Niedbala RS, Malamud D. Translational and clinical applications of salivary diagnostics. Adv Dent Res. 2011;23:375–380. doi: 10.1177/0022034511420434. [DOI] [PMC free article] [PubMed] [Google Scholar]
- 29.Al-Sabbagh M, Alladah A, Lin Y, et al. Bone remodeling- associated salivary biomarker MIP-1α distinguishes periodontal disease from health. J Periodontal Res. 2012;47:389–395. doi: 10.1111/j.1600-0765.2011.01445.x. [DOI] [PMC free article] [PubMed] [Google Scholar]
- 30.Christodoulides N, Floriano PN, Miller CS, et al. Lab- on-a-chip methods for point-of-care measurements of salivary biomarkers of periodontitis. Ann N Y Acad Sci. 2007;1098:411–428. doi: 10.1196/annals.1384.035. [DOI] [PubMed] [Google Scholar]
- 31.Sánchez GA, Miozza VA, Delgado A, Busch L. Salivary IL-1β and PGE2 as biomarkers of periodontal status, before and after periodontal treatment. J Clin Periodontol. 2013;40:1112–1117. doi: 10.1111/jcpe.12164. [DOI] [PubMed] [Google Scholar]
- 32.Rathnayake N, Akerman S, Klinge B, et al. Salivary biomarkers of oral health: A cross-sectional study. J Clin Periodontol. 2013;40:140–147. doi: 10.1111/jcpe.12038. [DOI] [PubMed] [Google Scholar]
- 33.Kaushik R, Yeltiwar RK, Pushpanshu K. Salivary interleukin-1β levels in patients with chronic periodontitis before and after periodontal phase I therapy and healthy controls: A case-control study. J Periodontol. 2011;82:1353–1359. doi: 10.1902/jop.2011.100472. [DOI] [PubMed] [Google Scholar]
- 34.Goodson JM, Dewhirst FE, Brunetti A. Prostaglandin E2 levels and human periodontal disease. Prostaglandins. 1974;6:81–85. doi: 10.1016/s0090-6980(74)80043-2. [DOI] [PubMed] [Google Scholar]
- 35.Ebersole JL, Schuster JL, Stevens J, et al. Patterns of salivary analytes provide diagnostic capacity for distinguishing chronic adult periodontitis from health. J Clin Immunol. 2013;33:271–279. doi: 10.1007/s10875-012-9771-3. [DOI] [PMC free article] [PubMed] [Google Scholar]
- 36.Thomas MV, Branscum A, Miller CS, Ebersole J, Al-Sabbagh M, Schuster JL. Within-subject variability in repeated measures of salivary analytes in healthy adults. J Periodontol. 2009;80:1146–1153. doi: 10.1902/jop.2009.080654. [DOI] [PMC free article] [PubMed] [Google Scholar]
- 37.Kinney JS, Morelli T, Braun T, et al. Saliva/pathogen biomarker signatures and periodontal disease progression. J Dent Res. 2011;90:752–758. doi: 10.1177/0022034511399908. [DOI] [PMC free article] [PubMed] [Google Scholar]
- 38.Zhou M, Meng HX, Zhao YB, Chen ZB. Changes of four proinflammatory proteins in whole saliva during experimental gingivitis. Chin J Dent Res. 2012;15:121–127. [PubMed] [Google Scholar]
- 39.Deinzer R, Weik U, Kolb-Bachofen V, Herforth A. Comparison of experimental gingivitis with persistent gingivitis: Differences in clinical parameters and cytokine concentrations. J Periodontal Res. 2007;42:318–324. doi: 10.1111/j.1600-0765.2006.00951.x. [DOI] [PubMed] [Google Scholar]
- 40.Trombelli L, Scapoli C, Carrieri A, Giovannini G, Calura G, Farina R. Interleukin-1 beta levels in gingival crevicular fluid and serum under naturally occurring and experimentally induced gingivitis. J Clin Periodontol. 2010;37:697–704. doi: 10.1111/j.1600-051X.2010.01573.x. [DOI] [PubMed] [Google Scholar]
- 41.Trombelli L, Tatakis DN, Scapoli C, Bottega S, Orlandini E, Tosi M. Modulation of clinical expression of plaque-induced gingivitis. II. Identification of ‘‘high- responder’’ and ‘‘low-responder’’ subjects. J Clin Periodontol. 2004;31:239–252. doi: 10.1111/j.1600-051x.2004.00478.x. [DOI] [PubMed] [Google Scholar]
- 42.Sexton WM, Lin Y, Kryscio RJ, Dawson DR, 3rd, Ebersole JL, Miller CS. Salivary biomarkers of periodontal disease in response to treatment. J Clin Periodontol. 2011;38:434–441. doi: 10.1111/j.1600-051X.2011.01706.x. [DOI] [PMC free article] [PubMed] [Google Scholar]
- 43.Vassiliou E, Jing H, Ganea D. Prostaglandin E2 inhibits TNF production in murine bone marrow-derived dendritic cells. Cell Immunol. 2003;223:120–132. doi: 10.1016/s0008-8749(03)00158-8. [DOI] [PubMed] [Google Scholar]
- 44.Harizi H, Norbert G. Inhibition of IL-6, TNF-alpha, and cyclooxygenase-2 protein expression by prostaglandin E2-induced IL-10 in bone marrow-derived dendritic cells. Cell Immunol. 2004;228:99–109. doi: 10.1016/j.cellimm.2004.04.003. [DOI] [PubMed] [Google Scholar]
- 45.Offenbacher S, Heasman PA, Collins JG. Modulation of host PGE2 secretion as a determinant of periodontal disease expression. J Periodontol. 1993;64(Suppl 5):432–444. doi: 10.1902/jop.1993.64.5s.432. [DOI] [PubMed] [Google Scholar]
- 46.Jing H, Vassiliou E, Ganea D. Prostaglandin E2 inhibits production of the inflammatory chemokines CCL3 and CCL4 in dendritic cells. J Leukoc Biol. 2003;74:868–879. doi: 10.1189/jlb.0303116. [DOI] [PubMed] [Google Scholar]
- 47.Keinan D, Leigh NJ, Nelson JW, De Oleo L, Baker OJ. Understanding resolvin signaling pathways to improve oral health. Int J Mol Sci. 2013;14:5501–5518. doi: 10.3390/ijms14035501. [DOI] [PMC free article] [PubMed] [Google Scholar]
- 48.Freire MO, Van Dyke TE. Natural resolution of inflammation. Periodontol 2000. 2013;63:149–164. doi: 10.1111/prd.12034. [DOI] [PMC free article] [PubMed] [Google Scholar]
- 49.Serhan CN, Chiang N, Van Dyke TE. Resolving inflammation: Dual anti-inflammatory and pro-resolution lipid mediators. Nat Rev Immunol. 2008;8:349–361. doi: 10.1038/nri2294. [DOI] [PMC free article] [PubMed] [Google Scholar]
- 50.Offenbacher S, Odle BM, Van Dyke TE. The use of crevicular fluid prostaglandin E2 levels as a predictor of periodontal attachment loss. J Periodontal Res. 1986;21:101–112. doi: 10.1111/j.1600-0765.1986.tb01443.x. [DOI] [PubMed] [Google Scholar]