

Abstract
Proteomics changes of brain tissues have been described in different neurodegenerative diseases including Alzheimer's disease and Parkinson's disease. However, the brain proteomics of human prion disease remains less understood. In the study, the proteomics patterns of cortex and cerebellum of brain tissues of sporadic Creutzfeldt-Jakob disease, fatal familial insomnia, and G114V genetic CJD were analyzed with isobaric tags for relative and absolute quantitation combined with multidimensional liquid chromatography and MS analysis, with the brains from three normal individuals as controls. Global protein profiling, significant pathway, and functional categories were analyzed. In total, 2287 proteins were identified with quantitative information both in cortex and cerebellum regions. Cerebellum tissues appeared to contain more up- and down-regulated proteins (727 proteins) than cortex regions (312 proteins) of Creutzfeldt-Jakob disease, fatal familial insomnia, and G114V genetic CJD. Viral myocarditis, Parkinson's disease, Alzheimer's disease, lysosome, oxidative phosphorylation, protein export, and drug metabolism-cytochrome P450 were the most commonly affected pathways of the three kinds of diseases. Almost coincident biological functions were identified in the brain tissues of the three diseases. In all, data here demonstrate that the brain tissues of Creutzfeldt-Jakob disease, fatal familial insomnia, and G114V genetic CJD have obvious proteomics changes at their terminal stages, which show the similarities not only among human prion diseases but also with other neurodegeneration diseases. This is the first study to provide a reference proteome map for human prion diseases and will be helpful for future studies focused on potential biomarkers for the diagnosis and therapy of human prion diseases.
Human prion diseases, also named human transmissible spongiform encephalopathies (TSEs)1, are fatal neurodegenerative disorders, including Kuru, Creutzfeldt-Jakob disease (CJD), Gerstmann-Sträussler-Scheinker disease (GSS), and fatal familial insomnia (FFI). These various subtypes of human TSEs differed with each other in the aspects of clinical symptoms, neuropathology, and genetics, but all eventually undergo fatal consequence (1). The conversion of prion protein (PrP), coded by the PRNP gene, from its cellular isoform PrPC to its pathogenic isoform PrPSc through a post-translational process is considered the etiology of these diseases (2). Human TSEs can be also etiologically classified as sporadic, such as sporadic CJD (sCJD), genetic or familial, such as genetic CJD (gCJD), GSS, and FFI, and acquired, such as iatrogenic CJD (iCJD) and variant CJD (vCJD). During the long-term pathogenesis of human TSEs, besides of accumulation of PrPSc in brain tissues, numerous brain proteins, which are involved in many different biological processes and pathways, have been described to be abnormally changed (3, 4, 5). Recently, the global transcriptional profiles in the brain tissues of some kinds of human TSEs, for example, sCJD, gCJD, and FFI have been reported with the help of high throughput microarray technique (6, 7). However, the global changes of proteins in the brain tissues, which are definitely important for understanding the pathogenesis of the disease and providing the clues for the disease diagnosis and therapy, remains seldom addressed.
The rapid development of proteomics technologies in the past decade allows scientists to be able to define the global protein expression profiles in specific physical or pathological statuses, which are usually not fulfilled by conventional molecular biological technologies (8). Isobaric tags for relative and absolute quantitation (iTRAQ) combined with multidimensional liquid chromatography (LC) and MS analysis is a widely accepted quantitative proteomics that allows a single MS analysis with multiple samples, leading to significant reduction of experimental errors generated from individual experiments (9). The approach allows for sample multiplexing, which can be up to eight-plex at the same time. iTRAQ is particularly powerful when applied on a subfraction of the proteome, thereby increasing the possibility of identifying less abundant proteins (10). All these advantages allow the method to reduce chemical noise and improve quantification accuracy, in addition to improving statistical analysis and augmenting data confidence.
To investigate the global protein alterations in the brain tissues of human TSEs, the postmortem cortex and cerebellum tissues from Chinese patients with sCJD, FFI, and G114V gCJD were profiled with iTRAQ analysis, using normal Chinese brain tissues as control. Total 2287 proteins were identified in all of the tested brain samples. In the context of three human TSEs, 161 and 151 proteins were commonly up-regulated and down-regulated in the cortex region, whereas 348 and 379 proteins were commonly up-regulated and down-regulated in the cerebellum region, respectively. FFI had less protein changes than sCJD or G114V gCJD, both in cortex and cerebellum. The commonly impaired pathways among three human prion diseases were Parkinson's disease (PD), Alzheimer's disease (AD), oxidative phosphorylation, and drug metabolism-cytochrome P450. GO (Gene Ontology) analysis revealed that the top five affected biological functions among sCJD, FFI, and G114V gCJD were exactly the same. The similarity and dissimilarity among three human TSEs were discussed in detail.
EXPERIMENTAL PROCEDURES
Ethics Statement
Usage of the stored human brain samples in the China CJD Surveillance System has been approved by the Research Ethics Committee of National Institute for Viral Disease Control and Prevention, China CDC.
Patients
Human cortex and cerebellum samples collected from the patients with definitely diagnosed sCJD, FFI, or G114V gCJD were enrolled in this study. Meanwhile, the brain tissues from three Chinese individuals that died from accidents were used as normal controls including a 50 year-old man, a 63 year-old man, and a 42-year-old woman. All of them did not have a history of neurological symptoms and chronic disease. The sCJD patient was an 80-year-old man with progressive disturbance of consciousness. One month later, he developed obvious akinetic mutism and inactivity, and subsequently many other symptoms appeared such as alalia, apathy, drowsiness, and pyramidal symptoms. Typical periodic sharp-waves (PSW) were detected in electroencephalogram (EEG). Magnetic resonance imaging (MRI) did not reveal a specific abnormality. Cerebrospinal fluid (CSF) 14–3-3 protein was not performed. The patient died 13 months after onset. Neuropathological assays revealed extensive spongiform degeneration and PrPSc deposits. Western blot identified type I PrPSc in brain tissues. PRNP sequencing analysis did not find any nucleotide exchange. Polymorphism of codon 129 was Met/Met homology. The clinical, genetic, neuropathological, and PrPSc molecular features of three cases of FFI (11, 12) and one case of G114V gCJD were described in detail in our previous work (13). The main clinical features of the enrolled cases were summarized in Table I.
Table I. Comparison of the main clinical features of the five human TSE patients.
| Case No. | Geder | Age at onset (y) | Family history | Foremost symptoms | Other signs and symptoms | Blood pressure (mmHg) | Progressive sympathetic symptoms |
CSF 14-3-3 | EEG (PSW*) | MRI | Time of Diagnosis after onset(m) | Duration of illness (m) | |||
|---|---|---|---|---|---|---|---|---|---|---|---|---|---|---|---|
| Excessive sweating | Salivation | Minor evening pyrexia | Weight loss | ||||||||||||
| sCJD | M | 80 | No | Progressive consciousness disturbance | Alalia, apathetic, drowsiness, pyramidal system | 165/90 | No | No | No | No | ND | + | - | 1 | 13 |
| FFI1 | M | 45 | Yes | Sleep disturbance, sympathetic symptoms | Insomnia, dysautonomia, motor Abnormalities | 145/95 | Yes | Yes | Yes | Yes | ND | - | Nor | 2 | 10 |
| FFI2 | F | 26 | Yes | Sleep Disturbance | Insomnia, dysautonomia, myoclonus | 142/98 | Yes | Yes | Yes | Yes | ND | - | Nor | 1 | 14 |
| FFI3 | M | 55 | Yes | Sleep disturbance, fidget | Insomnia, diaphoresis, hyperthermia, memory loss | 145/95 | Yes | Yes | No | Yes | + | - | Nor | 2 | 8 |
| G114V | F | 47 | Yes | Progressive dementia, tiredness, lethargy | Difficulty in communication, progressive dementia and emotional lability | No | No | No | No | - | - | - | 1 | 2.5 | |
Protein Extraction and Protein Digestion
Brain region samples of parietal lobe and cerebellum were homogenized 1:10 in PBS buffer (137 mm NaCl, 2.7 mm KCl, 10 mm Na2HPO4, 2 mm KH2PO4, pH7.4) according to the protocol described elsewhere (14). Tissue debris was removed with low speed centrifugation at 2000 × g for 10 min and the supernatants were collected. The protein concentration was determined by bicinchoninic acid (BCA) method and the samples were stored at −80 °C for further study. SDS-PAGE was performed to verify the protein quality and concentration.
One hundred micrograms of each protein sample was combined with different volumes of tetraethylammonium bicarbonate (TEAB) with 0.1% SDS to equal volume level followed by treatment with trypsin (3.3 μg trypsin/100 μg total protein). The proteins in TEAB were digested with trypsin at 37 °C for 24 h and then another 1 μg trypsin was added in the proteins and digested at 37 °C for another 12 h. The solvent was removed using a SpeedVac.
iTRAQ Labeling
The iTRAQ labeling procedure was performed following the manual provided in the iTRAQ labeling kit (Applied Biosystems, Foster City, CA). The digested samples were dissolved in 30 μl of 50% TEAB together with 70 μl of isoprotocol and labeled with the iTRAQ reagents according to the protocol of the eight-plex iTRAQ labeling kit, including iTRAQ 113–119 and 121. The iTRAQ-labeled products were then pooled and subjected to strong cation exchange (SCX) fractionation.
Peptide Fractionation by the HPLC Approach and Peptide Identification by Nano RP HPLC and Mass Spectrometry
The processes of protein fractionation by HPLC and protein identification by nano RP HPLC and mass spectrometry were performed at Beijing Institute of Genomics, Chinese Academy of Science, based on a fixed methodology published previously (15). To separate the peptides, two different HPLC approaches were adopted, high-pH RP and strong cation exchange (SCX). In the high-pH RP HPLC procedure, the peptides were loaded onto a RP column (Luna C18, 4.6 mm inner diameter × 250 mm length, Phenomenex, Los Angeles, CA), and eluted by step linear elution program, 0–10 min equilibrated in 100% solution A (2% ACN and 20 mm NH4FA, pH 10), 10–15 min fast elution from 0–12% of solution B (80% ACN and 20 mm NH4FA, pH 10), 15–50 min linear elution from 12–56% of solution B; and 50–55 min washing elution from 56–80% of solution B. In the SCX HPLC procedure, the peptides were loaded onto a SCX column (Luna SCX, 4.6 mm × 250 mm, Phenomenex), and eluted by a step linear elution program, 0–10 min equilibrated in buffer A (25% ACN, 20 mm KCl, and 10 mm KH2PO4, pH 3.0), 10–15 min fast elution from 0–5% of buffer B (25% ACN, 1 m KCl, and 10 mm KH2PO4, pH3.0), 15–50 min linear elution from 5–30% of solution B; and 50–55 min washing elution from 30–80% of solution B. All the HPLC procedures were manipulated in a Prominence HPLC system with the flow rate at 1.0 ml/min and the peptides were monitored at 214 nm. The fractioned peptides were collected at one tube/min during the linear elution period. The eluted fractions were dried in a vacuum concentrator and then dissolved with 0.1% formic acid prior to reverse-phase nLC-tandem mass spectrometry.
The peptide contents in the collected fractions were first evaluated by matrix-assisted laser desorption/ionization time-of-flight/time-of-flight (MALDI-TOF/TOF) MS (Bruker Daltonics, Billerica, MA), and the fractions were further pooled to average the peptide content. The eluted fractions were delivered onto a nano RP column (5-μm Hypersil C18, 75 μm × 150 mm, Thermo Fisher Scientific, Waltham, MA) mounted in a Prominence Nano HPLC system (Ultimate3000, Dionex) and were eluted with acetonitrile (ACN) gradient from 5–40% containing 0.1% formic acid, for 95 min at 400 nl/min. The elution products were directly entered Q-Exactive MS (Thermo Fisher Scientific), setting in positive ion mode and data-dependent manner with full MS scan from 350–2000 m/z, full scan resolution at 70,000, MS/MS scan resolution at 17,500. MS/MS scan with minimum signal threshold 1E+5, isolation width at 2 Da. To evaluate the performance of this mass spectrometry on the iTRAQ labeled samples, higher collision energy dissociation (HCD) for MS/MS acquisition modes was employed. To optimize the MS/MS acquisition efficiency of HCD, normalized collision energy (NCE) was systemically examined 28% and stepped 20%.
Database Searches for Peptide and Protein Identification
The raw MS/MS data were converted into MGF format by Thermo Fisher Proteome Discoverer 1.3 (Thermo Fisher Scientific) and the exported MGF files were searched by Mascot 2.3.0 search algorithm (Matrix Science, Boston, MA) against the Uniprot_human database (the time/date of fasta file was Wed Mar 03 23:26:45 2010 and the number of sequences for taxonomy was 20,266 (Homo sapiens)) and an automatic decoy database search was performed. The parameters in Mascot were set for peptide searching, including trypsin as the digestion enzyme, cysteine carbamidomethylation as a fixed modification. iTRAQ eight-plex on the N-terminal residue, iTRAQ eight-plex on tyrosine (Y), iTRAQ eight-plex on lysine (K), Gln-Pyro-Glu (N-term Q), and oxidation on methionine (M) as variable modification. The precursor mass tolerance was set to 15 ppm for precursor ions and 20 mmu for fragment ions. Also, several parameters in Mascot were set for peptide analysis, including the number of distinct peptides assigned for each protein given as “unique” and “peptides”; the coverage of each protein assigned given as “coverage” (supplemental Table S1). The quantification measurement for each peptide and protein was illustrated as the ratio of diseased sample to normal control one, both in the cortex and cerebellum, showing as “sCJD/Nor(Cortex), FFI/Nor(Cortex), G114V/Nor(Cortex), sCJD/Nor(Cerebellum), FFI/Nor(Cerebellum), and G114V/Nor(cerebellum).”
Prerequisites for Quantifying the Proteins Labeled with iTRAQ
Based on the published data (15) and standard operating procedures (SOP) for iTRAQ-based proteomics in Beijing Institute of Genomics, Chinese Academy of Science, the prerequisites to acquire the significant changed proteins between the brains of human prion diseases and normal control were set up as following. First, a qualified protein for quantitative analysis should have at least one unique peptide labeled with iTRAQ. Second, false discovery rate (FDR) <1% was adopted for all the peptides. Third, the median of unique peptides was used as analysis method for protein ratio type, correction of isotope impurities and normalization of intensity median was considered for judging the differential proteome. The proteins whose p value <0.05 were considered the believed proteins. Finally, the proteins with 1.2-fold changes (>1.20 increased or <0.83 decreased) relative to the normal control were considered as the differential expressed ones based on the published reference (16, 17) and the fold changes in protein abundance were defined as the median ratio of all significantly matched spectra with tag signals.
Ingenuity GO and Pathway Analysis
Functional analysis of the data set was done using the Ingenuity GO (Gene Ontology) and Pathway Knowledge Base (Ingenuity Systems, Redwood City, CA, www.ingenuity.com). The functional analysis identified biological functions and/or diseases that were most significant to the data set. The analysis was done against the Ingenuity Knowledge Base. Fischer's exact test was used to calculate a p value determining the probability that each biological function and/or disease assigned to that data set is because of chance alone. Canonical pathway analysis identified the pathways from the Ingenuity Pathway Knowledge Base that were most significant to the data set. The significance of the association between the data set and the canonical pathways was measured (1) by the ratio of the number of proteins from the data set that map to the canonical pathway divided by the total number of proteins that map to the canonical pathway and (2) by Fisher's exact test (see above). The focus genes from the two short lists were overlaid onto a global molecular network developed from information contained in the Ingenuity Pathway Knowledge Base. This generated networks based on the connectivity of the individual proteins. At the same time, protein cluster and the assignment of differentially expressed genes were generated.
Statistical Analysis
The data were processed with SPSS 16.0 statistics software; descriptive data were expressed as median (range) for continuous variables and as percent for categorical variables. Analysis of continuous variables was done using Mann-Whitney U test, and that of categorical variables was compared using the Chi-square test. A mean value and standard error of multiple data points were used to represent the final result. Student's t test was used in statistical analysis of the data between two groups.
RESULTS
Global Protein Profiling of the Brain Regions from Different Human Prion Diseases
To screen the potential difference in brain protein expressions among human prion diseases and normal control, stored postmortem brain tissues of the cortex and cerebellum regions of the patients with sCJD, FFI, G114V gCJD, and normal control were separately subjected into iTRAQ based proteomic study. Considering we utilized an established algorithm for analyzing iTRAQ data (15), we did not set up the paralleled controls. Prior to the trypsin digestion, all eight brain extracts were evaluated by a SDS-PAGE, which revealed reliable protein integrity (supplemental Fig. S1A). After digestion with trypsin and labeling with iTRAQ separately, all tested samples were pooled for peptide fractionation and identification. The data of MS/MS for digested peptides searched in the Uniprot_human showed most of the digested peptides distributed at the range between 10 and 20 amino acids, reflecting the high-efficiency trypsin digestion (supplemental Fig. S1B). In total, 256,139 MS/MS spectra were achieved, among them 61,050 were matched spectra. 2287 proteins, elicited from 14,534 unique peptides were identified with quantitative information both in cortex and cerebellum brain regions and all the proteins were identified with 95% confidence interval by the Peptide Prophet Algorithm (supplemental Table S1). The annotated spectra for some selected proteins (20 most up- and down-regulated proteins in cortex and 20 in cerebellum) among 2287 identified ones were showed as supplemental Table S2.
Using the standards of 1.2-, 1.5-, and 2.0-fold change, the potential differentially expressing proteins in each disease were separately counted. The exact numbers of the up- and down-regulated proteins in cortex and cerebellum tissues from the groups of sCJD, FFI, and G114V gCJD were shown in Fig. 1A. The numbers of 1.2-, 1.5-, and 2.0-fold changed proteins in cortical regions were 1178, 403, and 117 in sCJD, 878, 235, and 74 in FFI, 1314, 537 and 183 in G114V gCJD, whereas those in cerebella regions were 1412, 671, and 158 in sCJD, 1356, 622, and 221 in FFI, 1503, 765, and 316 in G114V gCJD, respectively. For exploring the potential changes in proteomic profiles among the different human prion diseases maximally, we used the proteins that were 1.2-fold increased or decreased as the differential expressing proteins in further analyses.
Fig. 1.

Numbers of the differentially expressed proteins identified in the cortex and cerebellum tissues from sCJD, FFI, and G114V gCJD cases. A, Individual numbers of the up- and down-regulated proteins in the cortex and cerebellum tissues from the groups of sCJD, FFI, and G114V gCJD based on the standard of 1.2-, 1.5-, and 2.0-fold change, respectively. The numbers of the total changed proteins each group are shown on the top of each column and the p value between the groups of cortex and cerebellum (with 1.2-fold changed) is indicated on the top of graph. The exact numbers of the up- and down-regulated proteins each group are shown on the bottom. B, Numbers of the commonly up-regulated and down-regulated proteins (with 1.2-fold changed) in cortex and cerebellum regions of three prion diseases. The p value between the groups of cortex and cerebellum is indicated on the top.
As shown in Fig. 1A and Table II, the numbers of the changed proteins (< or > 1.2-fold change) in the cerebellum tissues of three prion diseases were significantly higher (p = 0.039) than that of the individual cortex regions. More numbers of the changed proteins were identified in the brains of G114V gCJD and sCJD regardless of cortex or cerebellum, whereas FFI contained remarkably less changed proteins especially in the cortex regions. The portions of the up- and down-regulated proteins between two tested brain regions or among three prion diseases were almost the same.
Table II. The numbers of changed proteins in the brain regions of human prion diseases.
| Region | Tendency | Changed in all diseases n (%)a | Changed in one special disease |
||
|---|---|---|---|---|---|
| sCJD n (%)a | FFI n (%)a | G114V n (%)a | |||
| Cortex | Up | 161 (51.60%) | 599 (50.84%) | 454 (51.71%) | 636 (48.40%) |
| Down | 151 (48.40%) | 579 (49.16%) | 424 (48.29%) | 678 (51.60%) | |
| Cerebellum | Up | 348 (47.87%) | 727 (51.49%) | 696 (51.33%) | 755 (50.23%) |
| Down | 379 (52.13%) | 685 (48.51%) | 660 (48.67%) | 748 (49.77%) | |
a Percentages of the special changed proteins in total changed proteins.
Of those 2287 identified brain proteins, 161 (7.0%) and 151 (6.6%) were commonly up-regulated and down-regulated significantly in cortex regions, whereas 348 (15.2%) and 379 (16.6%) were commonly up-regulated and down-regulated in cerebellum regions of all diseased samples, respectively (Table II). Obviously, cerebellum tissues contained significantly more numbers of commonly changed proteins than cortex tissues (p = 0.003, Fig. 1B). The top 10 commonly up- and down-regulated proteins in the cortex and cerebellum regions of three kinds of prion disease were shown in supplemental Table S2, with the highest increase of 8.275 (adenylate kinase isoenzyme 5) in the cortex and 10.162 (electrogenic sodium bicarbonate cotransporter 1) in the cerebellum, and the lowest decrease of 0.046 (cysteine desulfurase) in the cortex and 0.075 (Kinesin-like protein KIF3A) in the cerebellum.
Hierarchical Clustering Analysis of the Identified Brain Proteins from Different Human Prion Diseases
To explore the relationship of the changed proteins among the three prion diseases and between the two tested brain regions, the hierarchical clustering analysis was performed in the context of all 2287 identified proteins after being normalized with the value of each protein in the group of normal controls. Two major clusters were formed (Fig. 2), revealing a region-dependent manner that the profiles of the identified proteins of three human prion diseases clustered about each other based on the tested brain regions. In addition, the profiles of FFI, either in cortex or cerebellum, appeared to be closer to those of sCJD than those of G114V gCJD.
Fig. 2.
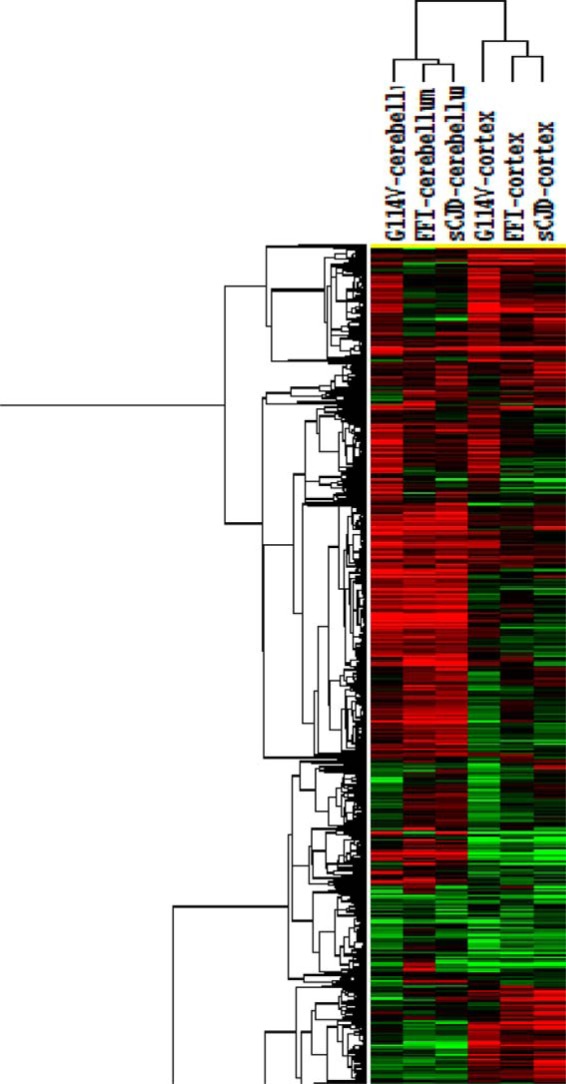
Hierarchical clustering analysis of the changed proteins in the cortex and cerebellum regions of sCJD, FFI, and G114V gCJD cases versus normal control.
Analysis of the Alterative Patterns of the Identified Brain Proteins from Different Human Prion Diseases
To obtain the overviews of the brain protein alterations in various subtypes of human prion diseases, the changing values of individual 2287 identified proteins in every disease were displayed logarithmically after being normalized with the data of normal controls. As shown in supplemental Fig. S2A, in the assays of cortex regions, G114V gCJD and sCJD appeared to have more dots in the areas of higher or lower log values than FFI, whereas in the pictures of cerebellum, the dot distributions of three prion diseases were quite similar (supplemental Fig. S2B). Furthermore, the numbers of the changed proteins were counted and grouped based on their changing folds, including the up-regulation of [gt]2.4-fold, 1.8–2.4-fold, 1.2–1.8-fold, the down-regulation of 0.8–0.6-fold, 0.6–0.4-fold and <0.4-fold. The percentage of the changed proteins in each group was calculated in the context of whole changed proteins. As illustrated in Fig. 3, majorities of the changed proteins in cortex and cerebellum of three prion diseases were located in the mildly changed groups (1.2–1.8 fold up-regulation and 0.8–0.6 fold down-regulation). Compared with sCJD and G114V gCJD, FFI had lower percentages in the severely [gt]2.4-fold increased and <0.4-fold decreased) and moderately (1.8–2.4-fold increased and 0.6–0.4-fold decreased) changed groups in cortex, while they had lower percentages only in the severely changed groups in cerebellum. The portions of the proteins in severely and moderately changed groups of the cerebellum were higher than that of the cortex in all tested prion diseases. In addition, the ratios of down-regulated proteins in the severely and moderately changed groups were higher than that of up-regulated ones (Fig. 3).
Fig. 3.

The percentages of whole changed proteins in cortex and cerebellum regions of sCJD, FFI, and G114V sCJD based on their changing folds. The changed proteins are grouped as up-regulation (>2.4-fold, 1.8–2.4-fold, and 1.2–1.8-fold) and down-regulation (0.8–0.6-fold, 0.6–0.4-fold, and <0.4-fold) after normalized with those of normal control. The percentage of the changed proteins in each group was showed on the bottom.
Involvement of Significant Pathways in Human Prion Diseases
Considering the possible involved biological pathway of the differentially expressed proteins, Kyoto Encycloppedia of Genes and Genomes (KEGG) pathway analysis was conducted using the software of KOBAS2.0. In the region of the cortex, a total of 183 different pathways were identified in the group of sCJD and 14 possible affected biological pathways were addressed with a significant difference (p < 0.05). Meanwhile, a total of 200 pathways were identified in FFI and seven with a significant difference (p < 0.05), and a total of 181 pathways were identified in G114V gCJD and 13 with a significant difference (p < 0.05). The pathways of viral myocarditis, Parkinson's disease, Alzheimer's disease, lysosome, oxidative phosphorylation, protein export, and drug metabolism-cytochrome P450 were the most commonly affected pathways, which were identified from at least two different diseases (in bold type, Table III). In the region of the cerebellum, 197 pathways were identified in sCJD and five with a significant difference (p < 0.05). A total of 199 pathways were identified in FFI and five with a significant difference (p < 0.05). Meanwhile, a total of 207 pathways were confirmed in G114V gCJD and 10 with a significant difference (p < 0.05) (Table III). Comparison of the affected pathways in cortex and cerebellum illustrated that Parkinson's disease, Alzheimer's disease, oxidative phosphorylation, and drug metabolism-cytochrome P450 were the commonly affected ones. Pathways related with neurodegenerative diseases were shown in the identified pathways including Parkinson's disease, Alzheimer's disease, Amyotrophic lateral sclerosis (ALS), and Huntington's disease and all these pathways contained relatively more proteins. Furthermore, the involved pathways in each group were analyzed based on the proteins with more than 1.5- and 2.0-fold changed compared with that in normal control. The affected pathways with a significant difference (p < 0.05) were summarized in the supplemental Tables S3 and S4. Metabolism of xenobiotics by cytochrome P450, Drug metabolism-cytochrome P450, PPAR signaling pathway, Fatty acid metabolism, Fatty acid elongation in mitochondria, and SNARE interactions in vesicular transport were commonly observed pathways in the assays based on the proteins with 1.2-, 1.5-, or 2.0-fold change (Table III).
Table III. KEGG Pathway analyses of the identified proteins in the brain tissues of human prion diseases. Pathways in bold type represent the commonly involved ones identified from at least two different diseases.
| Region | Group | Number | Pathway | p value | Count | UniProt accession |
|---|---|---|---|---|---|---|
| Cortex | sCJD vs. Ctrl | 1 | Viral myocarditisa | 0.0004 | 19 | C9JKI3, P06241, B4DLJ8, P05362, P01860, P01876, P01861, P35579, P01857, F5H8J4, P01859, P35580, Q14118, C9JFR7, G5E9S1, A9R9N8, P46939, P01877, H0Y3P2 |
| 2 | Intestinal immune network for IgA production | 0.0032 | 7 | B4DLJ8, P01860, P01876, P01861, P01857, P01859, P01877 | ||
| 3 | Asthma | 0.0033 | 7 | B4DLJ8, P01860, P01876, P01861, P01857, P01859, P01877 | ||
| 4 | Staphylococcus aureus infection | 0.0067 | 10 | B4DLJ8, P05362, P01860, P01876, P01861, P01857, P01859, P02679, P01877, H7C5H1 | ||
| 5 | Primary immunodeficiency | 0.0075 | 6 | P01860, P01876, P01861, P01857, P01859, P01877 | ||
| 6 | Allograft rejection | 0.0079 | 8 | B4DLJ8, P01860, P01876, P01861, P01857, P01859, A9R9N8, P01877 | ||
| 7 | Autoimmune thyroid disease | 0.0079 | 8 | B4DLJ8, P01860, P01876, P01861, P01857, P01859, A9R9N8, P01877 | ||
| 8 | Chloroalkane and chloroalkene degradation | 0.0169 | 5 | P30837, J3QRD1, P05091, E5RFU2, P11766 | ||
| 9 | Fc gamma R-mediated phagocytosis | 0.0212 | 24 | Q9Y6W5, P59998, O15145, B3KR49, Q05193, E9PCV4, P07948, O00401, P01860, P01876, G3V1A4, P01861, P01857, P49418, P01859, G3V5P4, F5H1A8, P29966, P46109, P49006, Q5T0I0, P01877, Q02750, E9PEQ4 | ||
| 10 | African trypanosomiasis | 0.0218 | 11 | P05362, P01860, P69905, P01876, P01861, P01857, P01859, P02647, P01877, P68871, P02042 | ||
| 11 | Parkinson's disease | 0.0228 | 31 | O75251, C9JKQ2, P25705, P12235, O95168, P24539, G3V0I5, P09669, D6R9H7, P15954, P56556, P28331, P10606, O75947, Q16718, E7EPV7, P07919, P10176, Q08752, P30049, P14927, O75380, P18859, C9JFR7, O14561, P20674, O43181, Q99497, P68036, P56181, C9JSN6 | ||
| 12 | Leishmaniasis | 0.0314 | 9 | B3KR49, B4DLJ8, P01860, P01876, P01861, P01857, P01859, P49006, P01877 | ||
| 13 | Alzheimer's disease | 0.0442 | 35 | P25705, P16615, G5E9P1, B3KR49, O95168, P24539, H0YEH5, G3V0I5, P09669, D6R9H7, P15954, P56556, P28331, Q99714, P07384, P10606, O75947, H7C0V9, Q16718, E7EPV7, P07919, P10176, P30049, P14927, O75380, P18859, C9JFR7, O14561, P20674, O43181, F6U1T9, P56181, P62158, C9JSN6, E7ENA9 | ||
| 14 | Fc epsilon RI signaling pathway | 0.0465 | 12 | P06241, D7R525, B3KR49, P07948, P01860, P01876, P01861, P01857, P62993, P01859, P01877, Q02750 | ||
| FFI vs. Ctrl | 1 | Lysosome | 0.0007 | 19 | Q8N8Y2, Q00610, Q9UI12, O43747, F5H4C6, F8WDL0, F5H569, P10253, P61421, P07339, Q14108, P07602, E9PMG2, B4E2S7, G3V2V8, E7EMM4, P11279, P07858, F5H325 | |
| 2 | Viral myocarditis | 0.0160 | 14 | C9JKI3, P16190, Q14118, P35579, C9JFR7, P46939, F5H8J4, A9R9N8, P01860, P55957, P01857, P01876, P01877, H0Y3P2 | ||
| 3 | Amyotrophic lateral sclerosis (ALS) | 0.0210 | 11 | P48454, P16298, P42262, B4DJA5, P07197, P00441, P12036, P07196, C9JFR7, P55957, P43004 | ||
| 4 | Phosphatidylinositol signaling system | 0.0211 | 11 | P78356, O95674, F5H860, Q9NQ66, C9JFZ1, H0YIJ6, G5E9P1, C9J173, P17252, P62158, H7BXS3 | ||
| 5 | Protein export | 0.0224 | 5 | F8W776, P49458, P11021, P37108, P61619 | ||
| 6 | Hematopoietic cell lineagea | 0.0261 | 7 | E9PNW4, P01860, D6RFL4, P01857, A6NNI4, P01876, P01877 | ||
| 7 | p53 signaling pathway | 0.0432 | 3 | C9JFR7, P55957, E9PJC7 | ||
| G114V vs. Ctrl | 1 | ECM-receptor interactiona | 0.0023 | 15 | P55268, Q7L0J3, Q7L1I2, Q08722, Q92752, H2N331, E7EWZ6, B4DHD4, E9PFQ6, P08123, P05556, Q14118, H0YD13, P12109, E9PC84 | |
| 2 | Oxidative phosphorylation | 0.0033 | 66 | H3BNX8, Q9NX14, O75251, E9PRJ5, C9JSN6, P61421, P19404, Q9P0J0, Q86Y39, Q9UI12, Q8N8Y2, Q16718, E9PIC0, O14561, P21281, P47985, Q16795, P51970, O75306, P07919, P38606, P14406, D6RJD6, G3V0I5, P13073, O75438, Q96II6, P28331, E9PPW7, P21283, O75489, F5H569, O95299, G3V2S6, P56556, Q16864, P36543, P36542, O75964, P22695, P25705, P21912, C9J8H9, O00483, P15954, P00403, C9JKQ2, P31930, P09669, P00846, Q9UDW1, E7EWP0, P06576, P10606, O43920, P30049, P14854, P24539, P24311, O95168, O95182, P48047, D6R9H7, Q15904, P03891, Q9H008 | ||
| 3 | Metabolism of xenobiotics by cytochrome P450ab | 0.0061 | 13 | O14880, G3V3B9, P78417, P11766, P28161, Q9Y2Q3, P09211, P21266, P30711, P07099, F5H7F6, P09488, P46439 | ||
| 4 | Focal adhesiona | 0.0073 | 38 | H7C144, P55268, B2RCS5, P05771, O43707, Q13153, D7R525, P12814, Q92752, E7ET75, P46109, B4DGU4, F8VYE8, P28482, O75369, P62140, H2N331, E7EWZ6, B4DQI8, B4DHD4, E9PFQ6, P08123, P06241, Q9Y490, P05556, E9PS97, P18206, Q5HY54, P00533, Q14315, F8VWB4, P17655, C9JKI3, P17252, B7Z1I0, P12109, Q6P2N0, E9PC84 | ||
| 5 | Toxoplasmosis | 0.0091 | 15 | P63096, P55268, P09471, C9JFR7, P17066, D7R525, P11142, P04899, P28482, P30405, C9K0I3, P05556, P54652, P08754, B4DLJ8 | ||
| 6 | Drug metabolism - cytochrome P450ab | 0.0212 | 13 | O14880, G3V3B9, P78417, P11766, P28161, Q9Y2Q3, P09211, P21266, P30711, F5H7F6, P27338, P09488, P46439 | ||
| 7 | Arrhythmogenic right ventricular cardiomyopathy (ARVC) | 0.0295 | 19 | H7C144, E7EN11, B2RCS5, O43707, C9JE82, P54289, P12814, F8VUW8, E5RG03, B4DGU4, H2N331, Q6UYC3, E7EWZ6, B4DHD4, Q5SW23, P05556, Q14118, P17302, P46939 | ||
| 8 | Glutathione metabolisma | 0.0305 | 21 | P48735, Q9UJ14, O14880, G3V3B9, P78417, O95881, B4DE40, P19623, B4DQJ8, O75874, P28161, Q9Y2Q3, P11413, P09211, P21266, P28838, P30711, F5H7F6, P36269, P09488, P46439 | ||
| 9 | Collecting duct acid secretion | 0.0389 | 9 | P61421, Q8N8Y2, P21281, P38606, P21283, F5H569, G3V2S6, Q16864, P36543 | ||
| 10 | Protein export | 0.0409 | 6 | F8W776, P11021, P37108, P49458, P61619, D6RDY6 | ||
| 11 | Lysosomea | 0.0416 | 22 | Q00610, P61421, P09496, Q9UI12, Q8N8Y2, P10253, O14617, F5H569, P09497, Q15904, G3V2V8, B4DDG7, Q14108, F5H241, P07858, E9PMG2, P11279, P07339, O14773, P07602, E7EMM4, B4E2S7 | ||
| 12 | Alzheimer's disease | 0.0442318562326 | 66 | P48454, H3BNX8, Q9NX14, P16298, E7EPV7, O75251, Q9NQ66, E9PRJ5, C9JSN6, P19404, Q9P0J0, Q86Y39, Q08209, Q16718, P62158, E9PIC0, O14561, P47985, Q16795, P51970, O75306, P07919, P14406, D6RJD6, G3V0I5, P13073, F6U1T9, O75438, Q96II6, P28331, E9PPW7, O75489, O95299, C9JFR7, P56556, P36542, P22695, P25705, P21912, O00483, P15954, P00403, C9JKQ2, P55957, P31930, P09669, P00846, Q9UDW1, E7EWP0, P06576, P10606, O43920, P30049, P14854, P24539, B7Z2Y0, P16615, P24311, O95168, O95182, P48047, D6R9H7, Q93084, P28482, P17655, H0YEH5 | ||
| 13 | Parkinson's disease | 0.049 | 60 | H3BNX8, Q9NX14, E7EPV7, O75251, O43464, E9PRJ5, C9JSN6, P19404, Q9P0J0, Q86Y39, Q16718, E9PIC0, O14561, Q99719, P47985, Q16795, P51970, O75306, P07919, P14406, D6RJD6, G3V0I5, P13073, O75438, Q96II6, P09936, P28331, P12235, E9PPW7, O75489, O95299, P12236, C9JFR7, P56556, P36542, P22695, P25705, P21912, O00483, P15954, P00403, C9JKQ2, P31930, P09669, P00846, Q9UDW1, E7EWP0, P06576, P10606, O43920, P30049, P14854, P24539, P24311, O95168, O95182, P48047, D6R9H7, P03891, P22314 | ||
| Cerebellum | sCJD vs. Ctrl | 1 | PPAR signaling pathwayab | 0.0089 | 16 | P02656, P02652, P02647, P07108, F5H0M0, H0Y9U7, Q9BX66, B7Z1I0, E1B6W5, C9JDE9, G3V1S9, P05413, P50416, B4DJE7, O15540, A8MW49 |
| 2 | Nitrogen metabolism | 0.0178 | 8 | P22748, O94925, P00367, P00918, E5RJI8, P15104, P35219, P31327 | ||
| 3 | Malaria | 0.0295 | 7 | P04921, E9PJK1, P05362, P68871, P69905, Q07954, P02042 | ||
| 4 | Complement and coagulation cascades | 0.0322 | 10 | P13726, E9PNW4, A6H8M8, P01024, P00488, P02679, H7C5H1, P02671, P02675, P01009 | ||
| 5 | Citrate cycle (TCA cycle)a | 0.0342 | 22 | F8W031, F8VWE3, P21399, F5GXC8, E9PB14, P40925, P31040, E9PIC0, P40926, P53396, E9PF84, P21912, O43837, P48735, P50213, P10515, F5H801, P07954, P08559, P11177, Q99798, B4DJV2 | ||
| FFI vs. Ctrl | 1 | Huntington's disease | 0.0017 | 71 | B3KUK2, P20674, P00441, P13073, Q00059, E5RK21, P09497, P00395, Q08752, P18859, O00483, P14927, Q9NQ66, P10176, O75438, P09496, D6R9H7, C9JSN6, P56181, P63010, Q5W145, E9PIC0, P45880, O75947, P08574, P30049, O14561, Q96II6, P24311, O94973, A8MVM8, P25705, P50148, P48047, Q9UI09, P31040, O43920, E7EWP0, H3BNX8, P21912, Q9UDW1, Q00610, P12235, P14406, P06576, P24539, Q9Y277, O75306, P00846, P53680, P05141, P47985, P36542, P31930, P22695, Q16718, P00403, O75489, P19404, D6RJD6, E9PPW7, Q16795, P28331, G3V0I5, Q9Y6M9, Q9P0J0, O95299, O75251, G5E9P1, P56556, O95168 | |
| 2 | Parkinson's disease | 0.0040 | 64 | P20674, P13073, P00395, Q08752, P18859, E7EPV7, O00483, P14927, P68036, P10176, O75438, P03886, D6R9H7, C9JSN6, P56181, Q5W145, E9PIC0, P45880, O75947, P08574, P30049, O14561, Q96II6, P24311, A8MVM8, P25705, P48047, Q9UI09, P31040, O43920, E7EWP0, H3BNX8, P21912, Q9UDW1, P12235, P14406, P06576, P24539, Q9Y277, O75306, P00846, P05141, P47985, P36542, P31930, P22695, Q16718, P00403, O75489, P19404, D6RJD6, E9PPW7, Q16795, P28331, G3V0I5, P03905, Q9Y6M9, Q9P0J0, O95299, O75251, O43464, P56556, O95168, P03891 | ||
| 3 | Oxidative phosphorylation | 0.0049 | 65 | P20674, P13073, P00395, P18859, O00483, P14927, P10176, O75438, P03886, D6R9H7, C9JSN6, P56181, Q5W145, E9PIC0, Q8N8Y2, O75947, P08574, P21283, P30049, O14561, Q96II6, P61421, P24311, A8MVM8, O75964, P25705, P48047, P38606, Q9UI09, P31040, O43920, E7EWP0, H3BNX8, P21912, Q9UDW1, P14406, P06576, P24539, O75306, P00846, Q15181, Q9UI12, P47985, C9J8H9, P36542, P31930, P22695, Q16718, P00403, O75489, P19404, D6RJD6, E9PPW7, Q16795, P28331, G3V0I5, P03905, Q9Y6M9, F8WDN9, Q9P0J0, O95299, O75251, P56556, O95168, P03891 | ||
| 4 | Alzheimer's disease | 0.0212 | 67 | E7ENA9, P62158, P20674, F6U1T9, B7Z2Y0, P55957, P13073, P00395, P18859, E7EPV7, O00483, P14927, Q9NQ66, P10176, O75438, D6R9H7, C9JSN6, P56181, H7C0V9, Q5W145, E9PIC0, O75947, P08574, P30049, O14561, Q96II6, P24311, A8MVM8, P25705, P50148, P48047, B3KR49, Q9UI09, P31040, O43920, E7EWP0, H3BNX8, P21912, Q9UDW1, P14406, P06576, P24539, P16615, O75306, P00846, P47985, Q99714, P36542, P31930, P22695, Q16718, P00403, O75489, P19404, D6RJD6, Q93084, E9PPW7, Q16795, P28331, G3V0I5, Q9Y6M9, Q9P0J0, O95299, O75251, G5E9P1, P56556, O95168 | ||
| 5 | beta-Alanine metabolism | 0.0483 | 13 | Q99259, B4DE40, J3QRD1, P49419, P80404, P19623, B4DJE7, O95822, P40939, P30837, P30084, Q16853, Q6NVY1 | ||
| G114V vs. Ctrl | 1 | Ribosome | 0.0010 | 46 | P47914, P62851, P05387, P62979, P62277, P39019, P05386, P62753, P30050, P46777, J3QS96, P25398, P35268, P40429, E9PKZ0, F8VUA6, P05388, C9J9K3, Q02543, Q5GGW2, P62899, E7ETK0, P49207, P62280, C9JD32, P62266, P50914, P18124, F5H1S2, J3QR09, P62249, E9PQD7, P62906, P46781, F8W181, C9JB50, P23396, P62701, Q5JR95, Q5VVC9, P62081, E7EQV9, P46783, E5RI99, D6RAN4, E9PJD9 | |
| 2 | Peroxisome | 0.0014 | 22 | B3KUK2, P00441, F5H4J2, Q9P0Z9, P04040, G5E9F5, O75874, P14920, F5GWH2, H0Y9U7, O95822, G3V1S9, Q06830, F5H0M0, P48735, Q9Y2Q3, Q13011, Q15126, C9JDE9, P51659, B1AK13, E5RFU2 | ||
| 3 | Metabolism of xenobiotics by cytochrome P450a | 0.0132 | 13 | F5H7F6, P11766, P78417, P07099, G3V3B9, Q9Y2Q3, P28161, P21266, Q6ICJ4, P09211, P30711, P46439, P09488 | ||
| 4 | Fatty acid metabolismab | 0.0180 | 21 | P11766, F5GWH2, P42765, H0Y9U7, G3V1S9, Q92947, P49748, F5H0M0, P49189, P49419, P24752, C9JDE9, P30084, E9PE82, P40939, B4E2W0, P50416, B4DJE7, P05091, Q16836, P30837 | ||
| 5 | Adipocytokine signaling pathway | 0.02371 | 8 | J3KPZ9, D7R525, F5GWH2, H0Y9U7, Q06124, G3V1S9, P42345, P50416 | ||
| 6 | Butanoate metabolisma | 0.02969 | 14 | Q99259, P80404, P08559, P55809, P11177, Q02338, P24752, Q9BUT1, C9J8Q5, P30084, B1AK13, E9PE82, P40939, Q16836 | ||
| 7 | Cell adhesion molecules (CAMs) | 0.0364 | 26 | E9PD27, H0YGA7, Q8N126, A6NIW1, B4DFI2, Q9HDB5, A8MWK3, F5GYC0, P13591, P32004, Q12860, P05362, Q7Z3B1, Q9BX67, Q9UHC6, P78357, H7BY57, Q02246, P05556, E9PF17, F8W8X7, B7ZKN0, E9PDA4, H3BM42, B4DLJ8, B4DHD4 | ||
| 8 | Fatty acid elongation in mitochondriaab | 0.0379 | 7 | P42765, E9PMG2, P30084, Q9BV79, P40939, B4E2W0, Q16836 | ||
| 9 | Drug metabolism - cytochrome P450a | 0.0422 | 13 | F5H7F6, P11766, P78417, G3V3B9, Q9Y2Q3, P28161, P21266, Q6ICJ4, P09211, P30711, P27338, P46439, P09488 | ||
| 10 | SNARE interactions in vesicular transportab | 0.0440 | 10 | P60880, P63027, Q2VPS2, O95183, F5H787, O15400, Q16623, H0YJL5, O75396, C9JFM5 |
a The pathway also appeared in the 1.5-fold changed proteins with p < 0.05.
b The pathway also appeared in the twofold changed proteins with p < 0.05.
Involvement of Significant Functional Categories in Human Prion Diseases
Based on the differentially regulated proteins in various prion diseases, GO analysis tool was performed in order to screen the affected biological functions, including biological process, molecular function, and cellular component. Each affected function was given a score automatically by software, which represented the severity of the affected biological function. The affected biological functions (with scores) in the two brain regions of three prion diseases were obtained. In line with the results of the changed proteins, the scores in cerebellum tissues of three prion diseases were slightly higher than that of the cortex tissues, and relatively lower scores were observed in the brain tissues of FFI, especially in the cortex regions. Table IV summarized the top five affected biological functions. In the context of three major functional categories and of two brain regions, the top five affected biological functions were exactly the same among sCJD, FFI, and G114V gCJD, only varying in the rank and in the score. In the ontology of biological process the top five affected biological functions were cellular process, metabolic process, response to stimulus, cellular metabolic process, and macromolecule metabolic process. In the ontology of molecular function, the top five affected biological functions were binding, protein binding, ion binding, catalytic activity, and adenylnucleotide binding or cation binding. In addition, in the ontology of cellular component, the top five affected biological functions were cell part, cell, membrane-bounded organelle, intracellular, and organelle.
Table IV. The top five significantly changed gene ontology in the brain tissues of human prion diseases.
| Region | Ontology | sCJD vs. Ctrl | FFI vs. Ctrl | G114V vs. Ctrl | |
|---|---|---|---|---|---|
| Cortex | Cellular component | 1 | Cell part(678.86) | Cell part(543.65) | Cell part(872.69) |
| 2 | Cell (407.31) | Cell (326.19) | Cell (523.62) | ||
| 3 | Membrane-bounded organelle(364.98) | Membrane-bounded organelle(275.57) | Intracellular part(421.13) | ||
| 4 | Intracellular part (314.20) | Intracellular part(250.38) | Membrane-bounded organelle(419.78) | ||
| 5 | Organelle (298.74) | Organelle (221.51) | Organelle (345.89) | ||
| Biological process | 1 | Cellular process(508.23) | Cellular process(396.16) | Cellular process(648.34) | |
| 2 | Metabolic process(257.79) | Metabolic process(209.38) | Metabolic process(323.90) | ||
| 3 | Response to stimulus(241.98) | Response to stimulus(206.35) | Response to stimulus(307.07) | ||
| 4 | Macromolecule metabolic process(189.32) | Macromolecule metabolic process(137.55) | Cellular metabolic process(230.22) | ||
| 5 | Cellular metabolic process(177.85) | Cellular metabolic process(136.51) | Macromolecule metabolic process(229.83) | ||
| Molecular function | 1 | Binding(555.99) | Binding(436.47) | Binding(733.36) | |
| 2 | Protein binding(274.18) | Protein binding(212.27) | Protein binding(334.31) | ||
| 3 | Catalytic activity(125.60) | Catalytic activity(96.23) | Catalytic activity(167.58) | ||
| 4 | Ion binding(121.09) | Ion binding(91.24) | Ion binding(164.80) | ||
| 5 | Adenyl nucleotide binding(118.00) | Adenyl nucleotide binding(90.00) | Adenyl nucleotide binding(145.60) | ||
| Cerebellum | Cellular component | 1 | Cell part(924.34) | Cell part(862.29) | Cell part(991.78) |
| 2 | Cell (554.60) | Cell (517.38) | Cell (595.07) | ||
| 3 | Membrane-bounded organelle(458.33) | Membrane-bounded organelle(446.41) | Membrane-bounded organelle(499.79) | ||
| 4 | Intracellular part(441.17) | Intracellular part(405.30) | Intracellular part(467.71) | ||
| 5 | Organelle (377.52) | Organelle (362.08) | Organelle (406.68) | ||
| Biological process | 1 | Cellular process(663.51) | Cellular process(619.11) | Cellular process(712.05) | |
| 2 | Metabolic process(362.57) | Metabolic process(341.51) | Metabolic process(387.81) | ||
| 3 | Response to stimulus(335.94) | Response to stimulus(326.70) | Response to stimulus(358.75) | ||
| 4 | Cellular metabolic process(253.07) | Macromolecule metabolic process(212.11) | Cellular metabolic process(261.92) | ||
| 5 | Macromolecule metabolic process(231.36) | Cellular metabolic process(243.87) | Macromolecule metabolic process(259.84) | ||
| Molecular function | 1 | Binding(780.06) | Binding(745.15) | Binding(828.97) | |
| 2 | Protein binding(359.02) | Protein binding(330.03) | Protein binding(381.59) | ||
| 3 | Ion binding(173.86) | Catalytic activity(173.74) | Ion binding(187.67) | ||
| 4 | Catalytic activity(173.90) | Ion binding(168.99) | Catalytic activity(187.12) | ||
| 5 | Adenyl nucleotide binding(154.20) | Cation binding(138.32) | Cation binding(156.12) |
DISCUSSION
The proteomics approach has been already applied to the investigation of proteome alternations in human neurodegenerative disease such as AD, PD, and CJD (18, 19, 20), mostly aiming to screen for potential biomarkers. In the present study we have applied isobaric peptide tags (iTRAQ) and multidimensional LC-MS/MS to identify proteins that are differentially expressed in the brain tissues of human prion diseases compared with normal control. Eight-plexes of samples including four samples of the cortex and four of the cerebellum are subjected to the proteomic assay at the same time in one approach. In total, 2287 potential proteins have been detected in human brain specimens with 95% confidence interval based on such approach.
In general, 312 and 727 commonly changed proteins in the regions of cortex and cerebellum among sCJD, FFI, and G114V gCJD have been identified, which occupy 13.6% and 31.8% of total identified proteins. Of the top 10 up-regulated proteins in the cortex and cerebellum, almost one third proteins relate with the functions of metabolic processes and one third relate with protein transport. The others proteins in the group of top 10 up-regulated proteins included heme-binding protein2 (20) and integral membrane protein 2B (21), which are associated with Alzheimer's disease (AD). In the group of up-regulated proteins in the cerebellum, AFG3-like protein 2(22) and Ataxin-10 (23) have been described to be related with development of nervous system symptoms such as ataxia and Acyl-coenayme A, Electrogenic sodium bicarbonate cotransporter-1(24) are related with pathogenesis of nervous system disease. Coronin-2B (also known as actin binding protein) plays a role in the reorganization of neuronal actin structure (25). Of the top 10 down-regulated proteins in cortex and cerebellum, almost two third proteins relate with the function of metabolic process. Four other proteins are associated with transport, such as Formin-2 in the cortex region, which is an actin-binding protein involving in actin cytoskeleton assembly and reorganization (26), the vacuolar protein sorting-associated protein 51 homolog in cerebellum region, which acts as component of the GARP complex involved in retrograde transport from early and late endosomes to the trans-Golgi network (TGN). Obviously, the functions of the metabolic process and protein transport in the brain tissues are most severely affected at the final stage of human prion diseases.
Using GO analysis, we have confirmed that the top five of the affected biological functions, including cellular component, biological process and molecular function, are completely identical in the tested samples of parietal lobe and cerebellum from sCJD, FFI, and G114V gCJD cases. Using KEGG pathway analysis, we have identified a series of significantly changed pathways. Some changed pathways, such as PD, AD, oxidative phosphorylation, lysosome, viral myocarditis, and protein export, are commonly observed among these three prion diseases, either in the cortex or cerebellum regions. It highlights that although the etiological agents and the pathogenesis may differ from each other, the global proteomic profiles in brain tissues of the three human TSEs at terminal stage possess great similarity. Interestingly, the pathways of PD, AD, and oxidative phosphorylation are also the most significantly changed ones in the assays of the global gene expression patterns in the thalamus and parietal lobe of the three Chinese FFI cases (6) and in the parietal lobe of a Chinese G114V gCJD patient (7). Such phenomena are also detected when we comparatively analyze the global transcriptional profiles in the cortex regions of Caucasian sCJD patients (27) and Chinese FFI cases (28). These data strongly indicate a good agreement of proteomics patterns and transcriptomics patterns in identifying the affected pathways in the pathogenesis of human TSEs. Moreover, our data here also propose some other affected pathways related with neurodegenerative diseases like Amyotrophic lateral sclerosis (ALS) and Huntington's disease either in the tested cortex or cerebellum. It verifies again the similarity in the contexts of the global transcriptional and translational profiles in the brains of human neurodegenerative diseases at final stage.
Our proteomic data also reveal disease-associated characteristics in the differentially expressed proteins. Compared with sCJD and G114V gCJD, FFI contains less numbers of differentially expressed proteins and lower percentages differentially expressed proteins with severe [gt]2.4-fold increased and <0.4-fold decreased) and moderate (1.8–2.4-fold increased and 0.6–0.4-fold decreased) changes, especially in the cortex regions. This profile coincides well with the neuropathology of FFI that has severe abnormalities in thalamus but usually has obviously mild changes in cortex regions (29). The numbers of differentially expressed proteins in sCJD and G114V gCJD are quite comparable and the commonly changed pathways are more frequently identified between sCJD and G114V gCJD. Further review of the neuropathological features of the patient with G114V gCJD highlights a sCJD-like pattern, showing obvious spongiform degeneration accompanied by large amounts of PrPSc deposits (13), which may partially explain the closer similarity in the brain proteomic patterns between sCJD and G114V gCJD.
We have noticed that regardless of sCJD, FFI, or G114V gCJD, the regions of the cerebellum contain significantly more numbers of both differentially expressed proteins and the commonly changed proteins, meanwhile, the ratios of severely and .moderately changed proteins in cerebellum are markedly higher than in cortex. In addition, despite the top five affected biological functions being exactly the same in the groups of cortex and cerebellum, much higher scores are seen in cerebellum. It seems that the alterations of global proteins in cerebellum of human TSEs are severe. The exact reason for this diversity between cortex and cerebellum remains unknown, though review of the clinical data of all tested patients proposes the presence of cerebellum-associated manifestations, such as ataxia, which may reflect the damage of cerebellum (11, 13). The bias of individual difference might be at least partially excluded, as the normal control used in this study derives from three health individuals. Further study with more cases will help us to address this phenomenon.
The increase of PrP protein is not found either in the cortex or cerebellum region of human TSEs. On the contrary, the signals of PrP protein in all tested samples are even lower than that of control. Large amounts of PrPSc have been observed in both cortex and cerebellum regions of those enrolled sCJD and G114V gCJD (13). PrPSc signals are also detectable in the brains of three FFI cases, with remarkably lower PK resistance (29). As the obvious structural changes from PrPC to PrPSc, which offers the latter the resistance to proteolysis, we speculate that the strong PK-resistance of PrPSc in the brain tissues of human TSEs will dramatically influence the processes for protein purification and trypsin digestion during proteomics assays. In line with the presence of obvious gliosis and neuron loss in cortex and cerebellums of sCJD and G114V gCJD(30), our proteomics data have also illustrated up-regulated GFAP that is the biomarker for astrocytes and down-regulated NSE and MAP-2 that are the biomarkers for neurons in the tested samples of sCJD and G114V gCJD (4).
The rapid development of proteomics technologies and high sensitivity of the iTRAQ combined with multidimensional LC and MS detection allow us not only to identify but also to quantify the protein change in the tested samples. Controlled with the technology of iTRAQ, more less-changed proteins could be identified with traditional 2D-gel images and MS. With such methods, we have explored the global differential expression patterns of brain proteins and proposed the significantly affected pathways in several subtypes of human TSEs. The discovery of a high number of changes in proteomics of human prion diseases may provide useful clues in the search for potential biomarkers for diagnosis of different types of human prion disease.
Supplementary Material
Footnotes
Author contributions: X.D. designed research; Q.S., X.Z., C.T., and J.W. performed research; L.C., B.Z., W.Z., C.G., and J.H. contributed new reagents or analytic tools; K.X. and C.C. analyzed data; Q.S. wrote the paper.
* This work was supported by Chinese National Natural Science Foundation Grants (81301429), China Mega-Project for Infectious Disease (2011ZX10004-101, 2012ZX10004215), and SKLID Development Grant (2012SKLID102).
 This article contains supplemental Fig. S1 and Tables S1 to S4.
1 The abbreviations used are:
- TSEs
- transmissible spongiform encephalopathies
- AD
- Alzheimer's disease
- PD
- Parkinson's disease
- sCJD
- sporadic Creutzfeldt–Jakob disease
- FFI
- fatal familial insomnia
- gCJD
- G114V genetic CJD
- iCJD
- iatrogenic CJD
- vCJD
- variant CJD
- GSS
- Gerstmann–Sträussler–Scheinker disease
- iTRAQ
- Isobaric tags for relative and absolute quantitation
- LC
- liquid chromatography
- PrP
- prion protein
- GO
- Gene Ontology
- PSW
- periodic sharp-waves
- EEG
- electroencephalogram
- MRI
- Magnetic resonance imaging
- CSF
- Cerebrospinal fluid
- BCA
- bicinchoninic acid
- TEAB
- tetraethylammonium bicarbonate
- SCX
- strong cation exchange
- HPLC
- high performance liquid chromatography
- MALDI-TOF/TOF
- matrix-assisted laser desorption/ionization time-of-flight/time-of-flight
- HCD
- higher collision energy dissociation
- CID
- collision induce dissociation
- NCE
- normalized collision energy
- KEGG
- Kyoto Encycloppedia of Genes and Genomes
- ALS
- Amyotrophic lateral sclerosis
- TGN
- trans-Golgi network.
REFERENCES
- 1. Liberski P. P. (2012) Historical overview of prion diseases: a view from afar. Folia Neuropathol. 50, 1–12 [PubMed] [Google Scholar]
- 2. Colby D. W., Prusiner S. B. (2011) Prions. Cold Spring Harb. Perspect. Biol. 3:a006833. [DOI] [PMC free article] [PubMed] [Google Scholar]
- 3. Shi Q., Jing Y. Y., Wang S. B., Chen C., Sun H., Xu Y., Gao C., Zhang J., Tian C., Guo Y., Ren K., Dong X. P. (2013) PrP octarepeats region determined the interaction with caveolin-1 and phosphorylation of caveolin-1 and Fyn. Med. Microbiol. Immunol. 202, 215–227 [DOI] [PubMed] [Google Scholar]
- 4. Guo Y., Gong H. S., Zhang J., Xie W. L., Tian C., Chen C., Shi Q., Wang S. B., Xu Y., Zhang B. Y., Dong X. P. (2012) Remarkable reduction of MAP2 in the brains of scrapie-infected rodents and human prion disease possibly correlated with the increase of calpain. PLoS One 7, e30163. [DOI] [PMC free article] [PubMed] [Google Scholar]
- 5. Gong H. S., Guo Y., Tian C., Xie W. L., Shi Q., Zhang J., Xu Y., Wang S. B., Zhang B. Y., Chen C., Liu Y., Dong X. P. (2012) Reduction of protein kinase MARK4 in the brains of experimental scrapie rodents and human prion disease correlates with deposits of PrP(Sc). Int. J. Mol. Med. 30, 569–578 [DOI] [PubMed] [Google Scholar]
- 6. Tian C., Liu D., Sun Q. L., Chen C., Xu Y., Wang S. B., Zhang B. Y., Chen C., Liu Y., Dong X. P. (2013) Comparative analysis of gene expression profiles between cortex and thalamus in Chinese fatal familial insomnia patients. Mol. Neurobiol. 48, 36–48 [DOI] [PubMed] [Google Scholar]
- 7. Tian C., Liu D., Chen C., Xu Y., Gong H.S., Chen C., Shi Q., Zhang B. Y., Han J., Dong X. P. (2013) Global transcriptional profiling of the postmortem brain of a patient with G114V genetic Creutzfeldt-Jakob disease. Int. J. Mol. Med. 31, 676–688 [DOI] [PubMed] [Google Scholar]
- 8. Otto A., Becher D., Schmidt F. (2014) Quantitative Proteomics in the field of Microbiology. Proteomics 14, 547–565 [DOI] [PubMed] [Google Scholar]
- 9. Martinez-Esteso M. J., Casado-Vela J., Selles-Marchart S., Pedreno M. A., Bru-Martinez R. (2014) Differential plant proteome analysis by isobaric tags for relative and absolute quantitation (iTRAQ). Methods Mol. Biol. 1072, 155–169 [DOI] [PubMed] [Google Scholar]
- 10. Evans C., Noirel J., Ow S. Y., Salim M., Pereira-Medrano A. G., Couto N., Pandhal J., Smith D., Pham T. K., Karunakaran E., Zou X., Biggs C. A., Wright P. C. (2012) An insight into iTRAQ: where do we stand now? Anal. Bioanal. Chem. 404, 1011–1027 [DOI] [PubMed] [Google Scholar]
- 11. Shi X. H., Han J., Zhang J., Shi Q., Chen J. M., Xia S. L., Xie Z. Q., Shen X. J., Shan B., Lei Y. J., Shi S., Zhou W., Zhang B. Y., Gao C., Liu Y. H., Song J., Guo Y. J., Wang D. X., Xu B. L., Dong X. P. (2010) Clinical, histopathological, and genetic studies in a family with fatal familial insomnia. Infect. Genet. Evol. 10, 292–297 [DOI] [PubMed] [Google Scholar]
- 12. Shi Q., Chen C., Gao C., Tian C., Zhou W., Zhang B., Han J., Dong X. P. (2012) Clinical and familial characteristics of ten chinese patients with fatal family insomnia. Biomed. Environ. Sci. 25, 471–475 [DOI] [PubMed] [Google Scholar]
- 13. Shi Q., Zhang B. Y., Gao C., Han J., Wang G. R., Chen C., Tian C., Dong X. P. (2012) The diversities of PrP(Sc) distributions and pathologic changes in various brain regions from a Chinese patient with G114V genetic CJD. Neuropathology 32, 51–59 [DOI] [PubMed] [Google Scholar]
- 14. Zhang J., Chen L., Zhang B. Y., Han J., Xiao X. L., Tian H. Y., Li B. L., Gao C., Gao J. M., Zhou X. B., Ma G. P., Liu Y., Xu C. M., Dong X. P. (2004) Comparison study on clinical and neuropathological characteristics of hamsters inoculated with scrapie strain 263K in different challenging pathways. Biomed. Environ. Sci. 17, 65–78 [PubMed] [Google Scholar]
- 15. Chen Z., Wen B., Wang Q., Tong W., Guo J., Bai X., Zhao J., Sun Y., Tang Q., Lin Z., Lin L., Liu S. (2013) Quantitative proteomics reveals the temperature-dependent proteins encoded by a series of cluster genes in thermoanaerobacter tengcongensis. Mol. Cell. Proteomics 12, 2266–2277 [DOI] [PMC free article] [PubMed] [Google Scholar]
- 16. Ren Y., Hao P., Dutta B., Cheow E. S., Sim K. H., Gan C. S., Lim S. K., Sze S. K. (2013) Hypoxia modulates A431 cellular pathways association to tumor radioresistance and enhanced migration revealed by comprehensive proteomic and functional studies. Mol. Cell. Proteomics 12, 485–498 [DOI] [PMC free article] [PubMed] [Google Scholar]
- 17. Pierce A., Unwin R. D., Evans C. A., Griffiths S., Carney L., Zhang L., Jaworska E., Lee C. F., Blinco D., Okoniewski M. J., Miller C. J., Bitton D. A., Spooncer E., Whetton A. D. (2008) Eight-channel iTRAQ enables comparison of the activity of six leukemogenic tyrosine kinases. Mol. Cell. Proteomics 7, 853–863 [DOI] [PubMed] [Google Scholar]
- 18. Swomley A. M., Forster S., Keeney J. T., Triplett J., Zhang Z., Sultana R., Butterfield D. A. (2014) Abeta, oxidative stress in Alzheimer disease: evidence based on proteomics studies. Biochim Biophys Acta. 1842, 1248–1257 [DOI] [PMC free article] [PubMed] [Google Scholar]
- 19. Schmid A. W., Fauvet B., Moniatte M., Lashuel H. A. (2013) Alpha-synuclein post-translational modifications as potential biomarkers for parkinson disease and other synucleinopathies. Mol. Cell. Proteomics 12, 3543–3558 [DOI] [PMC free article] [PubMed] [Google Scholar]
- 20. Campisi E., Cardone F., Graziano S., Galeno R., Pocchiari M. (2012) Role of proteomics in understanding prion infection. Expert Rev. Proteomics 9, 649–666 [DOI] [PubMed] [Google Scholar]
- 21. Mansourian M., Madadkar-Sobhani A., Mahnam K., Fassihi A., Saghaie L. (2012) Characterization of adenosine receptor in its native environment: insights from molecular dynamics simulations of palmitoylated/glycosylated, membrane-integrated human A (2B) adenosine receptor. J. Mol. Model 18, 4309–4324 [DOI] [PubMed] [Google Scholar]
- 22. Lobbe A. M., Kang J. S., Hilker R., Hackstein H., Muller U., Nolte D. (2014) A novel missense mutation in AFG3L2 associated with late onset and slow progression of spinocerebellar ataxia type 28. J. Mol. Neurosci. 52, 493–496 [DOI] [PubMed] [Google Scholar]
- 23. Cheng X., Gan L., Zhao J., Chen M., Liu Y., Wang Y. (2013) Changes in Ataxin-10 expression after sciatic nerve crush in adult rats. Neurochem. Res. 38, 1013–1021 [DOI] [PubMed] [Google Scholar]
- 24. Oehlke O., Speer J. M., Roussa E. (2013) Variants of the electrogenic sodium bicarbonate cotransporter 1 (NBCe1) in mouse hippocampal neurons are regulated by extracellular pH changes: evidence for a Rab8a-dependent mechanism. Int. J. Biochem. Cell Biol. 45, 1427–1438 [DOI] [PubMed] [Google Scholar]
- 25. Lemieux M. G., Janzen D., Hwang R., Roldan J., Jarchum I., Knetch D. A. (2014) Visualization of the actin cytoskeleton: Different F-actin-binding probes tell different stories. Cytoskeleton 71, 157–169 [DOI] [PubMed] [Google Scholar]
- 26. Ramabhadran V., Hatch A. L., Higgs H. N. (2013) Actin monomers activate inverted formin 2 by competing with its autoinhibitory interaction. J. Biol. Chem. 288, 26847–26855 [DOI] [PMC free article] [PubMed] [Google Scholar]
- 27. Xiang W., Windl O., Westner I. M., Neumann M., Zerr I., Lederer R. M., Kretzschmar H. A. (2005) Cerebral gene expression profiles in sporadic Creutzfeldt-Jakob disease. Ann. Neurol. 58, 242–257 [DOI] [PubMed] [Google Scholar]
- 28. Tian C., Liu D., Xiang W., Kretzschmar H. A., Sun Q. L., Gao C., Xu Y., Wang H., Fan X. Y., Meng G., Li W., Dong X. P. (2014) Analyses of the similarity and difference of global gene expression profiles in cortex regions of three neurodegenerative diseases: sporadic creutzfeldt-jakob disease (sCJD), fatal familial insomnia (FFI), and alzheimer's disease (AD). Mol. Neurobiol. 50, 473–481 [DOI] [PubMed] [Google Scholar]
- 29. Xie W. L., Shi Q., Xia S. L., Zhang B. Y., Gong H. S., Wang S. B., Xu Y., Guo Y., Tian C., Zhang J., Xu B. L., Liu Y., Dong X. P. (2013) Comparison of the pathologic and pathogenic features in six different regions of postmortem brains of three patients with fatal familial insomnia. Int. J. Mol. Med. 31, 81–90 [DOI] [PubMed] [Google Scholar]
- 30. Shi Q., Xie W. L., Zhang B., Chen L. N., Xu Y., Wang K., Ren K., Zhang X. M., Chen C., Zhang J., Dong X. P. (2013) Brain microglia were activated in sporadic CJD but almost unchanged in fatal familial insomnia and G114V genetic CJD. Virol. J. 10, 216. [DOI] [PMC free article] [PubMed] [Google Scholar]
Associated Data
This section collects any data citations, data availability statements, or supplementary materials included in this article.