

Abstract
The cytotoxic T-lymphocyte-mediated killing of virus-infected cells requires previous recognition of short viral antigenic peptides bound to human leukocyte antigen class I molecules that are exposed on the surface of infected cells. The cytotoxic T-lymphocyte response is critical for the clearance of human respiratory syncytial virus infection. In this study, naturally processed viral human leukocyte antigen class I ligands were identified with mass spectrometry analysis of complex human leukocyte antigen-bound peptide pools isolated from large amounts of human respiratory syncytial virus-infected cells. Acute antiviral T-cell response characterization showed that viral transcription determines both the immunoprevalence and immunodominance of the human leukocyte antigen class I response to human respiratory syncytial virus. These findings have clear implications for antiviral vaccine design.
Human respiratory syncytial virus (HRSV)1 (1), a member of the Paramyxoviridae family of the Mononegavirales order, is the single most important cause of serious lower respiratory tract illnesses, such as pneumonia and bronchiolitis in infants and young children (2–4). This virus infects people of all ages, and although mild infections are usually reported in healthy adults, HRSV poses a severe health risk for immunocompromised (5, 6) or elderly individuals (7, 8). Despite the immune mechanisms involved in HRSV disease and protection are not completely understood, it is known that the cytotoxic T lymphocytes (CTLs) are required to clear virus-infected cells (9). Like for all paramyxoviruses, the single-stranded, negative-sense RNA genome of this enveloped virus is sequentially transcribed by viral RNA polymerase (vRNAP) into separate mRNAs, which are involved in transcription initiation at a single 3′ promoter. Additionally, this process involves a sequential start-stop-restart mechanism (1). The vRNAP occasionally fails to reinitiate the downstream mRNA at each stop-restart junction, which leads to the loss of transcription of further downstream genes (1, 10); hence, there is an mRNA synthesis gradient that is inversely proportional to the distance of the gene from the 3′ end of the genome. Thus, the promoter-distal genes are expressed less efficiently (10, 11).
Translated viral mRNA yields proteins that can be further degraded by proteasomes (12), and in some cases, by other cytosolic proteases (13), which generate an extremely diverse pool of peptides both in sequence and length that can be translocated to the endoplasmic reticulum (ER) lumen by transporters associated with antigen processing. Among them, only a small fraction with a correct size or NH2-terminally extended precursors can be used for antigen presentation by direct ligand binding to human leukocyte antigen (HLA) class I molecules or by precursor editing and customization by ER-resident aminopeptidase activity (14), respectively, to yield the final viral ligand. Finally the stable trimolecular peptide-HLA-β2-microglobulin complexes are transported to the infected cell membrane where they can be recognized by antiviral T lymphocytes, an event that will end in the killing of the infected cell (15).
The general antigen processing and presentation rules that are applicable to individual viruses or families of viruses are largely unknown, despite the importance of the different elements of the HLA class I antigen processing and presentation pathway (e.g. ubiquitination, proteasome, cytosolic, and ER-resident proteases, TAP, chaperones, and HLA peptide binding). Additionally, the TCR repertoire or regulatory T cells, among others, have been described in multiple studies that contribute to the antigen processing and presentation of individual epitopes (e.g. influenza A and HIV, which are summarized in (16)). We are interested in the identification of viral ligands that are presented by several frequent HLA class I molecules in HRSV-infected cells to analyze how the immune system selects natural HLA class I ligands and epitopes. Immunoproteomics analysis of peptide pools from HRSV-infected cells has led to the identification of several new naturally processed ligands from different viral proteins that together with ligands identified in previous studies (17, 18), define both the nature and hierarchy of the T-cell class I specific response against HRSV.
EXPERIMENTAL PROCEDURES
Mice
HLA-A*0201 (19) -B*0702 (20), and -B*2705 (21) transgenic mice were bred in our animal facilities in strict accordance with the recommendations of the Guide for the Care and Use of Laboratory Animals of the Spanish “Comisión Nacional de Bioseguridad” of the “Ministerio de Medio Ambiente y Medio Rural y Marino” (accreditation number 28079–34A). The protocol was approved by the Committee on Animal Experiment Ethics of the Institute of Health “Carlos III” (Permit Number: PI-283). All of the procedures were performed under sodium pentobarbital anesthesia, and all efforts were made to minimize suffering.
Cell Lines
The mouse RMA-S cell lines (TAP negative) that stably express HLA-A*0201 (22), -B*0702 (20), or -B*2705 (23) have been previously described. All cell lines were cultured in RPMI 1640 medium supplemented with 10% fetal bovine serum and 5 μm β-mercaptoethanol.
Synthetic Peptides
Peptides were synthesized in a peptide synthesizer (model 433A; Applied Biosystems, Foster City, CA) and purified by reversed-phase HPLC. The correct molecular mass of the peptides was established by MALDI-TOF MS, and their correct composition was determined by quadrupole ion trap microHPLC.
HRSV Infection of the Human JY Epstein-Barr-Transformed Cell Line
JY cells (HLA-A*0201, -B*0702, and -C*0702) were incubated with the HRSV Long strain and assayed at different times for the presence of HRSV antigens using flow cytometry, as previously described with either Epstein-Barr-transformed human B-cell lines (24) or other cell lines (17) to obtain a persistently infected JY-cell line that synthesized HRSV viral proteins and secreted infectious virus several months after infection.
HLA-Bound Peptide Isolation
HLA-bound peptides were isolated from 4 × 10¹⁰ healthy or HRSV-infected JY cells. The cells were lysed in 1% CHAPS (Sigma), 20 mm Tris/HCl buffer, and 150 mm NaCl, pH 7.5 in the presence of a protease inhibitor mixture. The HLA-peptide complexes were isolated via affinity chromatography from the soluble cell extract fraction with the following mAbs, which were used sequentially: PA2.1 (anti-HLA-A2) (25), ME1 (anti-HLA-B7) (26), and W6/32 (specific for a monomorphic pan-HLA class I determinant) (27) (supplemental Fig. S1), as previously described (28). The HLA-bound peptides were eluted at 4 °C with 0.1% aqueous trifluoroacetic acid (TFA), separated from the large subunits, and concentrated with a Centricon 3 column (Amicon, Beverly, MA), exactly as previously described (17).
Electrospray-ion Trap Mass Spectrometry Analysis
Peptide mixtures recovered after the ultra-filtration step were concentrated using Micro-Tip reversed-phase columns (C18, 200 μl, Harvard Apparatus, Holliston, MA) (17). Each C18 tip was equilibrated with 80% acetonitrile in 0.1% TFA, washed with 0.1% TFA, and then loaded with the peptide mixture. The tip was then washed with an additional volume of 0.1% TFA, and the peptides were eluted with 80% acetonitrile in 0.1% TFA. The peptide samples were then concentrated to ∼20 μl using vacuum centrifugation (17, 28).
The HLA class I peptides that were immunoprecipitated with each HLA-specific mAb were analyzed by μLC-MS/MS using an Orbitrap XL mass spectrometer (Thermo Scientific, San Jose, CA) that was fitted with a capillary HPLC column (Eksigent, Dublin, CA) (17, 28). The peptides were resolved on homemade Reprosil C18-Aqua capillary columns (75 micron ID) (29) with a 7–40% acetonitrile gradient for 2 h in the presence of 0.1% formic acid. The 7 most intense masses that exhibited single-, double-, and triple-charge states were selected for fragmentation from each full mass spectrum with CID.
Database Searches
Sequest 3.31 (Thermo-Fisher) (30) was used for peak-list generation from the μLC-MS/MS data. The peaks were identified using Proteome Discoverer 1.0 SP1 (Thermo-Fisher) and Bioworks Browser 3.3.1 SP1 (Thermo-Fisher) software programs (30) as well as the human and virus parts of the NCBI database (Jan 2013), which included 656,486 proteins. The search was not limited by enzymatic specificity; the peptide tolerance was set to 0.005 Da, and the fragment ion tolerance was set to 0.5 Da (17, 31). This search was not limited by any methodological bias (e.g. individual protein selection or HLA consensus scoring algorithm use). The identified peptides were selected if the following criteria were met: Sequest Xcorr >1.4 for singly, >2.2 for doubly, and >2.9 for triply charged peptides; P(pep) less than 1 × 10⁻³; and a mass accuracy of 0.005 Da (17, 31). When the MS/MS spectra fit more than one peptide, only the highest scoring peptide was analyzed. No peptides were found in a search of a reversed database. The purpose of the filtering criteria was to identify candidate HRSV peptide from the MS/MS scans for further manual inspection to determine whether the MS/MS fragment ion fingerprints matched the identified peptide sequences. Additionally, the corresponding synthetic peptide was made and its MS/MS spectrum was used to confirm the assigned sequence.
HLA/Peptide Stability Assays
The following synthetic peptides were used as controls in the HLA/complex stability assays: VACV A10L688–696 (ILDRIITNA, HLA-A*02-restricted) (28), A34R82–90 (LPRPDTRHL, HLA-B*07-restricted) (32), and CMV pp657–15 (RCPEMISVL, HLA-Cw1-restricted) (33). The different RMA-S transfectant cells were incubated at 26 °C for 16 h. This allowed for empty HLA class I molecule expression (without antigenic peptide) at the cell membrane that was stable at 26 °C but not at 37 °C. The cells were washed and incubated for 2 h at 26 °C with various peptide concentrations in medium without FBS. The cells were maintained at 37 °C for an additional 2 h and then collected for flow cytometry. This method allowed for the empty HLA class I molecules to become internalized, and thus we were able to discriminate between bound or unbound peptides. HLA expression levels were measured using monoclonal PA2.1 (anti-HLA-A*02) and ME1 (anti-HLA-B*07) Abs, as previously described (34). Data were acquired on a FACSCanto flow cytometer (BD Biosciences, San Jose, CA) and analyzed using BD FACSDiva software, version 6 (BD Bioscience). The cells that were incubated without peptides exhibited peak fluorescence intensities close to the background staining that were observed with the secondary Ab alone. The fluorescence index was calculated for each time point as the ratio of the mean peak channel fluorescence of the sample to that of the control incubated without peptide. Peptide binding was also expressed as EC50, which is the molar concentration of the peptide at 50% of the maximum fluorescence obtained in a concentration range of 0.01–200 μm.
IFN-γ-secreting CD8+ Cell Detection by ELISPOT
ELISPOT assays were performed as previously described (35) to detect antigen-specific CD8+ T-cell activation. Briefly, purified rat anti-mouse IFN-γ antibody (clone R4–6A2, BD Pharmingen, San Diego, CA) was coated on 96-well MultiScreen HTS HA plates (Millipore, Billerica, MA). The plates were incubated overnight at room temperature and were blocked with medium that was supplemented with 10% fetal bovine serum for 2 h at 37 °C. Duplicate cultures of erythrocyte-depleted spleen cells were prepared from HLA class I-transgenic mice at 7 days (acute response) post intranasal infection with 1 × 10⁶ pfu of Long strain HRSV at different dilutions with 10−5 m peptide. The plates were incubated overnight at 37 °C in a 5% CO2 atmosphere and were then washed with PBS-T (PBS 0.05% Tween-20). The plate wells were incubated for 2 h at room temperature with biotinylated anti-mouse IFN-γ mAb clone XMG1.2 (BD Pharmingen, San Diego, CA), washed with PBS-T, and incubated for 1 h at room temperature with horseradish peroxidase-labeled streptavidin. The plates were additionally washed before adding 3,3′-diaminobenzidine substrate (Sigma, St. Louis, MO) in 50 mm Tris buffer pH 7.4 that contained 0.015% hydrogen peroxide. To enumerate the IFNγ responses, spots were counted and wells were photographed using a Leica EZ4 HD stereo microscope and LAS EZ software (Leica Microsystems, Germany). Additionally, the percentage of CD8+ cells was determined after staining spleen cells with FITC-conjugated anti-mouse CD8 antibody (clone KT15, Proimmune, Oxford, United Kingdom). Events were acquired on a FACSCanto flow cytometer (BD Biosciences, San Jose, CA) and analyzed using BD FACSDiva software, version 6 (BD Bioscience).
Statistical Analysis
To analyze statistical significance of HLA/peptide stability and ELISPOT assays unpaired Student's t-tests were used. In addition, Chi-square test was used to analyze the distribution of HLA class I ligands. p values < 0.05 were considered to be statistically significant.
RESULTS AND DISCUSSION
Physiological Processing Generated Three Different Viral HLA-A*02:01 Ligands in Human HRSV-infected Cells
The HLA-A*02:01-bound peptide pool was isolated from large numbers of either healthy or HRSV-infected human cells. These peptide mixtures were subsequently separated by reversed-phase HPLC and analyzed using mass spectrometry. Using bioinformatic tools, three fragmentation spectra present in the HRSV-infected HLA-bound peptide pool, but absent in the control uninfected pool (data not shown), were resolved with high confidence parameters as HRSV protein peptides (Table I). Additionally, a human proteome database search failed to identify any of these spectra as human protein fragments, suggesting the viral origin of these peptides. The first ion peak, with an m/z of 511.8, was assigned to the viral amino acid sequence KLIHLTNAL, which spans residues 33–41 of the HRSV NS1 protein (Fig. 1, upper panel) that was previously identified (36). Moreover, two different ion peaks at m/z 525.3 and 681.9 were assigned to other viral peptides. These ion peaks corresponded to the TQFPHFSSV (Fig. 1, medium panel) and RLLEITREFSV (Fig. 1, lower panel) peptides, which span residues 315–323 of the N protein and 229–239 of the F protein, respectively. Virtually all fragments with a relative abundance higher than 10% of the maximum signal of the three MS/MS spectra were assigned as daughter ions of the putative peptidic sequences (Fig. 1). This theoretical assignment was confirmed by MS/MS spectrum identification of the corresponding synthetic peptide (Fig. 1). Therefore, these results indicate that a total of three HLA-A*02 ligands were endogenously processed and presented in the HRSV-infected cells.
Table I. Summary of the HRSV ligands detected with MS/MS analysis in the HRSV persistently infected JY cells.
| Experimental massa | ΔMassb | m/z | Sequencec | Protein | Position | HLA class I |
|---|---|---|---|---|---|---|
| 1362.77 | 0.2 | 2+ | RLLEITREFSV | Fusion (F) protein | 229–239 | HLA-A*02:01 |
| 1049.50 | 0.3 | 1+ | TQFPHFSSV | Nucleoprotein (N) | 315–323 | HLA-A*02:01 |
| 1049.50 | 0.3 | 2+ | TQFPHFSSV | Nucleoprotein (N) | 315–323 | HLA-A*02:01 |
| 1022.64 | −0.8 | 1+ | KLIHLTNALd | Non-structural protein 1 (NS1) | 33–41 | HLA-A*02:01 |
| 1022.64 | 0.0 | 2+ | KLIHLTNAL | Non-structural protein 1 (NS1) | 33–41 | HLA-A*02:01 |
| 942.56 | −1.6 | 1+ | NPKASLLSLd | Nucleoprotein (N) | 306–314 | HLA-B*07:02 |
| 942.56 | −1.3 | 2+ | NPKASLLSL | Nucleoprotein (N) | 306–314 | HLA-B*07:02 |
| 1330.76 | −1.9 | 2+ | RPLSLETTITSL | Non-structural protein 2 (NS2) | 19–30 | HLA-B*07:02 |
| 1027.58 | −0.9 | 2+ | FISSGLYKL | Glycoprotein (G) | 25–33 | HLA-C*07:02 |
Fig. 1.

The identification of three HLA-A*02:01 ligands in HRSV-infected cell extracts by mass spectrometry. MS/MS fragmentation spectra, which were obtained from quadrupole ion trap mass spectrometry, at ion peaks of m/z 511.8 (upper left panel), m/z 525.3 (middle left panel), and m/z 681.9 (lower left panel) were observed in the HRSV-infected cell extracts and their corresponding synthetic peptides (right panels). The vertical axis represents the relative abundance of the parental ion and each fragmentation ion detected. The horizontal axis corresponds to the m/z region in which significant daughter ions were detected. Ions generated by fragmentation are detailed, and the sequence deduced from the indicated fragments is shown in the upper box of each panel.
Two Viral HLA-B*07:02 Ligands Were Endogenously Processed in the Human HRSV-Infected Cells
Similarly to HLA-A*02:01, the HLA-B*07:02-bound peptide pool was isolated from either healthy or HRSV-infected cells. Two fragmentation spectra present in the HLA-B*07:02-bound peptide pool, but absent in the control uninfected pool (data not shown), were also resolved as HRSV protein peptides (Table I). The human proteome database search failed to identify these spectra as human protein fragments, suggesting the viral origin of these HLA-B*07-bound peptides. The first ion peak, with an m/z of 471.8, was assigned to the viral amino acid sequence NPKASLLSL, which spans residues 306–314 of the HRSV N protein (Fig. 2, upper panel) as previously identified (37). This indicated that antigen processing of this protein can generate several viral ligands bound to two different HLA class I molecules. The second ion peak, at m/z 665.9, was assigned to the RPLSLETTITSL peptide sequence (Fig. 2, lower panel), which spans residues 19–30 of the NS2 protein. Fig. 3 shows that all significant fragments of these two MS/MS spectra were assigned as daughter ions of the putative peptide sequences. As for the HLA-A*02:01 ligands, these assignments were confirmed by MS/MS spectrum identification of the corresponding synthetic peptide (Fig. 2). Collectively, these results indicate that a similar number of ligands were endogenously processed and presented by HLA-A*02:01 or -B*07:02 class I molecules in the same HRSV-infected cells.
Fig. 2.

The identification of two HLA-B*07:02 ligands in HRSV-infected cell extracts by mass spectrometry. MS/MS fragmentation spectra, which were obtained from quadrupole ion trap mass spectrometry at ion peaks of m/z 471.8 (upper left panel) and m/z 665.9 (lower left panel) were observed in HRSV-infected cell extracts and their corresponding synthetic peptides (right panels). The axes are as described in Fig. 1.
Fig. 3.

HLA-A*02:01 or -B*07:02 stabilization assay with synthetic HRSV ligands. The stability of HLA-A*02:01/peptide (A and C panels) or HLA-B*07:02/peptide (B and D panels) complexes on the surface of RMA-S transfectant cells was measured by flow cytometry. The indicated peptides were used at a 200 μm concentration (A and B panels). The mAb used were PA2.1 (A and C) or ME1 (B and D). B, The titration curves for synthetic HRSV F229–239 (circles), N315–323 (squares), and NS133–41 (triangles) peptides with HLA-A*02:01 are depicted. The CMV pp65294–302 (solid line) and VACV A10L688–696 (diamonds) peptides were used as negative and positive controls, respectively. D, The titration curves for synthetic HRSV N306–314 (squares) and NS219–30 (triangles) peptides with HLA-B*07:02 are depicted. The CMV pp65294–302 (solid line) and VACV A34R82–90 (diamonds) peptides were used as negative and positive controls, respectively. The results, calculated as the fluorescence index (A and C) or EC50 values ± S.D. (B and D) are the mean values of three or four independent experiments. Significant p values: *, p < 0.05; **, p < 0.01; ***, p < 0.001.
HRSV Ligand Binding Affinity for the A*02:01 Molecule
The classical anchor motifs for HLA-A*02:01 binding, Leu or Met at position 2 (P2), and the aliphatic C-terminal residues (SYFPEITHI database: http://www.syfpeithi.de (38)), were present in two of the three detected HRSV viral ligands (Table I). In contrast, the N315–323 ligand presented a Gln at P2; however, it was co-immunoprecipitated with an HLA-A*02-specific mAb and thus could be an unusual HLA-A*02-restricted ligand. To confirm that HLA-A*02:01 was the HLA class I molecule that presented these three ligands, HLA/peptide complex stability assays were performed using TAP-deficient RMA-S cells that were transfected with the HLA-A*02:01 molecule (Fig. 3A). The three viral ligands were bound to the HLA-A*02:01 class I molecules with EC50 values in the range commonly found among other natural high-affinity ligands (Fig. 3B). These data confirm that all ligands detected in HRSV-infected cells were presented in association with the HLA-A*02:01 molecule.
The HRSV Virus Ligand Binding Affinity for the B*07:02 Molecule
Both peptides identified as bound to HLA-B*07:02 have known anchor motifs for binding to this HLA class I molecule, which are Pro at P2 and Leu at the C-terminal residues (SYFPEITHI database (38)) (Table I). To confirm that HLA-B*07:02 is the HLA class I molecule that presents these ligands, HLA/peptide complex stability assays were performed using TAP-deficient RMA-S cells transfected with the HLA-B*07:02 molecule (Fig. 3C). Both viral ligands were bound to HLA-B*07:02 class I molecules with EC50 values similar to those of other natural high-affinity ligands (Fig. 3D). These data confirm that the ligands detected in the HRSV-infected cells were presented in association with the B*07:02 molecule. In summary, HLA-A*02:01 and B*07:02 class I molecules can both bind high-affinity ligands derived from different HRSV proteins in infected cells.
HRSV-Infected Cells Endogenously Presented a Viral Ligand by HLA Class I Molecules that was Different from HLA-A*02:01 and -B*07:02.
We sequentially immunoprecipitated HLA class I molecules (supplemental Fig. S1) to investigate the possibility of new viral HLA class I ligands that were presented by other HLA class I molecules expressed in the same HRSV-infected cells. One fragmentation spectrum present in the peptide HRSV-infected W6/32-bound pool, but absent in its control uninfected pool, was also resolved as a HRSV proteome peptide (Table I). Furthermore, the human proteome database searches also failed to identify this spectrum as a human protein fragment, suggesting the viral origin of this HLA-bound peptide. The ion peak, with an m/z of 514.3, was assigned to the viral amino acid sequence FISSGLYKL, which spans residues 25–33 of the HRSV G protein. Fig. 4 shows the experimentally obtained MS/MS spectra and the respective assignments. The putative peptide sequence was confirmed by MS/MS spectrum identification of the corresponding synthetic peptide (Fig. 4). The haplotype of the cell line used in the immunoprecipitation was HLA-A*02:01, -B*07:02, and -C*07:02, and thus the G 25–33 peptide was most likely a HLA-C*07:02 ligand.
Fig. 4.
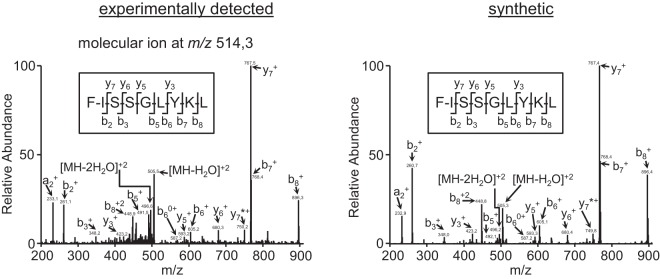
The identification of one HLA ligand in HRSV-infected cell extracts by mass spectrometry. MS/MS fragmentation spectra, which were obtained from quadrupole ion trap mass spectrometry, at an ion peak of m/z 514.3 (left panel) were observed in HRSV-infected cell extracts and in the corresponding synthetic peptide (right panel). The axes are as described in Fig. 1.
The Immunoprevalence of the HLA Class I Response was Limited by the HRSV Viral Transcription Group
Using the same experimental approach, we previously identified nine HLA-B*27:05 ligands (17) and one HLA-C*04:01 (18) ligand that along with the six different HLA class I ligands identified in the current report, raised the total number of HRSV HLA class I ligands to 16 and belonged to nine of the 11 viral proteins that are encoded by the HRSV genome in human virus-infected cells (Table II and Fig. 5). In two (HLA-B*07:02 and -B*27:05) of the five HLA class I presenting molecules of these ligands (HLA-A*02:01, -B*07:02, -B*27:05, -C*04:01, and -C*07:07), a very restricted anchor motif has been identified; thereby, the presence of Pro or Arg at P2 is almost mandatory for the HLA-B*07:02 or -B*27:05 ligands, respectively (SYFPEITHI Database (38)). Thus, the viral proteins with a high content for both of these amino acids are candidates for the HLA-B*07:02 and -B*27:05-restricted ligand source (Table III). However, no correlation between the number of the HLA ligands detected in the immunoproteomics analysis and both Pro and Arg content or viral protein size was found (Table III). Therefore, neither the content in residues used by anchor motif amino acids nor the HRSV protein size were relevant in the HLA-B*07:02 and -B*27:05 class I viral ligand selection.
Table II. Summary of the HRSV ligands identified with MS/MS analysis in persistently HRSV-infected cells.
| Protein | Position | Sequence | HLA I | HLA Binding Affinityc |
|---|---|---|---|---|
| Fusion (F) protein | 229–239 | RLLEITREFSV | HLA-A*02:01 | 1 ± 1 |
| Nucleoprotein (N) | 315–323 | TQFPHFSSV | HLA-A*02:01 | 0.4 ± 0.5 |
| Non-structural protein 1 (NS1) | 33–41 | KLIHLTNAL | HLA-A*02:01 | 8 ± 1 |
| Nucleoprotein (N) | 306–314 | NPKASLLSL | HLA-B*07:02 | 12 ± 6 |
| Non-structural protein 2 (NS2) | 19–30 | RPLSLETTITSL | HLA-B*07:02 | 9 ± 6 |
| Glycoprotein (G) | 25–33 | FISSGLYKL | HLA-C*07:02 | N.D. |
| Nucleoprotein (N) | 100–109 | HRQDINGKEMa | HLA-B*27:05 | 26 ± 5 |
| Nucleoprotein (N) | 184–194 | RRANNVLKNEMa | HLA-B*27:05 | 10 ± 1 |
| Nucleoprotein (N) | 195–205 | KRYKGLLPKDIa | HLA-B*27:05 | 5 ± 2 |
| Matrix (M) | 76–84 | SRSALLAQMa | HLA-B*27:05 | 9 ± 2 |
| Matrix (M) | 169–177 | VRNKDLNTLa | HLA-B*27:05 | 12 ± 5 |
| Polymerase (L) | 2089–2097 | GRNEVFSNKa | HLA-B*27:05 | 18 ± 3 |
| Matrix 2–22k (M2) | 150–159 | KRLPADVLKKa | HLA-B*27:05 | 9 ± 2 |
| Phosphoprotein (P) | 198–208 | LRNEESEKMAKa | HLA-B*27:05 | 14 ± 3 |
| Non-structural protein 2 (NS2) | 37–45 | HRFIYLINHa | HLA-B*27:05 | 11 ± 4 |
| Matrix (M) | 188–198 | AITNAKIIb | HLA-C*04:01 | 16 ± 12 |
Fig. 5.
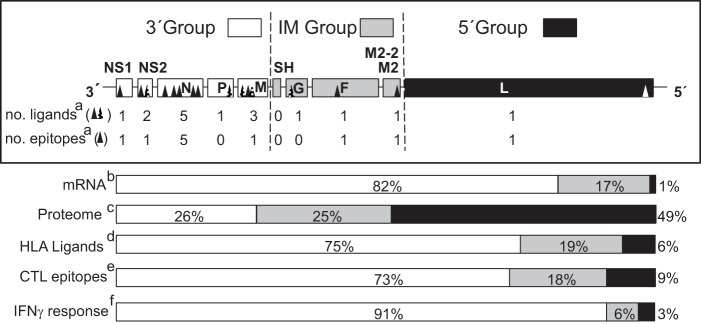
HLA class I ligands identified by mass spectrometry and their relation with the HRSV genome, mRNA, proteome, and T-cell immune response. Schematic representation of the HRSV genome indicating the three different transcription groups (3′, intermediate or IM, and 5′) encoding viral proteome separated by dotted lines. The abbreviations used for viral proteins were NS1 (Nonstructural protein 1), NS2 (Nonstructural protein 2), N (Nucleoprotein), P (Phosphoprotein), M (Matrix protein), SH (Small hydrophobic protein), G (Glycoprotein), F (Fusion protein), M2–2 (Matrix protein 2), and L (Polymerase). For each transcription group the number of HLA class I ligands identified by mass spectrometry in this report and studies (17, 18) together with the number of HLA class I epitopes identified in this report are shown in a, the transcription gradient, which was measured as the mRNA molar ratio percentage (11, 53, 54) is shown in b, the proteome percentage is shown in c, the HLA class I ligand percentage from the total is shown in d, the CTL epitope percentage from the total is shown in e, and the total IFN-γ+ immune response percentage detected in the HLA class I-transgenic mice is shown in f.
Table III. Distribution of the Pro and Arg content and HLA-B*07:02 and -B*27:05 ligands in the HRSV proteome.
| Long strain proteina | Number of | Number of Pro + Argd | % of Pro + Arge | Number of residuesf | % of proteomeg | Ligandsh | |
|---|---|---|---|---|---|---|---|
| Prob | Argc | ||||||
| L | 68 | 81 | 149 | 46.0 | 2165 | 49.2 | 1 |
| F | 16 | 18 | 34 | 10.5 | 573 | 13 | 0 |
| G | 26 | 2 | 28 | 8.6 | 186 | 4.2 | 0 |
| N | 9 | 16 | 25 | 7.7 | 391 | 8.9 | 4 |
| P | 12 | 11 | 23 | 7.1 | 219 | 5 | 1 |
| M | 12 | 6 | 18 | 5.6 | 256 | 5.8 | 2 |
| M2 | 6 | 11 | 17 | 5.2 | 195 | 4.4 | 1 |
| NS2 | 7 | 6 | 13 | 4.0 | 124 | 2.8 | 2 |
| M2–2 | 5 | 3 | 8 | 2.5 | 90 | 2 | 0 |
| NS1 | 4 | 1 | 5 | 1.5 | 138 | 3.1 | 0 |
| SH | 2 | 2 | 4 | 1.2 | 65 | 1.5 | 0 |
a Abbreviations: L (Polymerase), F (Fusion protein), G (Attachment protein), N (Nucleoprotein), P (Phosphoprotein), M (Matrix protein), M2-22k (Matrix protein 22k), NS2 (Non-structural protein 2), M2-2 (Matrix protein 2), NS1 (Non-structural protein 1), and SH (Small hydrophobic protein).
b The number of Pro in the viral proteome.
c The number of Arg in the viral proteome.
d The number of Pro + Arg in the viral proteome.
e The percentage of Pro + Arg included in the viral proteome.
f The total residue number.
g The residue number for each protein/ total residue number, as a percentage.
h The number of HLA-B*07:02 and -B*27:05 ligands in HRSV.
The HRSV genome contains 10 genes in the following order: 3′ NS1-NS2-N-P-M-SH-G-F-M2/M2–2-L (Fig. 5). These genes are transcribed sequentially as a mRNA synthesis gradient that is inversely proportional to the distance of the gene from the 3′ end of the genome and thus the promoter-proximal genes are expressed more efficiently (11). As for the other viruses that belong to the Mononegavirales order, the HRSV genome has been divided into three different mRNA expression level groups (10): 3′ core protein genes, intermediate genes, and 5′ large polymerase gene, which involve 26% (NS1, NS2, N, P, and M proteins), 25% (SH, G, F, M2, and M2–2 proteins) and 49% (L protein) of the viral proteome, respectively (Fig. 5). Thus, the analysis of the 16 natural HRSV ligands identified by mass spectrometry, which are bound to five different HLA class I molecules that cover ∼70% of the human population, shows that most (75%) of the viral ligands detected were included in proteins encoded by the 3′ group, whereas only 3 (19%) and 1 (6%) of them were integrated in proteins encoded by intermediate and 5′ groups, respectively (Fig. 5). This 12:3:1 distribution of HLA class I ligands found in the immunoproteomics analysis is statistically different to an expected random distribution (4:4:8) along the viral proteome (p value = 0.0083). Therefore, the proteins to which HLA class I antigen processing and presentation are addressed to, that is, the immunoprevalence of the HLA class I response, are limited by the HRSV transcription groups.
The Recognition of Eleven HLA-A*02:01, -B*07:02, and -B*27:05 Ligands by Specific T Cells in HRSV-infected HLA Transgenic Mice
To study in vivo the physiological relevance of the identified HLA class I viral ligands, which were identified in the current and the previous (17) studies, different HLA class I- A*02:01, -B*07:02, or -B*27:05 transgenic mice were infected with HRSV. Later, a physiological measurement of the functional ex vivo activity of T cells against the different HLA class I viral ligands identified using mass spectrometry was carried out. Spleen cells that specifically recognized cells that were pulsed with the three HLA-A*02:01 (Fig. 6A), the two -B*07:02 (Fig. 6B), and six of the nine -B*27:05 (Fig. 6C) peptide corresponding viral ligands indicated that the HLA ligands were either HLA-A*02:01, -B*07:02, or -B*27:05-restricted epitopes, respectively, and that they were simultaneously recognized as part of the acute response to HRSV. The N315–323 ligand was the immunodominant epitope in the HLA-A*02:01 response (Fig. 6A), whereas either the two HLA-B*07:02 or six -B*27:05 epitopes that were detected displayed IFN-γ+ responses of the same order (Fig. 6B and 6C). A lack of specific elements, such as ERAP2 (39), or differences between the human and murine antigen processing machineries (e.g. tapasin or the proteasomes) (40) could explain the absence of the T-cell recognition of the three HRSV ligands in the HLA-B*27 transgenic mouse model.
Fig. 6.
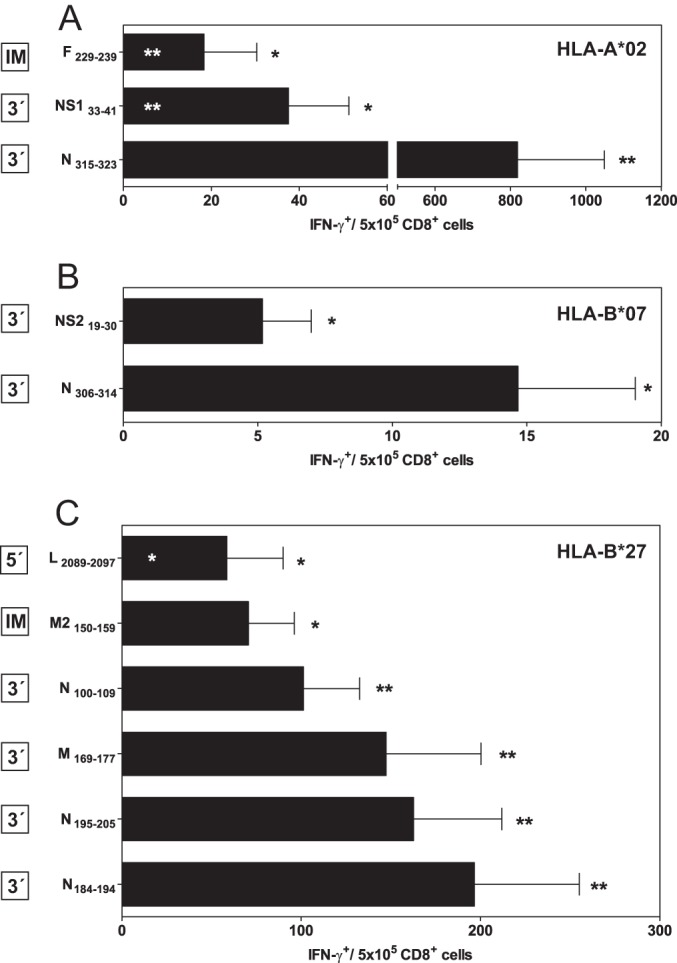
The immunogenicity of HRSV-derived HLA-A*02:01, -B*07:02, and -B*27:05-restricted peptides in the HLA class I transgenic mice. HLA-A*02:01 (A), -B*07:02 (B), or -B*27:05 (C) target cells that were prepulsed with the indicated HRSV-synthetic peptides were analyzed by ELISPOT for CD8+ T-cell activation with HRSV-specific splenocytes obtained from HLA-A*02:01, -B*07:02, or -B*27:05 transgenic mice immunized for 7 days (acute response) post HRSV infection. The results are calculated as the mean of three to nine independent experiments ± S.D. Significant p values: *, p < 0.05; **, and p < 0.01 versus negative control (black asterisks) or versus N315–323 or N184–194 ligands (white asterisks) are in the upper and lower panels, respectively. The transcription group was defined as indicated in Fig. 5 and is shown on the left box beside the respective HLA class I epitope.
The Viral Transcription Groups also Determined the Immunodominance of the T-cell Class I-specific Response
In each HLA transgenic model, the individual epitopes, which included the 3′ group ligands, showed higher specific IFN-γ+-secreting responses than the corresponding intermediate and 5′ group's ligands (Fig. 6). Quantification of the overall T-cell responses specific for the 11 epitopes presented by the three different HLA class I molecules showed that most (98%, 100%, and 88% for HLA-A*02:01, -B*07:02, and -B*27:05, respectively, and 91% for the overall T-cell response) of the specific analyzed IFN-γ+ responses were restricted by ligands from proteins that were encoded by the 3′ group. Additionally, this represented only about a quarter of the viral proteome, and a minor 6 and 3% of the CD8+ responses that were against epitopes encoded by proteins from the intermediate and 5′ groups, respectively (Fig. 5). Therefore, the T-cell class I specific response hierarchy against HRSV was dependent on the viral transcription group. In contrast, the T-cell responses to the different HRSV ligands were not related to the HLA binding affinities (Fig. 7A) nor is there relationship between the HLA binding affinity of the different HRSV ligands and the viral transcription (Fig. 7B).
Fig. 7.
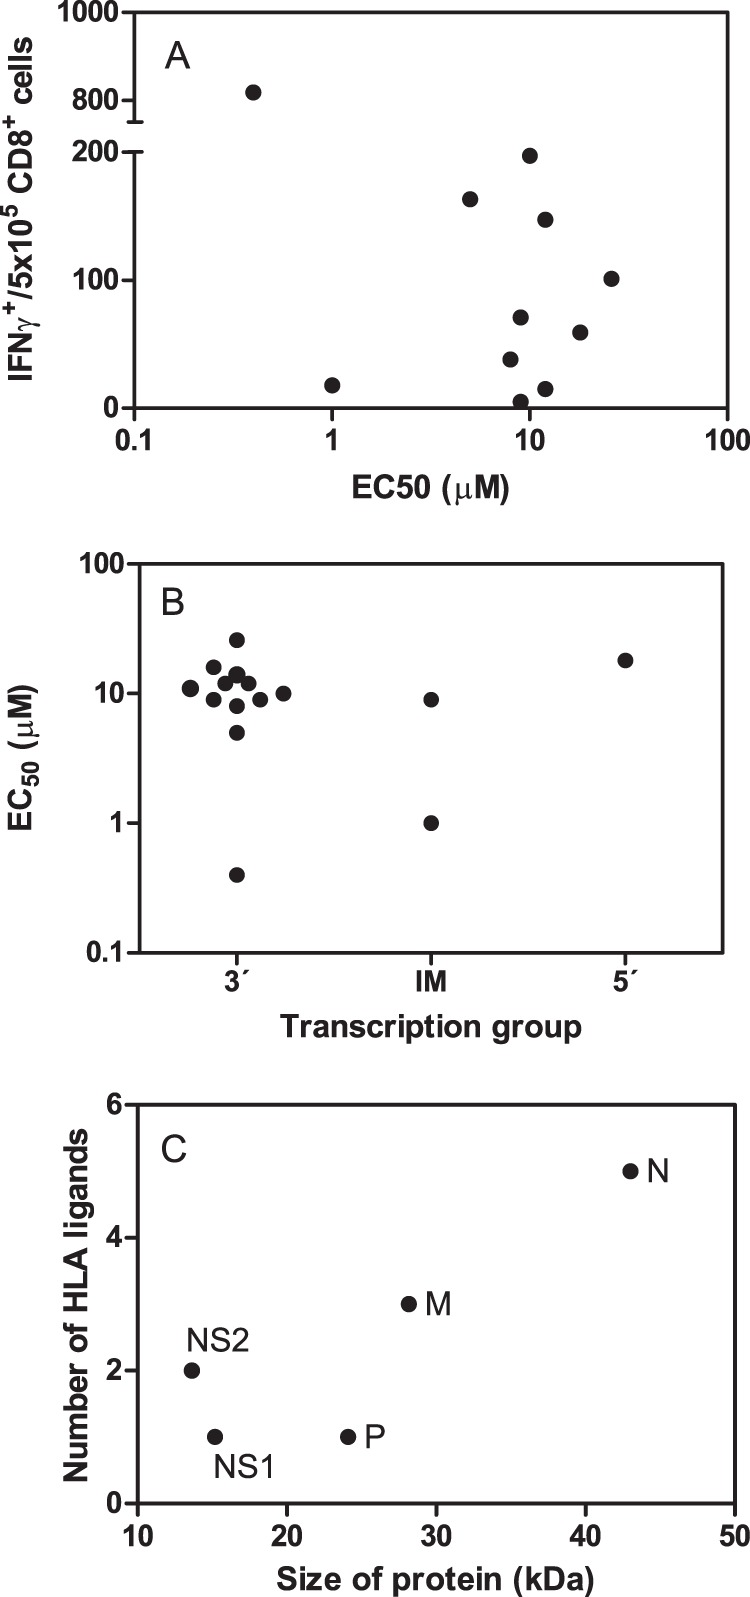
Comparison between HLA binding affinities and T-cell responses for the HLA class I ligands identified by mass spectrometry. A, the HLA binding affinity versus immunogenicity for the synthetic HRSV ligands was represented as Dot plot that represents the HLA binding affinity, which is expressed as EC50 from Table 2, versus the INFγ+ T-cell response from Fig. 6. B, The HLA binding affinities, which are expressed as EC50 from Table 2, of the different synthetic HRSV ligands that are grouped by transcriptional groups defined as indicated in Fig. 5 are shown. C, Dot plot represents the number of HLA class I ligands versus the size of the five HRSV proteins that were encoded by the 3′ transcription group.
These results are in agreement with several observations. For instance, a ligand from the C protein included in the 3′ transcription group of the paramyxo-measles virus was the HLA class I immunodominant epitope, and the other three ligands from the F and H proteins, which were included in the intermediate group or M protein of the 3′ group, were subdominant (41). Interestingly, when using bioinformatic tools to analyze the distribution of the epitopes that are described in the immune databases, a different study showed that in HCV, a virus whose entire proteome is made from a single polyprotein that is translated from a single ORF, the HLA class I epitopes are not distributed along the viral proteome; however, they are concentrated in the 3′-terminal core protein, which is encoded by a single ORF (42). Altogether, both of these studies, along with our current report, indicate that with small RNA viruses, the transcriptional regulation or the translational control are the major characteristics that limit and determine both the nature and the hierarchy of the T-cell class I specific response: the immunoprevalence and immunodominance. Thus, further studies using immunoproteomics that identify the natural epitopes from infected cells in other different virus families are needed to determine the extension of this immune mechanism. Additionally, in two bioinformatic analyses, the cellular proteins encoded by highly abundant mRNA were found to be the much more likely sources of endogenous HLA class I ligands, but the poorly transcribed mRNA also generated a significant fraction of these ligands (43, 44). In contrast, analyses of gene expression and their autologous HLA ligand densities from approximately three-hundred proteins showed no correlation between mRNA expression and the abundance of renal carcinoma-associated ligands (45).
Although multiple factors determine both the nature and the immunodominance of the T-cell responses of individual epitopes, some studies have shown the importance of some viral elements such as temporal virus protein expression. Thus, specific T-cell recognition of early but not late viral antigens was found both for herpesvirus (46) and some vaccinia virus strains (47, 48). However, although a tight correlation between onset of protein expression and vaccinia virus epitope display has been found, no connection between immunodominance and epitope abundance was described for this poxvirus (49).
Interestingly, the prevalence of HLA class I ligands (Fig. 7C) encoded by the 3′ transcription group mRNAs correlated with the respective size of each viral protein, with the immune response being mainly focused on the N protein. Therefore, the immunoprevalence in the 3′ transcription group was related to the size of the encoded protein. Additionally, the IFN-γ+ responses were also mainly focused against the N protein (Fig. 7C). These data from HLA-transgenic mice with H-2b backgrounds are in agreement with a previous study that used peripheral blood mononuclear cells from normal adults stimulated with HRSV in vitro, which identified that the N protein was the most strongly recognized protein by specific T cells from different donors (50). In contrast, the HRSV response in BALB/c mice, which was analyzed using an overlapping peptide library spanning the HRSV proteome, was targeted almost exclusively against CD8+ T-cell epitopes restricted by H-2Kd from F and M2–1 proteins included in the intermediate group (51). The use of different background strains could explain the dissimilar T-cell responses identified in mice, and these data suggest that humanized H-2b strains resemble more the human HRSV-specific HLA class I responses than the BALB/c mouse model.
In summary, the antigen processing and presentation of HLA class I epitopes from HRSV was modulated at two levels. First, by a transcription gradient, and second, by the protein size, which resulted from highly transcribed mRNAs. A confirmation of our data could be achieved with the immunologic study of a recombinant HRSV in which the different transcription groups of wild type virus were exchanged (e.g. 5′-IM-3′ or IM-5′-3′). However, a previous study proved that although gene rearrangement increases mRNA levels for 3′ proximal genes, the replication efficiency of the recombinant virus with only two or three individual rearranged genes was also decreased in a 10- or 100-fold range, respectively (52), rendering this approach quite unfeasible.
Finally, our data have evident implications for the analysis of the CTL response as well as for vaccine development, not only for HRSV and other Paramyxoviridae family members, but also for the other Mononegavirales order viruses that share the same genomic structure, although future and extensive studies with different viruses of this order are needed. For example first, multiple HRSV studies (∼60%), which targeted individual viral genes, have identified MHC class I epitopes and CD8+ T-cell responses both in humans and in mice against individual viral proteins encoded by poorly transcribed mRNAs (Immunoepitope Database) that would be less relevant in the natural HLA class I response. Thus, a bioinformatic analysis of the distribution of known HRSV epitopes from databases, such as the one reported for HCV (42), could mask the real contribution of the different viral proteins to the T-cell immune response. Second, HLA class I immunologic efforts must be prioritized to study the most significant larger proteins encoded by highly transcribed mRNAs not only for the Paramyxoviridae family but also with other virus of the Mononegavirales order, such as Rhabdovirus and Filovirus. This approach would be of great relevance for virulent viral diseases, such as the diseases caused by Ebola or Marburg viruses, for which biosafety level IV is required to work with infected cells, but where the immunoproteomics study of the 3′ core protein genes group in a non-dangerous recombinant virus for example, would yield the most relevant immunological information.
Supplementary Material
Acknowledgments
We thank C. Mir, M. Jiménez, F. Lasala and the “Centro Nacional de Microbiología” animal facility for their technical assistance.
Footnotes
Author contributions: D.L. designed research; C.J., E.L., A.B., E.B., and S.I. performed research; F.A.L. and C.S.D. contributed new reagents or analytic tools; C.J., E.L., A.B., A.A., and D.L. analyzed data; D.L. wrote the paper.
* This work was supported by the Spanish Ministry of Economy grants BIO2011-25636 to D.L. and to A. A. from the ISF 916/05. The funding agencies had no role in the study design, data collection and analysis, decision to publish, or preparation of the manuscript. We have no conflicting financial interests.
 This article contains supplemental Fig. S1.
1 The abbreviations used are:
- HRSV
- human respiratory syncytial virus
- CTL
- cytotoxic T lymphocyte
- HRSV
- human respiratory syncytial virus
- Vrnap
- viral RNA polymerase
- ER
- endoplasmic reticulum
- HLA
- human leukocyte antigen
- HPLC
- high performance liquid chromatography
- MS
- mass spectrometry
- IFN-γ
- Interferon-gamma.
REFERENCES
- 1. Collins P. L., Chanock R. M., Murphy B. R. (2007) Respiratory Syncytial Virus, In: Knipe D. M., Howley P. M. (eds), Fields Virology, 5th Ed., pp. 1443–1486, Lippincott Williams & Wilkins, Philadelphia, PA. [Google Scholar]
- 2. Hall C. B. (2001) Respiratory syncytial virus and parainfluenza virus. N. Engl. J. Med. 344, 1917–1928 [DOI] [PubMed] [Google Scholar]
- 3. Shay D. K., Holman R. C., Roosevelt G. E., Clarke M. J., Anderson L. J. (2001) Bronchiolitis-associated mortality and estimates of respiratory syncytial virus-associated deaths among US children, 1979–1997. J. Infect. Dis. 183, 16–22 [DOI] [PubMed] [Google Scholar]
- 4. Thompson W. W., Shay D. K., Weintraub E., Brammer L., Cox N., Anderson L. J., Fukuda K. (2003) Mortality associated with influenza and respiratory syncytial virus in the United States. JAMA 289, 179–186 [DOI] [PubMed] [Google Scholar]
- 5. Wendt C. H., Hertz M. I. (1995) Respiratory syncytial virus and parainfluenza virus infections in the immunocompromised host. Semin. Respir. Infect. 10, 224–231 [PubMed] [Google Scholar]
- 6. Ison M. G., Hayden F. G. (2002) Viral infections in immunocompromised patients: what's new with respiratory viruses? Curr. Opin. Infect. Dis. 15, 355–367 [DOI] [PubMed] [Google Scholar]
- 7. Han L. L., Alexander J. P., Anderson L. J. (1999) Respiratory syncytial virus pneumonia among the elderly: an assessment of disease burden. J Infect. Dis 179, 25–30 [DOI] [PubMed] [Google Scholar]
- 8. Falsey A. R., Hennessey P. A., Formica M. A., Cox C., Walsh E. E. (2005) Respiratory syncytial virus infection in elderly and high-risk adults. N. Engl. J. Med. 352, 1749–1759 [DOI] [PubMed] [Google Scholar]
- 9. Anderson L. J., Heilman C. A. (1995) Protective and disease-enhancing immune responses to respiratory syncytial virus. J. Infect. Dis. 171, 1–7 [DOI] [PubMed] [Google Scholar]
- 10. Lamb R. A. (2013) Mononegavirales, In: Knipe D. M., Howley P. M. (eds), Fields Virology, 6 Ed., pp. 881–882, Lippincott Williams & Wilkins, Philadelphia, PA [Google Scholar]
- 11. Barik S. (1992) Transcription of human respiratory syncytial virus genome RNA in vitro: requirement of cellular factor (s). J. Virol. 66, 6813–6818 [DOI] [PMC free article] [PubMed] [Google Scholar]
- 12. Shastri N., Schwab S., Serwold T. (2002) Producing nature's gene-chips: the generation of peptides for display by MHC class I molecules. Annu. Rev. Immunol. 20, 463–493 [DOI] [PubMed] [Google Scholar]
- 13. Del Val M., López D. (2002) Multiple proteases process viral antigens for presentation by MHC class I molecules to CD8+ T lymphocytes. Mol. Immunol. 39, 235–247 [DOI] [PubMed] [Google Scholar]
- 14. Hammer G. E., Kanaseki T., Shastri N. (2007) The final touches make perfect the peptide-MHC class I repertoire. Immunity 26, 397–406 [DOI] [PubMed] [Google Scholar]
- 15. York I. A., Goldberg A. L., Mo X. Y., Rock K. L. (1999) Proteolysis and class I major histocompatibility complex antigen presentation. Immunol. Rev. 172, 49–66 [DOI] [PubMed] [Google Scholar]
- 16. Akram A., Inman R. D. (2012) Immunodominance: a pivotal principle in host response to viral infections. Clin. Immunol. 143, 99–115 [DOI] [PubMed] [Google Scholar]
- 17. Infantes S., Lorente E., Barnea E., Beer I., Cragnolini J. J., García R., Lasala F., Jiménez M., Admon A., López D. (2010) Multiple, non-conserved, internal viral ligands naturally presented by HLA-B27 in human respiratory syncytial virus-infected cells. Mol. Cell. Proteomics 9, 1533–1539 [DOI] [PMC free article] [PubMed] [Google Scholar]
- 18. Infantes S., Lorente E., Cragnolini J. J., Ramos M., García R., Jiménez M., Iborra S., Del Val M., López D. (2011) Unusual viral ligand with alternative interactions is presented by HLA-Cw4 in human respiratory syncytial virus-infected cells. Immunol. Cell Biol. 89, 558–565 [DOI] [PubMed] [Google Scholar]
- 19. Firat H., Garcia-Pons F., Tourdot S., Pascolo S., Scardino A., Garcia Z., Michel M. L., Jack R. W., Jung G., Kosmatopoulos K., Mateo L., Suhrbier A., Lemonnier F. A., Langlade-Demoyen P. (1999) H-2 class I knockout, HLA-A2.1-transgenic mice: a versatile animal model for preclinical evaluation of antitumor immunotherapeutic strategies. Eur. J. Immunol. 29, 3112–3121 [DOI] [PubMed] [Google Scholar]
- 20. Rohrlich P. S., Cardinaud S., Firat H., Lamari M., Briand P., Escriou N., Lemonnier F. A. (2003) HLA-B*0702 transgenic, H-2KbDb double-knockout mice: phenotypical and functional characterization in response to influenza virus. Int. Immunol. 15, 765–772 [DOI] [PubMed] [Google Scholar]
- 21. Khare S. D., Luthra H. S., David C. S. (1995) Spontaneous inflammatory arthritis in HLA-B27 transgenic mice lacking beta 2-microglobulin: a model of human spondyloarthropathies. J. Exp. Med. 182, 1153–1158 [DOI] [PMC free article] [PubMed] [Google Scholar]
- 22. Pascolo S., Bervas N., Ure J. M., Smith A. G., Lemonnier F. A., Perarnau B. (1997) HLA-A2.1-restricted education and cytolytic activity of CD8(+) T lymphocytes from beta2 microglobulin (beta2m) HLA-A2.1 monochain transgenic H-2Db beta2m double knockout mice. J. Exp. Med. 185, 2043–2051 [DOI] [PMC free article] [PubMed] [Google Scholar]
- 23. Villadangos J. A., Galocha B., López de Castro J. A. (1994) Unusual topology of an HLA-B27 allospecific T cell epitope lacking peptide specificity. J. Immunol. 152, 2317–2323 [PubMed] [Google Scholar]
- 24. Bangham C. R., McMichael A. J. (1986) Specific human cytotoxic T cells recognize B-cell lines persistently infected with respiratory syncytial virus. Proc. Natl. Acad. Sci. U.S.A. 83, 9183–9187 [DOI] [PMC free article] [PubMed] [Google Scholar]
- 25. Parham P., Bodmer W. F. (1978) Monoclonal antibody to a human histocompatibility alloantigen, HLA-A2. Nature 276, 397–399 [DOI] [PubMed] [Google Scholar]
- 26. Ellis S. A., Taylor C., McMichael A. (1982) Recognition of HLA-B27 and related antigen by a monoclonal antibody. Hum. Immunol. 5, 49–59 [DOI] [PubMed] [Google Scholar]
- 27. Barnstable C. J., Bodmer W. F., Brown G., Galfre G., Milstein C., Williams A. F., Ziegler A. (1978) Production of monoclonal antibodies to group A erythrocytes, HLA and other human cell surface antigens-new tools for genetic analysis. Cell 14, 9–20 [DOI] [PubMed] [Google Scholar]
- 28. Lorente E., Infantes S., Barnea E., Beer I., Garcia R., Lasala F., Jiménez M., Vilches C., Lemonnier F. A., Admon A., López D. (2012) Multiple viral ligands naturally presented by different class I molecules in transporter antigen processing-deficient vaccinia virus-infected cells. J. Virol. 86, 527–541 [DOI] [PMC free article] [PubMed] [Google Scholar]
- 29. Ishihama Y., Rappsilber J., Andersen J. S., Mann M. (2002) Microcolumns with self-assembled particle frits for proteomics. J. Chromatogr. A 979, 233–239 [DOI] [PubMed] [Google Scholar]
- 30. Eng J., McCormack A., Yates J. (2009) An approach to correlate tandem mass spectral data of peptides with amino acid sequences in a protein database. J. Amer. Soc. Mass. Spect. 5, 976–989 [DOI] [PubMed] [Google Scholar]
- 31. Lorente E., Infantes S., Barnea E., Beer I., García R., Lasala F., Jiménez M., Admon A., López D. (2011) TAP-independent human histocompatibility complex-Cw1 antigen processing of an HIV envelope protein conserved peptide. AIDS 25, 265–269 [DOI] [PubMed] [Google Scholar]
- 32. Lorente E., García R., Mir C., Barriga A., Lemonnier F. A., Ramos M., López D. (2012) Role of metalloproteases in vaccinia virus epitope processing for transporter associated with antigen processing (TAP)-independent human leukocyte antigen (HLA)-B7 class I antigen presentation. J. Biol. Chem. 287, 9990–10000 [DOI] [PMC free article] [PubMed] [Google Scholar]
- 33. Kondo E., Akatsuka Y., Kuzushima K., Tsujimura K., Asakura S., Tajima K., Kagami Y., Kodera Y., Tanimoto M., Morishima Y., Takahashi T. (2004) Identification of novel CTL epitopes of CMV-pp65 presented by a variety of HLA alleles. Blood 103, 630–638 [DOI] [PubMed] [Google Scholar]
- 34. López D., Samino Y., Koszinowski U. H., Del Val M. (2001) HIV envelope protein inhibits MHC class I presentation of a cytomegalovirus protective epitope. J. Immunol. 167, 4238–4244 [DOI] [PubMed] [Google Scholar]
- 35. Tapia E., Pérez-Jiménez E., López-Fuertes L., Gonzalo R., Gherardi M. M., Esteban M. (2003) The combination of DNA vectors expressing IL-12 + IL-18 elicits high protective immune response against cutaneous leishmaniasis after priming with DNA-p36/LACK and the cytokines, followed by a booster with a vaccinia virus recombinant expressing p36/LACK. Microbes. Infect. 5, 73–84 [DOI] [PubMed] [Google Scholar]
- 36. Meiring H. D., Soethout E. C., Poelen M. C., Mooibroek D., Hoogerbrugge R., Timmermans H., Boog C. J., Heck A. J., de Jong A. P., van Els C. A. (2006) Stable isotope tagging of epitopes: a highly selective strategy for the identification of major histocompatibility complex class I-associated peptides induced upon viral infection. Mol. Cell Proteomics. 5, 902–913 [DOI] [PubMed] [Google Scholar]
- 37. Goulder P. J., Lechner F., Klenerman P., McIntosh K., Walker B. D. (2000) Characterization of a novel respiratory syncytial virus-specific human cytotoxic T-lymphocyte epitope. J. Virol. 74, 7694–7697 [DOI] [PMC free article] [PubMed] [Google Scholar]
- 38. Rammensee H. G., Bachmann J., Emmerich N. P. N., Bachor O. A., Stevanović S. (1999) SYFPEITHI: database for MHC ligands and peptide motifs. Immunogenetics 50, 213–219 [DOI] [PubMed] [Google Scholar]
- 39. Lorente E., Barriga A., Johnstone C., Mir C., Jiménez M., López D. (2013) Concerted in vitro trimming of viral HLA-B27-restricted ligands by human ERAP1 and ERAP2 aminopeptidases. PloS One 8, e79596. [DOI] [PMC free article] [PubMed] [Google Scholar]
- 40. Sesma L., Galocha B., Vázquez M., Purcell A. W., Marcilla M., McCluskey J., López de Castro J. A. (2005) Qualitative and quantitative differences in peptides bound to HLA-B27 in the presence of mouse versus human tapasin define a role for tapasin as a size-dependent peptide editor. J. Immunol. 174, 7833–7844 [DOI] [PubMed] [Google Scholar]
- 41. Herberts C. A., Meiring H. M., van Gaans-van den Brink JA, van der Heeft E., Poelen M. C., Boog C. J., de Jong A. P., van Els C. A. (2003) Dynamics of measles virus protein expression are reflected in the MHC class I epitope display. Mol. Immunol. 39, 567–575 [DOI] [PubMed] [Google Scholar]
- 42. Diez-Rivero C. M., Reche P. A. (2012) CD8 T cell epitope distribution in viruses reveals patterns of protein biosynthesis. PLoS. ONE. 7, e43674. [DOI] [PMC free article] [PubMed] [Google Scholar]
- 43. Juncker A. S., Larsen M. V., Weinhold N., Nielsen M., Brunak S., Lund O. (2009) Systematic characterisation of cellular localisation and expression profiles of proteins containing MHC ligands. PLoS. ONE. 4, e7448. [DOI] [PMC free article] [PubMed] [Google Scholar]
- 44. Fortier M. H., Caron E., Hardy M. P., Voisin G., Lemieux S., Perreault C., Thibault P. (2008) The MHC class I peptide repertoire is molded by the transcriptome. J. Exp. Med. [DOI] [PMC free article] [PubMed] [Google Scholar]
- 45. Weinzierl A. O., Lemmel C., Schoor O., Müller M., Krüger T., Wernet D., Hennenlotter J., Stenzl A., Klingel K., Rammensee H. G., Stevanovic S. (2007) Distorted relation between mRNA copy number and corresponding major histocompatibility complex ligand density on the cell surface. Mol. Cell Proteomics 6, 102–113 [DOI] [PubMed] [Google Scholar]
- 46. Pudney V. A., Leese A. M., Rickinson A. B., Hislop A. D. (2005) CD8+ immunodominance among Epstein-Barr virus lytic cycle antigens directly reflects the efficiency of antigen presentation in lytically infected cells. J. Exp. Med. [DOI] [PMC free article] [PubMed] [Google Scholar]
- 47. Kastenmuller W., Gasteiger G., Gronau J. H., Baier R., Ljapoci R., Busch D. H., Drexler I. (2007) Cross-competition of CD8+ T cells shapes the immunodominance hierarchy during boost vaccination. J. Exp. Med. 204, 2187–2198 [DOI] [PMC free article] [PubMed] [Google Scholar]
- 48. Meyer V. S., Kastenmuller W., Gasteiger G., Franz-Wachtel M., Lamkemeyer T., Rammensee H. G., Stevanovic S., Sigurdardottir D., Drexler I. (2008) Long-term immunity against actual poxviral HLA ligands as identified by differential stable isotope labeling. J. Immunol. 181, 6371–6383 [DOI] [PubMed] [Google Scholar]
- 49. Croft N. P., Smith S. A., Wong Y. C., Tan C. T., Dudek N. L., Flesch I. E., Lin L. C., Tscharke D. C., Purcell A. W. (2013) Kinetics of antigen expression and epitope presentation during virus infection. PLoS. Pathog. 9, e1003129. [DOI] [PMC free article] [PubMed] [Google Scholar]
- 50. Cherrie A. H., Anderson K., Wertz G. W., Openshaw P. J. (1992) Human cytotoxic T cells stimulated by antigen on dendritic cells recognize the N, SH, F, M, 22K, and 1b proteins of respiratory syncytial virus. J. Virol. 66, 2102–2110 [DOI] [PMC free article] [PubMed] [Google Scholar]
- 51. McDermott D. S., Knudson C. J., Varga S. M. (2014) Determining the breadth of the respiratory syncytial virus-specific T cell response. J. Virol. 88, 3135–3143 [DOI] [PMC free article] [PubMed] [Google Scholar]
- 52. Ball L. A., Pringle C. R., Flanagan B., Perepelitsa V. P., Wertz G. W. (1999) Phenotypic consequences of rearranging the P, M, and G genes of vesicular stomatitis virus. J. Virol. 73, 4705–4712 [DOI] [PMC free article] [PubMed] [Google Scholar]
- 53. Homann H. E., Hofschneider P. H., Neubert W. J. (1990) Sendai virus gene expression in lytically and persistently infected cells. Virology 177, 131–140 [DOI] [PubMed] [Google Scholar]
- 54. Tokusumi T., Iida A., Hirata T., Kato A., Nagai Y., Hasegawa M. (2002) Recombinant Sendai viruses expressing different levels of a foreign reporter gene. Virus Res. 86, 33–38 [DOI] [PubMed] [Google Scholar]
Associated Data
This section collects any data citations, data availability statements, or supplementary materials included in this article.