

Abstract
In contrast to resident constitutive mast cells (CMCs), mucosal MCs (MMCs) appear in lung and trachea of sensitized mice only following inhalation challenge. We monitored the influx and maturation of MCs by their expression of Kit, FcεRI, β7 integrin and side scatter (SSC) by flow cytometry. Influx of MC progenitors (MCps) (FcεRIlo, Kitint, β7hi, SSClo) peaks 1 day after challenges and subsides to baseline by day 7 post-challenge. The mature MMCs appear as a distinct population on day 7 and peak at day 14 with higher SSC and FcεRI expression, but lower β7 and Kit expression. A distinct transitional population is present between 1 and 7 days post-challenge. Maturation occurs more rapidly in the trachea. The resident tracheal CMC had higher SSC, FcεRI, and Kit and lower β7 integrin expression than the MMC. By histology, the MMCs follow similar kinetics to the flow cytometry-identified mature MMCs and are notably persistent for >42 days. Steroid treatment reduced inflammation and MCp influx but had no effect on established MMC. Thus changes in SSC, FcεRI, and Kit together with expression of αE/α4:β7 integrins characterizes the development of induced MMCs from MCps and distinguishes them from resident CMC in the trachea and large airways.
Keywords: mast cells, progenitors, airway inflammation, integrins
INTRODUCTION
Mast cells (MCs) are classically defined as granulated cells of hematopoietic origin that reside at the portals of pathogen or allergen entry and are best known for their ability to quickly release a number of mediators via secretion and degranulation upon activation.1-3 Classically, mature MCs have been divided into two subclasses based on their anatomical location, staining characteristics, radiation sensitivity and T cell dependence for development.4-8 The dominant MC population in naïve mice, designated as constitutive MCs (CMCs) herein, are innate immunocytes that often reside in connective tissue near blood vessels and nerves, are extensively granulated and are unaffected by T cell deficiency.6-8 In mice, they appear to arise from progenitors in the liver during fetal development.9 Mucosal mast cells (MMCs) arise from the bone marrow (BM), are induced by T cell-dependent inflammation in organs such as the intestine and airways, have a dominant intraepithelial location and are absent in mice and humans with inborn or acquired T cell deficiencies.7, 8, 10-13
MCs are generally very low or absent in the peripheral blood.11-13 The agranular or poorly granulated precursors of MCs (MCps) reside in the BM and spleen of naive adult mice. In helminth-infected mice, they increase in number at these sites and also appear in draining lymph nodes.14-17 Phenotypically, both tissue resident MCs and MCps are characterized by the surface expression of the receptor tyrosine kinase (Kit) for stem cell factor (SCF) as this pairing is required for their viability and tissue distribution and by expression of the high affinity receptor for IgE, FcεRI.16-19 Expression of α4β7 integrin by MCps was implicated by its requirement for their transendothelial migration from blood to peripheral tissues and this was confirmed by flow cytometry (FACS) analysis of BM and spleen.17, 20, 21 Once in the target organs, MCps were thought to serve one major function – conversion to mature granulated MCs of the mucosal phenotype by an underlying inflammatory process.
Because of their constitutive presence, CMC are major players in the IgE-mediated anaphylactic response of humans and animals, including mice.22 However, in humans with bronchial asthma, both intraepithelial and intramuscular MCs have been implicated in determining the degree of airways hyperresponsiveness.23, 24 In mouse models of ovalbumin-induced Th2 airway inflammation, the induced MMCs are believed to contribute to the aggregate inflammation resulting in remodeling and secondary airway hyperreactivity.25-27 Given the histologic evidence that induced MMCs are inflammation dependent and transient while resident sentinel CMCs are stable in numbers, it seemed pertinent to develop real time assays of their membrane phenotypes to follow the appearance, maturation, and disappearance of MMCs during a Th2 inflammatory response.
We find that the influx of MCps into lung, as defined by the level of expression of cell surface FcεRI, Kit, and β7 integrin with a minimal side scatter (SSC) profile, peaks early after allergen challenge in sensitized mice. This is followed by the appearance of two discrete subsets that characterize their phenotypic progression to an intermediate stage and then to the ultimate mature MMC over 14 days. This progression is accelerated in the trachea where there are few MCps. The changes in level of expression of Kit, FcεRI, the α4, αE and β7 integrins and the SSC profile that occur with maturation of MMCs are striking in contrast to their highly stable expression by the resident CMCs over the time course of 14 days post-challenges. With full maturation as MMCs, all of those expressing β7 integrin also are positive for αE. Once induced, the duration of MMCs in the airways, evaluated by histology, is substantial, lasting at least a month after elimination of antigen exposure for the large airways and somewhat longer for the trachea. However, the progressive decline in Kit expression with maturation of MMC as compared to its stable high presence in CMC seen by FACS may contribute to their differing life spans in the airways.
RESULTS
Recruitment of MCps and appearance of induced MCs in the lung after 7 aerosolized OVA challenges of sensitized BALB/c mice
To investigate the influx of MCps and their maturation in real time in the lungs of sensitized and aerosolized antigen (Ag)-challenged mice, we analyzed the CD45+, non–B, non–T cells for expression of Kit (CD117) and FcεRI. We used a mixture of anti-FcεRI and anti-IgE antibodies to detect occupied and unoccupied FcεRI on MCs because bound IgE can interfere with detection of FcεRIα by the MAR1 mAb.17 Compared to sensitized, non-challenged (NC) mice, the number of leukocytes harvested from the lungs (the inflammatory cell infiltrate) increases significantly to a peak at D1 post-challenge and declines to baseline levels by D14 (Figure 1a). At the same time, the increase in the concentration of MCs/106 CD45+ cells, peaks at D1 and persists on a plateau to D14 even though the inflammatory cell infiltrate, measured as number of leukocytes harvested, has returned to baseline.
Figure 1.
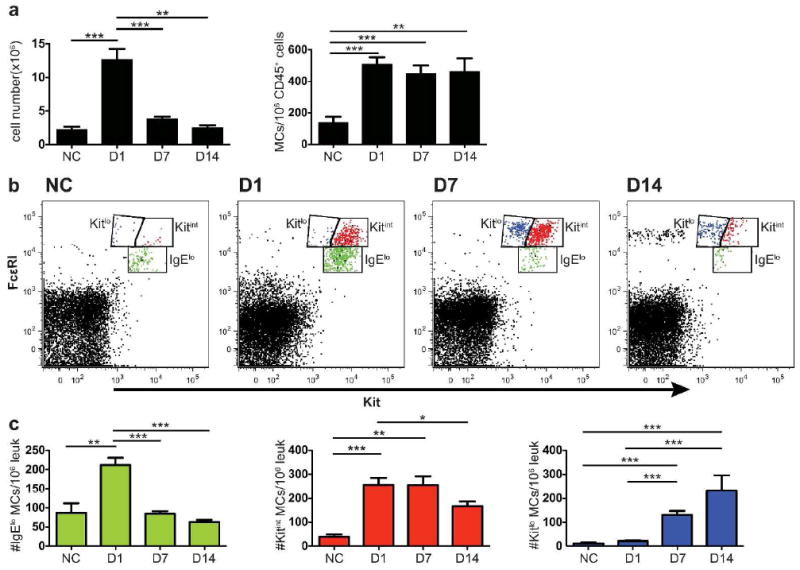
Induction of 3 populations of MCs in lung of BALB/c mice 1 to 14 days after challenges. BALB/c mice were sensitized and either not challenged (NC) or challenged for 7 consecutive days with aerosolized antigen. The lung cells were isolated and analyzed by FACS on D1, D7, and D14 after the challenges. (a) Mean leukocyte cell counts (left panel) and mean number of FcεR1+Kit+ MCs/106 CD45+CD3-CD19-CD11b-cells in the lung, determined by FACS (right panel). (b) Representative dot plots of lung cells from NC and challenged mice analyzed for FcεR1 and Kit. Three different FcεRI+Kit+ populations are designated and colored as follows: FcεRIloKitint – green, FcεRIintKitint – red and FcεRIintKitlo – blue. (c) Concentration (number/106 CD45+ leukocytes) of lung MC lineage populations (FcεR1+Kit+) colored as in (b). Bar graphs represent means ± SEMs from 5 experiments with 7-15 mice/group. * p < 0.05, **p < 0.01, ***p < 0.001
There are distinct differences in the level of expression of both FcεRI and Kit within the population of lung MCs at the various time points after challenge, which allows us to distinguish 3 populations of MCs (Figure 1b). As the 3 populations are most distinct at D7, we use this time point to set the gates to follow these phenotypes in NC mice and in mice at D1 to D14. They are designated (and colored) as FcεRIloKitint (green), FcεRIintKitint (red) and FcεRIintKitlo (blue). The population of FcεRIloKitint cells in NC mice are likely immature MCps as this population is expanded at D1 post-challenge (Figure 1b and c, green dots and bars). These MCps peak at D1 and then decline sharply to baseline by D7 consistent with our previous indirect measurements of MCps using the limiting dilution with clonal expansion assay.20, 28 The population of FcεRIintKitint MCs (Figure 1b and c, red dots and bars) appears prominently first on D1 and plateaus on D7 as compared to a negligible presence in the NC mice, implying that this is an early induced population of MCs. At D7, the population of FcεRIintKitlo cells appears prominently for the first time (Figure 1b and c, blue dots and bars). This latter FcεRIintKitlo population peaks at D14 while the FcεRIintKitint population declines suggesting a maturation relationship. The sequence for these 3 populations appearing, peaking, and resolving at the different time points after challenge implies a sequential relationship from the FcεRIloKitint MCps to early induced FcεRIintKitint MMCs (eMMCs) to mature FcεRIintKitlo MMCs. As the only induced MCs seen in mouse lung by histology with allergic inflammation are intraepithelial MMCs, we employ these designations for simplicity.
MCps and induced lung MCs also differ in their side scatter by FACS and β7 integrin expression
To further characterize these 3 populations of recruited and induced MCs, we assessed their expression of β7 integrins implicated in the transendothelial recruitment of MCps to mouse lung,20, 21 and also analyzed their size and granularity characteristics by their forward and side scatter profiles (FSC and SSC). The population of MCps at D1 in challenged mice has the highest expression level of β7 integrin as depicted for a representative result (Figure 2a, green histogram) and by the mean net MFI (mean fluorescence intensity) (green bar, bottom panel). The β7 integrin surface expression on these MCps found at D1 does not change as their numbers fall at later time points (data not shown). The eMMCs, have lower β7 integrin expression compared to the MCps on D1 (Figure 2a, red versus green line and bars). The population of MMCs has a similarly lower expression of β7 integrin at D7 (Figure 2a, blue line and bar), indicating a decline of β7 integrin expression with maturation. The level of β1 integrin expression on the cells at the 3 stages of development is similar with a small but statistically significant difference in net MFI between MCp and the more mature MCs (Figure 2b). Comparison for granularity using SSC reveals that on D7, the MCps are the least granular and comparable to splenic MCps (Figure 2c, green line versus grey shaded area). The eMMCs are intermediate for SSC and the MMCs have the highest SSC (Figure 2c, red and blue lines) compatible with further maturation. Comparison of the 3 populations for FSC characteristics shows no differences (Figure 2d).
Figure 2.
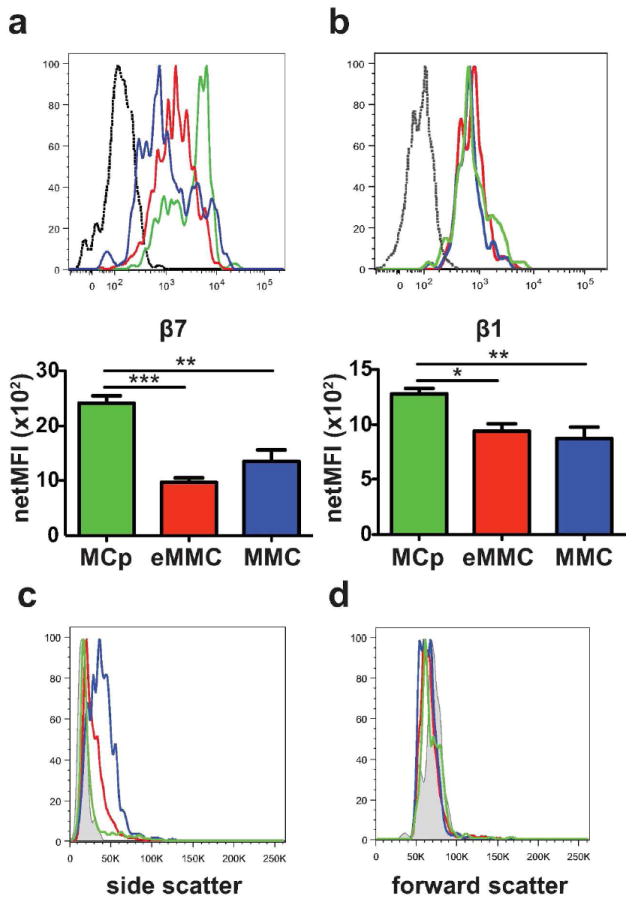
Expression of β7 and β1 integrins and forward and side scatter characteristics of inducible lung MC populations at D7 after challenges. (a) Representative histograms (top panel) and mean (± SEM) net MFI (bottom panel) of β7 integrin expression by the 3 populations of lung MCs: MCp -green, eMMC -red and MMC -blue; black dotted line -isotype control. Net MFI was determined by subtracting the value of the isotype control. (b) Representative histograms (top panel) and mean (± SEM) net MFI (bottom panel) of β1 (CD29) integrin expression by the 3 populations of lung MCs (top panel) colored as in a. (c) Representative histograms show the side scatter profile of the 3 lung MC populations colored as in a. Grey shaded area indicates immature spleen MCp. (d) Representative histograms show the forward scatter profile of the 3 lung MC populations compared to spleen MCp as in c. Histograms in c and d show the mean value from 2-3 mice/group from one of 5 experiments. Bar graphs present means ± SEMs from 3-5 separate experiments with 5-13 mice per group.
As both α4β1 and α4β7 integrins are important in the transendothelial migration of MCps into inflamed lung,20 we evaluated each population for the expression of the α4 integrin chain (CD49d) and for the expression of the αE (CD103) integrin chain, the alternate α chain that pairs with the β7 integrin chain. The comparison of the expression of α4 on the MCps on D1 with the eMMCs and the MMCs on D7 indicates that the number of α4 integrin+ cells decreases as the cells mature (Figure 3a and b). There is a decrease in the relative percentage of α4+ cells from 66% of MCps on D1 to 50% of eMMCs on D7 to 20% of MMCs on D7 (Figure 3b). Furthermore, whereas β1 expression does not change with maturation (Figure 3a and b), β7+ cells decline from 95% of MCps on D1 to 72% of eMMCs and to 61% of MMCs on D7 (Figure 3c and d). The αE integrin+ cells decrease modestly from 63% of MCps on D1 to 26% of eMMCs and 53% of MMCs on D7 (Figure 3c and d). Thus, as the induced MMCs mature from MCps, some lose their α4 integrin chain and a lesser number their β7 integrin subunit. When they reach their final stage of maturation, the MMCs expressing β7 integrins are predominantly αEβ7+.
Figure 3.
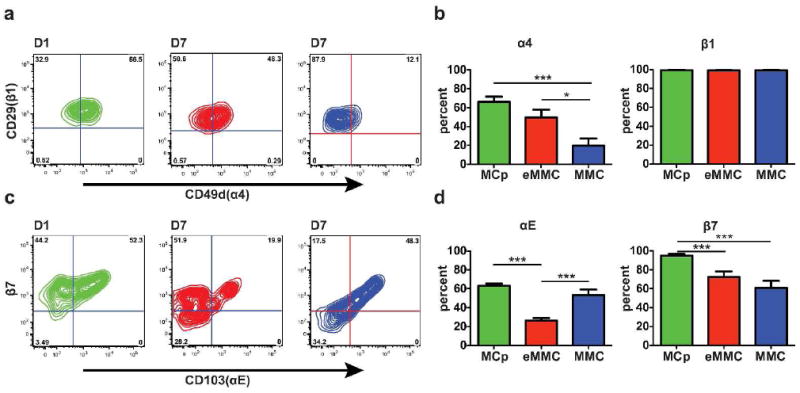
Expression of α4, αE, β7, and β1 integrins on the inducible MC populations in the lung. (a) Representative contour plots presenting the expression of α4 and β1 integrins on MCp (green) on D1, eMMC (red) on D7 and MMC (blue) on D7. (b) Mean ± SEM percentage of cells positive for α4 and β1 integrins in each of the 3 MC populations colored as in a.(c) Representative contour plots presenting the expression of αE and β7 on the MCp, eMMC and MMC as in a. (d) Mean ± SEM percentage of cells positive for αE and β7 integrins in each of the three MC populations colored as in a. Data in b and d are from 4 experiments with 8-12 mice per group. *p < 0.05, ***p < 0.001.
To distinguish the contribution of α4 and αE integrins to the recruitment of MCp, we used mAbs directed to the α-chain components of the heterodimers, α4 and αE. We found a significant 79% reduction in the concentration of MCp/106 CD45+ leukocytes and a 27% reduction in the concentration of eMMC/106 CD45+ leukocytes (p=0.07) in mice treated with α4 antibody compared to isotype treated mice (n=3 mice/group in a single experiment). Mice given αE antibody showed no reduction in MCp recruitment.
Comparison of constitutive and induced populations of MCs in the trachea with allergic inflammation
Our prior histologic analyses had revealed that in the trachea, submucosal CMCs were abundant and comparable in numbers in sensitized, NC and Ag-challenged mice while MMCs were absent in sensitized NC mice and only appeared in trachea with Ag-challenge.28 We used this knowledge to compare these subclasses of MCs in the same airway for their expression of FcεRI, Kit and β7 integrin and for their SSC profile. Mature CMCs in mouse lung are limited to the large bronchi and subpleural space28, 29 and thus are rare in the lung cell preparations.
In our FACS analysis of trachea, the population of MCps that increases in the lung on D1 is not recognized (Figure 4a). Instead, a population of FcεRIintKitint MCs that is poorly demarcated in the trachea of NC mice is increased on D1 but not D7, and is similar to the transient population of eMMCs in the lung (Figure 4a and b, red dots and bars). Further, a FcεRIintKitlo population of MMCs is also distinct on D1 in the trachea and peaks in numbers on D7 with little change to D14 (Figure 4a and b, blue dots and bars). The kinetics of induction of the mature MMC phenotype in trachea appears to be much accelerated compared to lung. The trachea also contains FcεRIhiKithi MCs that are present before challenge and do not increase in number with the inflammatory response to challenge (Figure 4, orange dots and bars), indicating the constitutive MC phenotype. At D7-14, the MMC are >10 fold greater per 105CD45+ leukocytes than the CMC.
Figure 4.
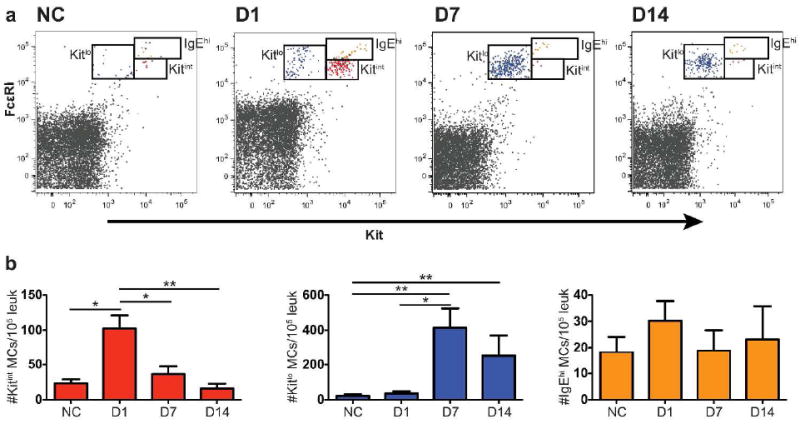
Induction of 2 populations of MCs in trachea of BALB/c mice 1 to 14 days after challenges. (a) Representative dot plots of tracheal MCs showing the resident CMC population, the FcεRIhiKithi cells (colored orange) and the induced eMMC (red) and MMC (blue) populations in NC mice and in mice D1, D7 and D14 after challenges from 1 of 3 experiments. (b) Mean ± SEM concentration (MCs/105 CD45+ leukocytes) of CMCs, eMMCs, and MMCs colored as in a. Data are means ± SEMs from 5 experiments with 6-15 mice per group. *p < 0.05, **p < 0.01.
The eMMCs transiently present on D1 in the trachea have the highest β7 integrin expression of MCs in the trachea (Figure 5a, red line and bar). The mature MMCs have less β7 integrin expression (Figure 5a, blue line and bar) than eMMCs while their β1 expression is similar (Figure 5b). The granularity by SSC is greater in MMCs than the eMMCs, which is greater than splenic MCps (Figure 5c, blue line, red line, and grey shaded area, respectively). Nonetheless, the SSC of MMCs is still lower than that of the tracheal FcεRIhiKithi CMCs, which is modest compared to peritoneal MCs (Figure 5c, orange line and black dotted line, respectively). The FSC of CMCs is lower than that of the inducible trachea eMMC and MMC populations, with the eMMCs being comparable to peritoneal MCs (Figure 5d).
Figure 5.
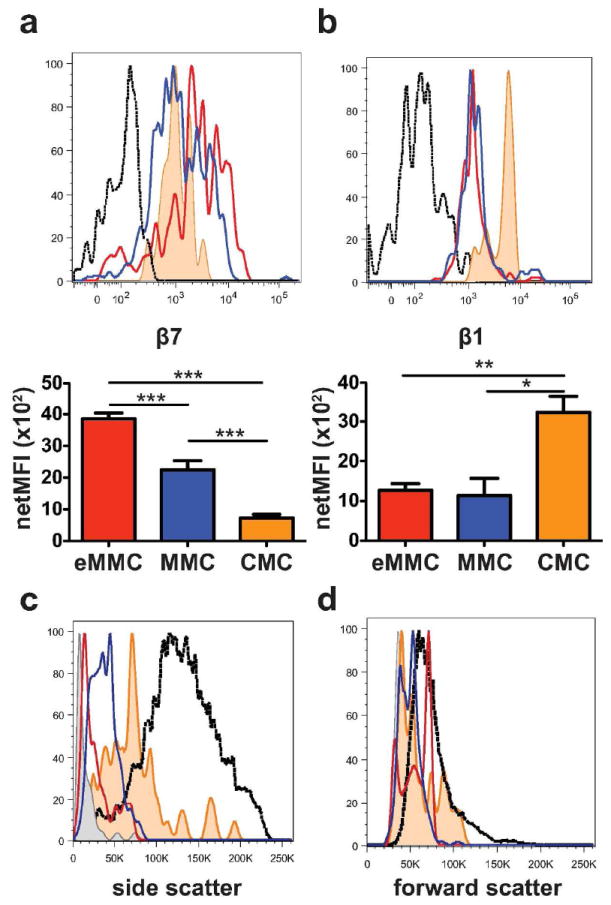
Expression of β7 and β1 integrins and forward and side scatter characteristics of tracheal constitutive and inducible MC populations at D7 after challenges. (a) Representative histograms (top panel) and mean (± SEM) net MFI (bottom panel) of the β7 integrin expression on the 3 populations of tracheal MCs, CMCs (orange shaded), eMMCs (red) and MMCs (blue); black dotted line -isotype control. (b) Representative histograms (top panel) and mean (± SEM) net MFI (bottom panel) of the β1 (CD29) integrin expression on the 3 populations of tracheal MCs colored as in a. (c) Representative histograms of the side scatter characteristics of the 3 MC populations in trachea (colored as in a and compared with splenic MCp (grey shaded) and intraperitoneal MCs (back dotted line). (d) Forward scatter characteristics of tracheal, splenic and intraperitoneal MC populations as in c. Histograms in c and d show the mean value from 2-3 mice/group from one of 5 experiments. Bar graphs represent mean (± SEM) from 4 experiments with 5-8 mice per group *p < 0.05, **p < 0.01, ***p < 0.001.
Assessment of the different α chain partners of the β7 integrin shows that the eMMCs are 59% positive for α4 on D1 and that this decreases to 4% on the MMCs on D7 (Figure 6a and b). In contrast, the expression of αE is retained at 59% of eMMCs and 66% of MMCs (Figure 6c and d). There is no change in expression of β1 integrin while the β7 integrin expression is decreased from 92% of eMMCs to 68% of MMCs. The majority of MMCs on D7 are positive for both αE and β7 integrin chains. Most of the CMCs in the trachea express β1 integrin and about one half are positive for β7 while only about one third express α4 and very few are positive for the αE integrin chains (data not shown).
Figure 6.
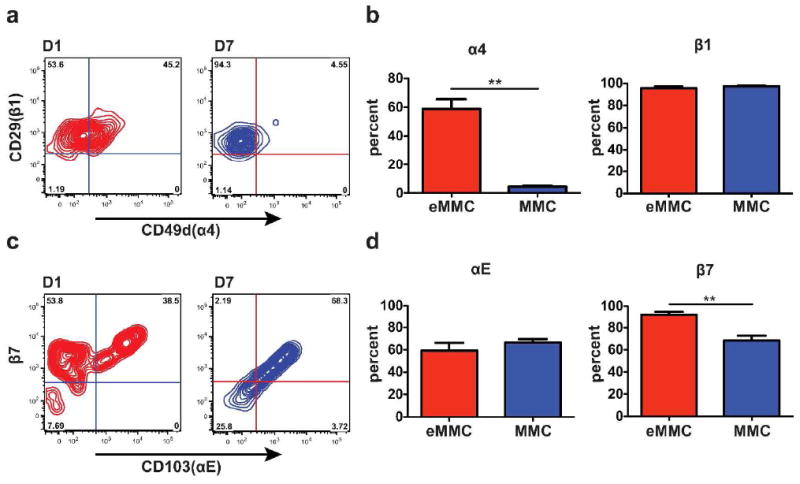
Expression of α4, αE, β7, and β1 integrins on the constitutive and inducible MC populations in the trachea. (a) Representative contour plots presenting the expression of α4 and β1 integrins on eMMCs (red) on D1, and MMCs (blue) on D7 after challenges. (b) Mean (±SEM) percentage of cells positive for α4 and β1 integrins in the 2 MC populations, D1 eMMCs, and D7 MMCs as in a.(c) Representative contour plots presenting the expression of αE and β7 integrins colored as in a. (d) Mean (± SEM) percentage of cells positive for αE and β7 integrins in the 2 MC populations colored as in a. Data are from 4 experiments with 4-8 mice per group. **p < 0.001.
Persistence of airway MMC numbers
Because our analyses by FACS and prior studies of lung and trachea by histology28 had shown induction of MMCs by D1 but had not addressed their duration, we evaluated the time course for induction and resolution of challenge-induced MMCs in lung and trachea by histology. Intraepithelial MMCs in the trachea are significantly increased on D1 and their numbers increase further to a plateau from D7-21 consistent with the analysis by FACS (Figure 7a). Although, there is a gradual decrease in MMC numbers thereafter, the numbers at D42 and D77 are still greater than for the NC controls. The number of tracheal CMCs does not change over the 77 days (Figure 7b), consistent with previous results for D1-7.28 Histological analysis also demonstrates a distinct phenotype for tracheal MMC characterized by larger granules and smaller sized cells relative to the tracheal CMC (Supplemental Figure 1). This phenotypic difference between the major classes of MCs has been described in the mouse small intestine.10
Figure 7.
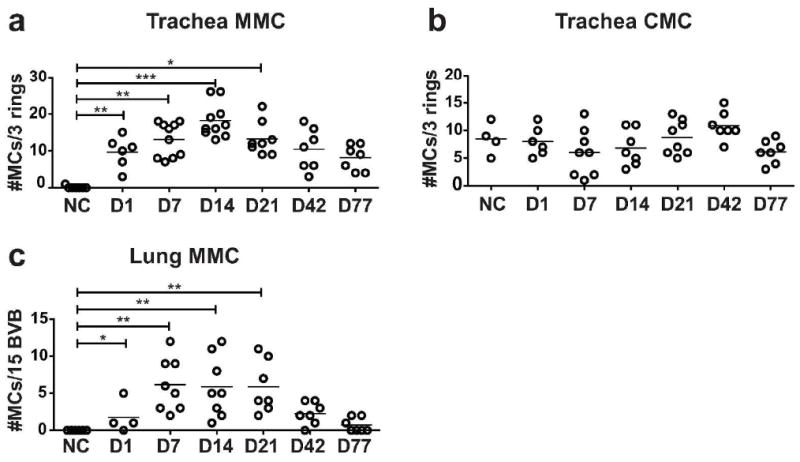
Persistence of histological MMC hyperplasia in the lung and trachea. Time course showing the changes in the numbers of MMCs and CMCs in trachea and MMCs in large airways of sensitized BALB/c mice challenged up to 77 days previously or unchallenged, as assessed by histology. (a) The number of interepithelial MMCs per 3 tracheal rings. (b) The number of submucosal CMCs per 3 tracheal rings. (c) The number of interepithelial MMCs per 15 bronchovascular bundles (BVB) assessed in the large bronchi (greater than 200 μm). Each dot is a separate mouse and the bar indicates mean value from 4 experiments. *p< 0.05, **p< 0.01, ***p< 0.001.
In the lung, a few MMCs are detectable in the large bronchi on D1 and their numbers are significantly increased to a plateau on D7-21 (Figure 7c). These bronchial MMCs decline in numbers by D42 and are almost back to baseline absence at D77. In lung, CMCs are only occasionally found in the subpleural space and in the connective tissue surrounding the right and left main stem bronchus.28, 29
Effect of systemic steroids on the recruitment to and persistence of MCs in the lung and trachea
The persistence of Ag-induced lung MCs prompted an investigation of the effect of treatment with systemic steroids on the recruitment of MCps and their transition to eMMCs and on the survival of established eMMCs and MMCs using two different protocols. To examine the effect of steroid treatment on MCp recruitment, sensitized mice received prednisone or HBSS intraperitoneally (i.p.) every other day during the aerosol challenge phase with analysis 1 day after the last challenge, D1. The numbers of MCp (FcεR1loKitint) per lung along with the inflammatory response defined by numbers of leukocytes harvested from lungs are significantly decreased in challenge-phase steroid treated mice (Figure 8). The numbers of developed eMMCs are also much reduced although significance is not reached (p=0.065). The concentration of MCp and eMMC (per 106 CD45+ cells) in the lung increases with challenge of sensitized mice and this response is not reduced by treatment with steroids (Figure 8b). Thus although their numbers per lung are diminished by steroid treatment (Figure 8c), neither the MCps nor the eMMCs are selectively depleted relative to other leukocytes. In the trachea, the eMMCs (FcεR1intKitint) appearing at D1 are not reduced in number or in concentration per CD45+ leukocytes by steroid treatment (data not shown).
Figure 8.
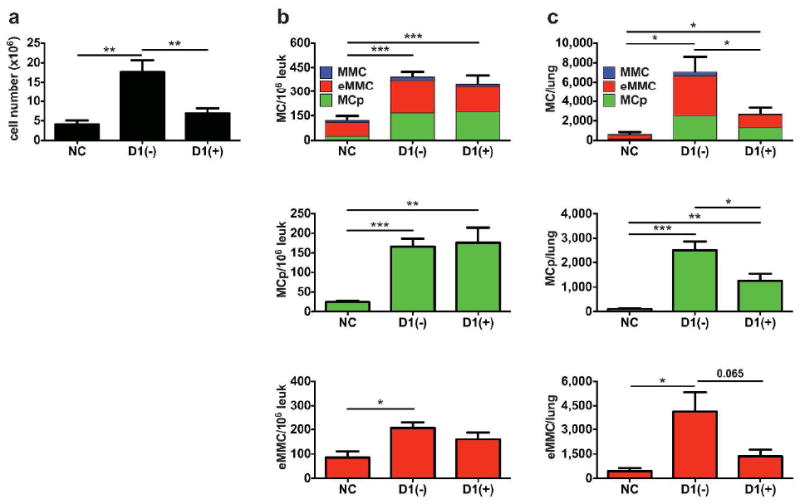
Effect of systemic steroids on the recruitment of MCps and appearance of eMMCs in the lung of BALB/c mice. Sensitized mice were given either HBSS (-) or prednisone (+) i.p. every other day during the challenge phase. The CD45+ lung cells were isolated and analyzed by FACS on D1 after the challenges. (a) Mean counts of leukocytes from the lung preparations. (b) Concentration of FcεR1+Kit+MCs/106 CD45+ cells in the lung determined by FACS. Top panel; stacked bars represent the concentration of all MCs and show the relative contribution of MCp (green), eMMC (red) and MMC (blue) to the total number. Middle and bottom panel are bar graphs of the distinct populations that are predominant on D1, MCp (green) and eMMC (red). (c) Total number of MCs per lung in the same mice as in (b). Bar graphs represent means ± SEMs from 3 experiments with 9-12 mice/group. * p < 0.05, ** p < 0.01
To examine the effect of steroid treatment on established eMMCs and MMCs, sensitized and challenged mice were treated with prednisone beginning 1 day after the last challenge, D1, and every other day until analysis on D7. By D7 the inflammatory infiltrate is essentially dissipated and the additional reduction in the lung leukocytes with steroid administration is not significant (Figure 9a). Neither the numbers per lung nor the concentration (per 106 CD45+ cells) of eMMCs alone, or plus MMCs, are reduced by steroid treatment as compared to the HBSS treated mice (Figure 9b and c). Similarly, in the trachea the post challenge administration of corticosteroids has no effect on the numbers or concentration of eMMCs and MMCs (data not shown)
Figure 9.
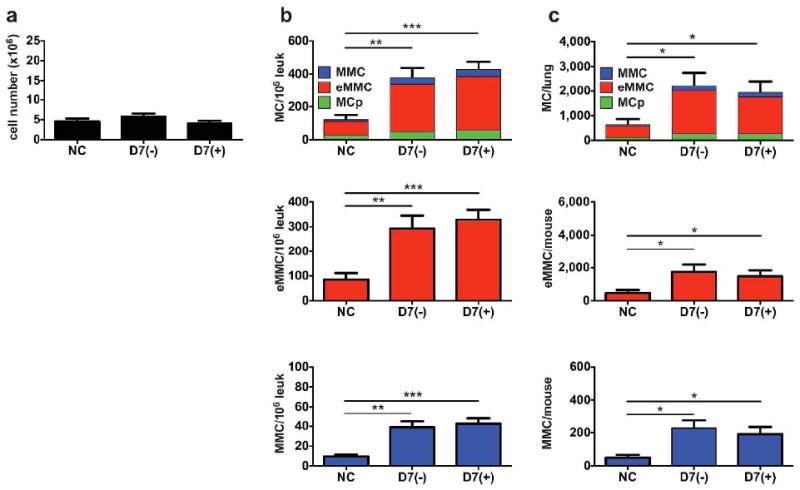
Effect of systemic steroids on the post challenge presence of induced MCs in the lung of BALB/c mice. Sensitized and challenged mice were given 4 doses of HBSS (-) or prednisone (+) i.p. every other day for 7 days after the challenge phase starting on D1 post challenge. The lung cells were isolated and analyzed by FACS on D7 after the challenges. (a) Mean cell counts of leukocytes from the lung preparations. (b) Concentration of FcεR1+Kit+MCs/106 CD45+ cells in the lung determined by FACS. Top panel; stacked bars represent the concentration of all MCs and show the relative contribution of the MCp (green), eMMC (red) and MMC (blue) to the total number. Middle and bottom panels are bar graphs of the distinct populations that are predominant on D7 – eMMC (red) and MMC (blue). (c) Total number of MCs per lung in the same mice as in (b). Bar graphs represent means ± SEMs from 3 experiments with 9 mice/group. * p < 0.05.
DISCUSSION
In this study, we have followed the recruitment and maturation of lineage MCs in the lung and trachea by FACS analysis during Ag-induced pulmonary inflammation in BALB/c mice. We utilized four distinct markers to visualize the recruitment of the MCps and then their maturation through an intermediate stage, eMMCs, to the fully mature MMCs. In trachea, we also differentiated the induced MMCs from the resident CMCs. We had previously required separate cohorts of mice to monitor recruitment of MCps to tissue by limiting dilution and clonal expansion20, 30 and, in parallel, documented the appearance of mature interepithelial MMCs in the presence of CMCs in large airways by histologic criteria in large airways.28, 31 We had indirect evidence of recruitment as opposed to expansion of the endogenous tissue MCp because their appearance after Ag challenge was blocked by administration of mAb to α4β1 and α4β7 integrins or to the endothelial counter-ligand, Vascular Cellular Adhesion Molecule-1.20 These ex vivo enumerated MCps peaked in number 1 day after 7 challenges and fell off substantially by D4 post-challenges, while the induced MMCs, assessed by histology, began appearing in the lung and trachea on D1 and were increased at D4.28 We have now visualized this process in real time by FACS analysis of dissociated lung and tracheal cells from unchallenged and challenged, sensitized mice from D1 to D14 after 7 challenges and extended our observations by histology out to D77.
We observe a population of FcεRIloKitintβ7hiSSClo MCps in sensitized BALB/c mice that peaks in number at D1 and then returns to baseline by D7 after Ag-challenge. Based on expression of FcεRI and Kit and their low SSC, these recruited MCps resemble the MCps we previously observed in the spleen of naive mice and in BM, spleen, and lymph nodes of T. spiralis-infected mice.17 At D1, there is also a population of early induced FcεRIintKitint β7int cells, eMMCs, with slightly increased SSC that peaks in number at D7 and then decreases at D14. Finally, another distinct population of FcεRIintKitloβ7int cells, mature MMCs, appears on D7 with a further increase in SSC. These MMCs peak in number in lung on D14 with persistence to D21 (data not shown). Earlier studies have shown that an increase in FcεRI expression is associated with appearance of granules in immature BM-derived MCs (BMMCs).32, 33 Our findings for the relative shifts in the number of lineage MCs with a particular membrane phenotype and increasing granularity based on SSC implies a developmental pattern from MCp to eMMC to MMC during allergic lung inflammation. This interpretation is supported by the accompanying shift from α4 to αE integrins in association with the β7 integrin.
The FACS analysis of the trachea was uniquely informative since this tissue has a sufficient and accessible population of CMCs that allowed comparison of induced MMCs to resident CMCs. Surprisingly, unlike lung, a discrete FcεRIloKitintβ7hi population of MCps is not apparent in trachea in unchallenged mice or even at D1 with challenge. However, like lung, a population of early induced FcεRIintKitintβ7int eMMCs is apparent at D1, but is transient and does not persist to D7. Instead only the FcεRIintKitloβ7int MMCs are prominent at D7 and then persist to D14. The concentration of MMCs is tenfold higher in the tracheal cell population than lung. Possible explanations for an apparently faster maturation of MMCs in the trachea as compared to lung include a higher relative number of fibroblasts, which promote MC maturation in a synovitis model 34 and which mediate maturation of BMMCs in co-cultures.35, 36 Alternatively, a relatively higher concentration of E-cadherin in the trachea may maximize an interepithelial distribution of MCp for development of eMMC. The resident FcεRIhiKithiβ7lo CMCs exhibit the highest SSC and their number does not change with inflammation, consistent with our previous observations by histologic assessment of trachea.28 In keeping with their higher SSC, these tracheal CMCs possess more granules per cell than MMCs by histology, a finding also noted for the intestinal CMCs versus MMCs by histology and by EM.10 Differences in granule number and EM structure also hold for human MMCs as compared to connective tissue MCs by EM.37, 38
Our previous studies demonstrated that α4β7 and α4β1 integrins are critical for recruitment of MCps to the lung.20 CD103 (αE integrin) is an alternative partner for β7, is important for the retention of lymphocytes in the epithelium through interaction with E-cadherin and is classically induced by TGFβ.39-41 The majority of recruited MCps in the lung and induced eMMCs in the trachea are positive for both β1 and β7 integrins. As they mature, the inducible MCs in the lung and in the trachea down regulate their surface β7 integrin expression and lose their α4 integrin expression. With full maturity as MMCs, the majority of the β7 integrin subunits are paired with αE. There are several findings in the literature compatible with such a change during Th2-mediated inflammation. Cultured BMMCs stimulated with TGFβ maintain relatively stable expression of the β1 and β7 integrin subunits but lose their α4 transcript,42 and when subjected to FcεRI activation, up regulate the αE integrin subunit.41, 43 Furthermore, intraepithelial MCs induced in the intestine with T. spiralis infection are positive for αE by immunofluorescence.44 TGFβ also induces a reduction in Kit expression by human skin MC,41, 45 and increased local TGFβ production occurs with allergic pulmonary inflammation in mouse models.46 Thus, we speculate that in response to TGFβ, induced airways MMCs down regulate α4 and express predominantly the αE integrin so as to bind epithelial E-cadherin, and concomitantly down regulate Kit, limiting their induced hyperplasia.
The distinct or overlapping functions of CMCs and induced MMCs are not well understood. MC-directed models of anaphylaxis or of acute bacterial resistance in naïve mice reflect the functions of the resident CMCs as the MMCs are rare in naïve intestine and almost undetectable in lung.28, 29 In contrast, models of allergic lung inflammation superimpose an induced MMC population on resident CMCs, and yet there is little information on the persistence of this MMC population. By FACS, we found robust persistence of MMCs in lung and in trachea to D21 even though total cell numbers, reflecting the inflammation-induced cellular infiltrate, fell off in the first week post-challenge. By histology, MMCs accumulate in the large bronchi of the lung with a peak value that was maintained from D7-D21, declined to half that level by D42 and returned to near baseline levels by D77. In the trachea, the level peaked at D14 and then declined slowly with some persistence even at D77 post-challenge. These differences in survival suggest a role for unidentified tissue factors. Despite the appreciable but transient increase in airway MMCs with allergic lung inflammation, there is no change in numbers of CMCs. Thus, the remodeling of airways associated with MC hyperplasia during chronic allergen challenge likely includes pathobiology due to the sustained presence of induced MMCs.47, 48
In humans, MCs were classically subdivided into mucosal MCT containing tryptase, and constitutive MCTC, containing both tryptase and chymase and found predominantly in the skin and small intestinal submucosa.49 Allergic asthmatic inflammation is associated with increases in epithelial, submucosal and smooth muscle MCs of both MCT and MCTC phenotypes.23, 24 The MCT are sensitive to inhaled steroid treatment while the MCTC are resistant to reduction by inhaled or systemic steroid treatment in patients with moderate and severe asthma.23, 50 Here, we found that steroid treatment during the challenge or induction phase suppresses the inflammation-dependent recruitment of MCps and appearance of less granulated MMCs whereas steroid treatment has no effect when delayed until the MMCs are established.
The two classical MC subclasses show distinct developmental patterns in the mouse. The development of the long-lived CMCs is controlled by innate mechanisms following the late embryonic seeding of the fetus from fetal liver-derived progenitors.9, 16 We now show that in the airways, transient MMCs, induced by adaptive immunity, are derived from MCps in the stable presence of CMCs as seen for trachea. Further, although the numbers of recruited MCps and the associated inflammatory response of CD45+ lung leukocytes can be suppressed by steroid treatment during Ag-challenge, steroid treatment delayed until MMCs are induced has no effect on their numbers. From an evolutionary viewpoint, the existence of two separate mature populations, innate and adaptive, with different distributions within tissues and phenotypic differences but a common lineage implies a functional importance for each that is likely beyond what has been recognized.
METHODS
Mice
Seven-to 18-wk-old BALB/c mice were obtained from Taconic Farms. The use of mice for these studies was in accordance with institutional guidelines with review and approval by the Animal Care and Use Committee of the Dana Farber Cancer Institute.
Reagents
Fluorescently labeled mAbs (monoclonal antibodies) directed against FcεRIα (MAR-1), Kit (2B8), CD3 (145-2C11), CD19 (6D5), CD4 (GK1.5), CD11b (M1/70), CD45 (30F-11), CD49d (R1-2), β1 (HMβ1-1) were obtained from BioLegend (San Diego, CA). Fluorescently labeled anti–β7 integrin (M293) and anti-αE integrin mAb (M290), as well as blocking anti-αE integrin mAb (M290) were obtained from BD Biosciences (San Diego, CA). Anti-IgE mAb (23G3) was obtained from eBioscience (San Diego, CA). The anti-α4 integrin blocking antibody (PS/2) was obtained from EMD Millipore (Temecula, CA). All mAbs containing sodium azide were dialyzed against HBSS to eliminate the azide. USP reference standard Prednisone was obtained from Sigma (Sigma-Aldrich, St Louis, MO), reconstituted in DMSO and diluted 1:2000 with sterile HBSS.
Ovalbumin sensitization and ovalbumin aerosol challenge protocol
Individual groups of 2-3 mice were sensitized and challenged (Supplemental Figure 2) as previously described.28, 31 After 7 daily challenges (days 1-7), mice were euthanized on day 8 (designated D1 post-challenge), day 15 (D7), day 22 (D14), day 28 (D21), day 50 (D42) and day 85 (D77) for analysis by FACS and histology.
Steroid administration protocol
For the acute disease protocol, we administered prednisone (10mg/kg) or HBSS i.p. just before the ovalbumin challenges of sensitized mice starting with the first challenge and then every other day for 7 days, D1. For the delayed administration protocol, sensitized mice were challenged with ovalbumin and prednisone administration was initiated approximately 24 hours after the last challenge (D1) and then administered at the same dose every other day until the mice were sacrificed on D7 post challenge.
Antibody blocking protocol
To evaluate the role α4 and αE integrins in pulmonary recruitment of MCs, 100 μg of isotype control or blocking mAb, in 100 μL of HBSS, was administered i.p. to sensitized mice. Injections were given daily starting on the first day of aerosolized ovalbumin challenges and mice were sacrificed for FACS analysis 1 day after the last challenge, D1.
Identification of MCs by FACS and histology
Lungs were perfused with 10 ml of cold HBSS through the right ventricle,28 removed intact, physically dissociated with a gentleMACS Dissociator (Miltenyi Biotec, San Diego, CA) in 10 ml of RPMI containing 5% fetal calf serum (FCS) and then enzymatically dissociated. Tracheas were finely chopped with scalpels, physically dissociated using the gentleMACS in 10 ml RPMI with 5% FCS and then enzymatically dissociated. For the enzymatic dissociation, lung and trachea fragments were incubated with 500 U/ml collagenase (CLS-IV, Worthington Biochemical) and 0.02 mg/ml DNAse I (Sigma-Aldrich) in RPMI with 5% FCS at 37°C for 60 minutes with agitation at 200 rpm. Single cells were harvested by adding another10 ml of complete RPMI (10% fetal calf serum, L-glutamine, penicillin, streptomycin, gentamicin, HEPES buffer, sodium pyruvate, and 2-mercaptoethanol (Sigma-Aldrich) and then collected by centrifugation. Lung single-cell suspensions were spun through 44% Percoll (Sigma Aldrich) at 400xg for 20 min and the supernatant containing epithelial cells was discarded. Erythrocytes were hypotonically lysed (30 sec in 0.1 mM EDTA, 2.0 g/L potassium bicarbonate, 16.6 g/L ammonium chloride). Viable cell yields were determined using trypan blue on a hemocytometer. Trachea and lung cell suspensions were washed with HBSS, and prepared for analysis by flow cytometry. Single-cell suspensions from the spleen and peritoneal cavity were obtained as previously described.17 Dead cells were excluded using the Zombie Aqua fixable viability kit (BioLegend). Non-specific mAb uptake was blocked with CD16/32 (2.4G2) (BD Biosciences) for 10 min, and the appropriate mAbs were added for 30 min. Flow cytometry was performed as previously described.17 B-, T-cells and macrophages were excluded using mAb against CD19, CD3, CD4, and CD11b after identification of CD45+ cells.
Histological assessment of MCs in the tissues using chloroacetate esterase reactivity was performed as previously described.10, 28
Statistics
Data are expressed as the mean ± SEM when derived from three or more values. For statistical analysis of differences between the groups, results were compared using a one-way ANOVA followed by Student’s t test if the ANOVA p value was <0.05. Significance was determined with the Mann-Whitney U test when the values did not follow a normal distribution. P values less than 0.05 were considered statistically significant and the following designations used: *p < 0.05, **p < 0.01, ***p < 0.001. Statistical analysis was performed with Prism software (GraphPad Software, Inc., San Diego, CA).
Supplementary Material
Acknowledgments
We wish to thank Dr. Juying Lai for the excellent technical assistance in performing all of the histochemical staining. This work was supported by grants from the National Institutes of Health: P50- GM52585, R01-AI083516, and T32-AI007306, and by the Joycelyn C. Austen Fund for Career Development of Women Physician Scientists.
Footnotes
Disclosure
The authors declare no competing financial interests
References
- 1.Mota I, Vugman I. Effects of anaphylactic shock and compound 48/80 on the mast cells of the guinea pig lung. Nature. 1956;177:427–429. doi: 10.1038/177427a0. [DOI] [PubMed] [Google Scholar]
- 2.Paterson NA, Wasserman SI, Said JW, Austen KF. Release of chemical mediators from partially purified human lung mast cells. J Immunol. 1976;117:1356–1362. [PubMed] [Google Scholar]
- 3.Razin E, Mencia-Huerta JM, Lewis RA, Corey EJ, Austen KF. Generation of leukotriene C4 from a subclass of mast cells differentiated in vitro from mouse bone marrow. Proc Natl Acad Sci U S A. 1982;79:4665–4667. doi: 10.1073/pnas.79.15.4665. [DOI] [PMC free article] [PubMed] [Google Scholar]
- 4.Enerback L. Mast cells in rat gastrointestinal mucosa. 2. Dye-binding and metachromatic properties. Acta Pathol Microbiol Scand. 1966;66:303–312. doi: 10.1111/apm.1966.66.3.303. [DOI] [PubMed] [Google Scholar]
- 5.Fukuzumi T, et al. Differences in irradiation susceptibility and turnover between mucosal and connective tissue-type mast cells of mice. Exp Hematol. 1990;18:843–847. [PubMed] [Google Scholar]
- 6.Mayrhofer G, Bazin H. Nature of the thymus dependency of mucosal mast cells. III. Mucosal mast cells in nude mice and nude rats, in B rats and in a child with the Di George syndrome. Int Arch Allergy Appl Immunol. 1981;64:320–331. doi: 10.1159/000232710. [DOI] [PubMed] [Google Scholar]
- 7.Irani AM, et al. Deficiency of the tryptase-positive, chymase-negative mast cell type in gastrointestinal mucosa of patients with defective T lymphocyte function. J Immunol. 1987;138:4381–4386. [PubMed] [Google Scholar]
- 8.Ruitenberg EJ, Elgersma A. Absence of intestinal mast cell response in congenitally athymic mice during Trichinella spiralis infection. Nature. 1976;264:258–260. doi: 10.1038/264258a0. [DOI] [PubMed] [Google Scholar]
- 9.Sonoda T, Hayashi C, Kitamura Y. Presence of mast cell precursors in the yolk sac of mice. Dev Biol. 1983;97:89–94. doi: 10.1016/0012-1606(83)90066-0. [DOI] [PubMed] [Google Scholar]
- 10.Friend DS, et al. Mast cells that reside at different locations in the jejunum of mice infected with Trichinella spiralis exhibit sequential changes in their granule ultrastructure and chymase phenotype. J Cell Biol. 1996;135:279–290. doi: 10.1083/jcb.135.1.279. [DOI] [PMC free article] [PubMed] [Google Scholar]
- 11.Sonoda T, Ohno T, Kitamura Y. Concentration of mast-cell progenitors in bone marrow, spleen, and blood of mice determined by limiting dilution analysis. J Cell Physiol. 1982;112:136–140. doi: 10.1002/jcp.1041120120. [DOI] [PubMed] [Google Scholar]
- 12.Parmentier HK, Teppema JS, van Loveren H, Tas J, Ruitenberg EJ. Effect of a Trichinella spiralis infection on the distribution of mast cell precursors in tissues of thymus-bearing and non-thymus-bearing (nude) mice determined by an in vitro assay. Immunology. 1987;60:565–571. [PMC free article] [PubMed] [Google Scholar]
- 13.Pennock JL, Grencis RK. In vivo exit of c-kit+/CD49dhi/{beta}7+ mucosal mast cell precursors from the bone marrow following infection with the intestinal nematode Trichinella spiralis. Blood. 2003;103:2655–2660. doi: 10.1182/blood-2003-09-3146. [DOI] [PubMed] [Google Scholar]
- 14.Arinobu Y, et al. Developmental checkpoints of the basophil/mast cell lineages in adult murine hematopoiesis. Proc Natl Acad Sci U S A. 2005;102:18105–18110. doi: 10.1073/pnas.0509148102. [DOI] [PMC free article] [PubMed] [Google Scholar]
- 15.Chen CC, Grimbaldeston MA, Tsai M, Weissman IL, Galli SJ. Identification of mast cell progenitors in adult mice. Proc Natl Acad Sci U S A. 2005;102:11408–11413. doi: 10.1073/pnas.0504197102. [DOI] [PMC free article] [PubMed] [Google Scholar]
- 16.Rodewald HR, Dessing M, Dvorak AM, Galli SJ. Identification of a committed precursor for the mast cell lineage. Science. 1996;271:818–822. doi: 10.1126/science.271.5250.818. [DOI] [PubMed] [Google Scholar]
- 17.Liu AY, et al. Mast cells recruited to mesenteric lymph nodes during helminth infection remain hypogranular and produce IL-4 and IL-6. J Immunol. 2013;190:1758–1766. doi: 10.4049/jimmunol.1202567. [DOI] [PMC free article] [PubMed] [Google Scholar]
- 18.Tomioka H, Ishizaka K. Mechanisms of passive sensitization. II. Presence of receptors for IgE on monkey mast cells. J Immunol. 1971;107:971–978. [PubMed] [Google Scholar]
- 19.Iemura A, Tsai M, Ando A, Wershil BK, Galli SJ. The c-kit ligand, stem cell factor, promotes mast cell survival by suppressing apoptosis. Am J Pathol. 1994;144:321–328. [PMC free article] [PubMed] [Google Scholar]
- 20.Abonia JP, et al. Alpha-4 integrins and VCAM-1, but not MAdCAM-1, are essential for recruitment of mast cell progenitors to the inflamed lung. Blood. 2006;108:1588–1594. doi: 10.1182/blood-2005-12-012781. [DOI] [PMC free article] [PubMed] [Google Scholar]
- 21.Gurish MF, et al. Intestinal mast cell progenitors require CD49dbeta7 (alpha4beta7 integrin) for tissue-specific homing. J Exp Med. 2001;194:1243–1252. doi: 10.1084/jem.194.9.1243. [DOI] [PMC free article] [PubMed] [Google Scholar]
- 22.Ando A, Martin TR, Galli SJ. Effects of chronic treatment with the c-kit ligand, stem cell factor, on immunoglobulin E-dependent anaphylaxis in mice. Genetically mast cell-deficient Sl/Sld mice acquire anaphylactic responsiveness, but the congenic normal mice do not exhibit augmented responses. J Clin Invest. 1993;92:1639–1649. doi: 10.1172/JCI116749. [DOI] [PMC free article] [PubMed] [Google Scholar]
- 23.Balzar S, et al. Mast cell phenotype, location, and activation in severe asthma: data from the severe asthma research program. Am J Respir Crit Care Med. 2011;183:299–309. doi: 10.1164/rccm.201002-0295OC. [DOI] [PMC free article] [PubMed] [Google Scholar]
- 24.Brightling CE, et al. Mast-cell infiltration of airway smooth muscle in asthma. N Engl J Med. 2002;346:1699–1705. doi: 10.1056/NEJMoa012705. [DOI] [PubMed] [Google Scholar]
- 25.Munger JS, et al. The integrin alpha v beta 6 binds and activates latent TGF beta 1: a mechanism for regulating pulmonary inflammation and fibrosis. Cell. 1999;96:319–328. doi: 10.1016/s0092-8674(00)80545-0. [DOI] [PubMed] [Google Scholar]
- 26.Yu M, et al. Mast cells can promote the development of multiple features of chronic asthma in mice. J Clin Invest. 2006;116:1633–1641. doi: 10.1172/JCI25702. [DOI] [PMC free article] [PubMed] [Google Scholar]
- 27.Yu M, et al. Identification of an IFN-gamma/mast cell axis in a mouse model of chronic asthma. J Clin Invest. 121:3133–3143. doi: 10.1172/JCI43598. [DOI] [PMC free article] [PubMed] [Google Scholar]
- 28.Xing W, Austen KF, Gurish MF, Jones TG. Protease phenotype of constitutive connective tissue and of induced mucosal mast cells in mice is regulated by the tissue. Proc Natl Acad Sci U S A. 2011;108:14210–14215. doi: 10.1073/pnas.1111048108. [DOI] [PMC free article] [PubMed] [Google Scholar]
- 29.Miller HR, Pemberton AD. Tissue-specific expression of mast cell granule serine proteinases and their role in inflammation in the lung and gut. Immunology. 2002;105:375–390. doi: 10.1046/j.1365-2567.2002.01375.x. [DOI] [PMC free article] [PubMed] [Google Scholar]
- 30.Hallgren J, et al. Pulmonary CXCR2 regulates VCAM-1 and antigen-induced recruitment of mast cell progenitors. Proc Natl Acad Sci U S A. 2007;104:20478–20483. doi: 10.1073/pnas.0709651104. [DOI] [PMC free article] [PubMed] [Google Scholar]
- 31.Jones TG, et al. Antigen-Induced Increases in Pulmonary Mast Cell Progenitor Numbers Depend on IL-9 and CD1d-Restricted NKT Cells. J Immunol. 2009;183:5251–5260. doi: 10.4049/jimmunol.0901471. [DOI] [PMC free article] [PubMed] [Google Scholar]
- 32.Lantz CS, Huff TF. Murine KIT+ lineage-bone marrow progenitors express Fc gamma-RII but do not express Fc epsilon-RI until mast cell granule formation. J Immunol. 1995;154:355–362. [PubMed] [Google Scholar]
- 33.Jamur MC, et al. Identification and characterization of undifferentiated mast cells in mouse bone marrow. Blood. 2005;105:4282–4289. doi: 10.1182/blood-2004-02-0756. [DOI] [PubMed] [Google Scholar]
- 34.Kaieda S, et al. Synovial fibroblasts promote the expression and granule accumulation of tryptase via interleukin-33 and its receptor ST-2 (IL1RL1) J Biol Chem. 2010;285:21478–21486. doi: 10.1074/jbc.M110.114991. [DOI] [PMC free article] [PubMed] [Google Scholar]
- 35.Levi-Schaffer F, Austen KF, Gravallese PM, Stevens RL. Coculture of interleukin 3-dependent mouse mast cells with fibroblasts results in a phenotypic change of the mast cells. Proc Natl Acad Sci U S A. 1986;83:6485–6488. doi: 10.1073/pnas.83.17.6485. [DOI] [PMC free article] [PubMed] [Google Scholar]
- 36.Levi-Schaffer F, et al. Mouse bone marrow-derived mast cells cocultured with fibroblasts. Morphology and stimulation-induced release of histamine, leukotriene B4, leukotriene C4, and prostaglandin D2. J Immunol. 1987;139:3431–3441. [PubMed] [Google Scholar]
- 37.Craig SS, Schechter NM, Schwartz LB. Ultrastructural analysis of human T and TC mast cells identified by immunoelectron microscopy. Lab Invest. 1988;58:682–691. [PubMed] [Google Scholar]
- 38.Weidner N, Austen KF. Ultrastructural and immunohistochemical characterization of normal mast cells at multiple body sites. J Invest Dermatol. 1991;96:26S–30S. [PubMed] [Google Scholar]
- 39.Shaw LM, Turner CE, Mercurio AM. The alpha 6A beta 1 and alpha 6B beta 1 integrin variants signal differences in the tyrosine phosphorylation of paxillin and other proteins. J Biol Chem. 1995;270:23648–23652. doi: 10.1074/jbc.270.40.23648. [DOI] [PubMed] [Google Scholar]
- 40.Schon MP, et al. Mucosal T lymphocyte numbers are selectively reduced in integrin alpha E (CD103)-deficient mice. J Immunol. 1999;162:6641–6449. [PubMed] [Google Scholar]
- 41.Wright SH, et al. Transforming growth factor-beta1 mediates coexpression of the integrin subunit alphaE and the chymase mouse mast cell protease-1 during the early differentiation of bone marrow-derived mucosal mast cell homologues. Clin Exp Allergy. 2002;32:315–324. doi: 10.1046/j.1365-2222.2002.01233.x. [DOI] [PubMed] [Google Scholar]
- 42.Ducharme LA, Weis JH. Modulation of integrin expression during mast cell differentiation. Eur J Immunol. 1992;22:2603–2607. doi: 10.1002/eji.1830221020. [DOI] [PubMed] [Google Scholar]
- 43.Smith TJ, et al. Murine M290 integrin expression modulated by mast cell activation. Immunity. 1994;1:393–403. doi: 10.1016/1074-7613(94)90070-1. [DOI] [PubMed] [Google Scholar]
- 44.Brown JK, et al. Expression of integrin-alphaE by mucosal mast cells in the intestinal epithelium and its absence in nematode-infected mice lacking the transforming growth factor-beta1-activating integrin alphavbeta6. Am J Pathol. 2004;165:95–106. doi: 10.1016/s0002-9440(10)63278-6. [DOI] [PMC free article] [PubMed] [Google Scholar]
- 45.Zhao W, Gomez G, Yu SH, Ryan JJ, Schwartz LB. TGF-beta1 attenuates mediator release and de novo Kit expression by human skin mast cells through a Smad-dependent pathway. J Immunol. 2008;181:7263–7272. doi: 10.4049/jimmunol.181.10.7263. [DOI] [PMC free article] [PubMed] [Google Scholar]
- 46.Sugimoto K, et al. The alphavbeta6 integrin modulates airway hyperresponsiveness in mice by regulating intraepithelial mast cells. J Clin Invest. 2012;122:748–758. doi: 10.1172/JCI58815. [DOI] [PMC free article] [PubMed] [Google Scholar]
- 47.Bradding P, Walls AF, Holgate ST. The role of the mast cell in the pathophysiology of asthma. J Allergy Clin Immunol. 2006;117:1277–1284. doi: 10.1016/j.jaci.2006.02.039. [DOI] [PubMed] [Google Scholar]
- 48.Kearley J, et al. IL-9 governs allergen-induced mast cell numbers in the lung and chronic remodeling of the airways. Am J Respir Crit Care Med. 2011;183:865–875. doi: 10.1164/rccm.200909-1462OC. [DOI] [PMC free article] [PubMed] [Google Scholar]
- 49.Irani AA, Schechter NM, Craig SS, DeBlois G, Schwartz LB. Two types of human mast cells that have distinct neutral protease compositions. Proc Natl Acad Sci U S A. 1986;83:4464–4468. doi: 10.1073/pnas.83.12.4464. [DOI] [PMC free article] [PubMed] [Google Scholar]
- 50.Bentley AM, et al. Prednisolone treatment in asthma. Reduction in the numbers of eosinophils, T cells, tryptase-only positive mast cells, and modulation of IL-4, IL-5, and interferon-gamma cytokine gene expression within the bronchial mucosa. Am J Respir Crit Care Med. 1996;153:551–556. doi: 10.1164/ajrccm.153.2.8564096. [DOI] [PubMed] [Google Scholar]
Associated Data
This section collects any data citations, data availability statements, or supplementary materials included in this article.