

Abstract
Purpose
A chemical shift separation technique for hyperpolarized 13C metabolic imaging with high spatial and temporal resolution was developed. Specifically, a fast 3D pulse sequence and a reconstruction method were implemented to acquire signals from multiple 13C species simultaneously with subsequent separation into individual images.
Methods
A stack of flyback-EPI readouts and a set of multiband excitation RF pulses were designed to spatially modulate aliasing patterns of the acquired metabolite images, which translated the chemical shift separation problem into parallel imaging reconstruction problem. An eight-channel coil array was used for data acquisition and a parallel imaging method based on nonlinear inversion was developed to separate the aliased images.
Results
Simultaneous acquisitions of pyruvate and lactate in a phantom study and in vivo rat experiments were performed. The results demonstrated successful separation of the metabolite distributions into individual images having high spatial resolution.
Conclusion
This method demonstrated the ability to provide accelerated metabolite imaging in hyperpolarized 13C MR utilizing multi-channel coils, tailored readout, and specialized RF pulses.
Keywords: hyperpolarized 13C metabolic imaging, chemical shift separation, controlled aliasing, multiband RF pulse, flyback EPI trajectory, nonlinear inversion method
INTRODUCTION
Recent advances in hyperpolarized 13C MR techniques have enabled real time monitoring of in vivo metabolic activities (1, 2). In this method, dynamic nuclear polarization (DNP) of a 13C labeled substrate followed by rapid dissolution generates an injectable aqueous MR agent having dramatically improved sensitivity in the order of 10,000 fold (3). This offers unique opportunities to probe the injected 13C substrate and its downstream metabolic products in both preclinical and patient studies. The method has been successfully applied to many in vivo applications including diagnosis of cancer metabolism (4, 5, 6), cardiac function (7, 8) and brain diseases (9, 10). Successful translation of the technique into the first in-human study demonstrated the potential and safety for future clinical studies (11).
The unprecedented opportunities are, however, presented together with new technical challenges. One is that monitoring metabolic conversions of 13C substrates requires multiple frequency components to be resolved spectrally and spatially. Moreover, data acquisition must be done within a short period of time before hyperpolarized signal decays due to spin-lattice T1 relaxation and metabolic conversions. Current acquisition methods have been severely limited in their temporal resolution as well as spatial coverage by these time constraints. The low gyromagnetic ratio of 13C also poses additional constraints on image acquisition schemes given the practical hardware limits of MR imaging systems.
MR spectroscopic imaging (MRSI) methods (12) are most often used in generating images of the injected 13C compound and the various metabolic products. Conventionally, multiple free-induction-decays (FIDs) are repeatedly collected in combination with spatial encoding for separating different chemical shift species. To rapidly acquire the spectroscopic data, novel techniques such as echo planar spectroscopic imaging (EPSI) or spiral readouts have been developed (13, 14, 15). Further acceleration in measurement time has been achieved by either exploiting sparseness of 13C spectra (16) or combining compressed sensing (17, 18) with EPSI (19, 20). Parallel imaging (21) has also been applied to MRSI techniques for fast data acquisitions (22, 23). However, the spectroscopic imaging approaches typically face trade-offs between high spatial resolution and wide spectral coverage.
A different approach actively being investigated for hyperpolarized 13C MR is the direct imaging of each metabolite one at a time. Previous works have adopted spectral-spatial RF pulses to selectively excite a single resonance with resulting signal acquired using fast imaging readout trajectories (24). Images of multiple metabolites are then acquired by repeating the selective acquisition with the transceiver frequency offset in an interleaved manner (7). This technique is advantageous as it acquires data without time consuming spectral encoding. However, the individual metabolite images inevitably reflect different time points in the course of metabolic activity, and the total acquisition time increases linearly with the number of metabolites of interest. Another published method simultaneously excited two different metabolites and separated their images by exploiting the chemical shift displacement artifact, which results from adopting an echo planar imaging (EPI) readout that has low bandwidth in the slow (or blipped) direction (25). The drawback is the long readout time required to achieve enough phase accrual to ensure adequate separation of the two metabolites.
In this study, we developed a novel chemical shift separation technique for hyperpolarized 13C metabolic imaging. More specifically, we implemented a fast 3D pulse sequence together with an accompanying reconstruction method that can acquire signals from multiple 13C metabolites simultaneously and later separate them into individual images. Our approach is based on the concept of separating aliased information using a parallel imaging formulation, which has been widely applied to multi-slice imaging (26), 3D imaging (27) and water-fat separation (28, 29, 30, 41). Here, we applied the idea to rapid 3D acquisitions of 13C-pyruvate and 13C-lactate in phantom studies as well as in normal rat experiments, achieving high-resolution images of both the compounds in the same time it would take to acquire a single metabolite with previous methods.
THEORY
We first show that chemical shift separation problem can be formulated into parallel imaging reconstruction problem. We then describe our strategies for acquiring data. Finally, the techniques we adopted to separate out individual metabolite images are explained. We name the three spatial directions as fast, slow and phase encode (PE) for convenience.
Chemical Shift Separation using Parallel Imaging Reconstruction
Parallel imaging uses phased array coils for faster data acquisition in MR experiments. In principle, the parallel imaging reconstruction exploits spatial sensitivity variations within the receiver coils to separate out multiple image signals that have been aliased into a single pixel due to under-sampling in k-space. The SENSE framework, explained briefly in the following, provides an intuitive view of the problem. Assuming a two-fold accelerated scan with a two-coil receiver array, each measured pixel value from the individual coils (c1 and c2) will be a superposition of unknown aliasing pixel values that are spatially apart from one another (ρ1 and ρ2) weighted by spatial sensitivity profiles of each coil (Sij for the sensitivity information of ith coil at jth pixel). If described in a set of linear equations, this becomes:
| [1] |
For convenience, we also write Eq. [1] in a simpler form:
| [2] |
Given this relation, parallel imaging reconstructions resolve the aliased spin densities (ρ) given the measurement data from each coils (c). Here, the coils must be configured in such a way that the inverse of the sensitivity matrix (S) exists. Only then can the vector ρ be estimated by multiplying the inverse of S to both sides of Eq. [2].
| [3] |
Detailed solutions to more generalized settings, such as having more than two coils or achieving arbitrary acceleration factors, are documented in the SENSE reference (32). We now cast the problem of chemical shift separation into the parallel imaging reconstruction framework developed above. In the chemical shift separation, we acquire signals from multiple 13C metabolites simultaneously, and then attempt to unwrap the aliased metabolite images later in reconstruction stage. By extending the idea in Eq. [1], we formulated the case of simultaneous acquisition of two metabolites (e.g., pyruvate and lactate) using two receiver coils into the following while explicitly denoting the spatial dependencies.
| [4] |
Our objective is to estimate the images of pyruvate and lactate (ρpyr (x, y) and ρlac (x, y)) for all spatial positions given the measurements from each coils (c1 (x, y) and c2 (x, y)). Obviously, Eq. [4] cannot be solved readily because s1pyr = and s1lac = s1 and s2pyr = S2lac = s2 holds for all values of x and y, and hence, the inverse of the sensitivity matrix S does not exist. An illustration representing the case is shown in Figure 1a.
Figure 1.
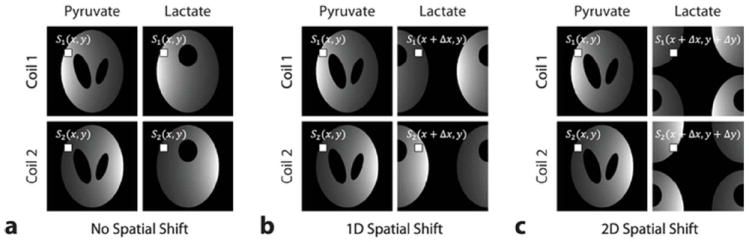
Aliasing of sensitivity profiles in the case of two metabolite images with two receiver coils. (a) No spatial shifting, (b) 1D, and (c) 2D shifting of lactate images with respect to pyruvate images. In this example, Δx = FOVx/2 and Δy = FOVy/2.
However, it is possible to modify the problem so that Eq. [4] is solvable for ρ. We can achieve this by intentionally shifting one of the metabolite images with respect to the other one, thereby making the matrix S invertible. Assuming that we shift the lactate image by Δx in the x-direction as shown in Figure 1b, the linear equations describing the problem now become:
| [5] |
In general, the matrix S will be invertible in this case provided that the coils have sufficient variations in their reception profiles along the x-direction with properly chosen Δx values (i.e., s1 (x, y) ≠, s1 (x + Δx, y), s2 (x, y) ≠, s2 (x + Δx, y),). Then, as discussed previously, the pyruvate and (shifted) lactate images can be estimated by using Eq. [3]. In other words, if spatially shifted metabolite images are acquired concurrently through multiple receivers, then parallel imaging reconstruction methods can be adopted to solve the chemical shift separation problem.
The geometry factor (g) can be employed to describe how easily the aliased metabolite images can be unfolded (33).
| [6] |
Here, H denotes the Hermitian conjugate and the subscript i refers to aliased metabolite-number at a specific pixel location. Mathematically, the geometry factor (or g-factor) is a measure of noise amplification that occurs in the unwrapping process, and its value depends heavily on sensitivity profile variations with greater difference generally resulting in less noise magnification. Given a typical coil configuration in which coils are placed to have varying sensitivities in two orthogonal directions, the g-factor can be minimized by shifting the lactate image in both the x and y directions as shown in Figure 1c. Then the corresponding linear equations are given by
| [7] |
Later in the Methods section, based on simulated sensitivity profiles for a given coil geometry, we calculated the g-factors for a set of spatial shift values and showed that 2D spatial shifting can result in lower g-factor values.
Controlled Aliasing in Chemical Shift Separation
As discussed, applying parallel imaging methodologies to a chemical shift separation problem requires metabolite images to be spatially shifted with respect to each other and acquired concurrently through an array of receivers. In this work, we accomplished the task of spatial shifting by employing a 3D pulse sequence capable of applying different degree of phase modulations to each metabolite signals through specialized data acquisitions. Two separate techniques were adopted for the purpose: flyback-EPI readout gradients, and multiband RF excitation pulses.
Flyback-EPI uses time varying gradients during the readout window to collect multiple k-space lines per repetition for reduced scan time. It is also robust to errors that arise from system imperfections and physical phenomena such as gradient delays and eddy currents (13). Together with its fast spatial encoding capability, the well-known chemical shift artifact resulting from the low effective bandwidth in the blipped direction of the EPI readout (kslow) can be exploited to control the aliasing patterns of 13C metabolite images (25). Under a flyback-EPI acquisition, spins having offset frequency Δf will experience phase accrual of θ = 2π · Δf · tesp at every echo given the echo spacing time tesp (Fig. 2a). Based on the Fourier shift theorem, this results in a shifting of image by an amount of Δy = Δf · tesp · FOV, where Δy is a cyclic shift in which periodical factor in multiples of FOV can be ignored. If pyruvate and lactate images are acquired simultaneously with the carrier frequency set on the pyruvate resonance, then the lactate image will be shifted relative to the pyruvate image (Fig. 2c), and the amount of shifting can be controlled by setting the echo spacing time (tesp) to an appropriate value.
Figure 2.
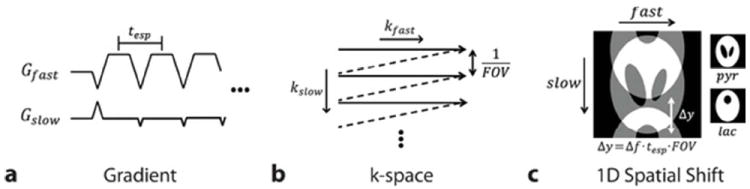
Chemical shift displacement in flyback-EPI readout trajectory. (a) Flyback-EPI gradient waveform with tesp echo spacing. (b) Corresponding traversal trace in k-space. (c) Resultant spatial shift in the slow direction. The degree of shifting (Δy) can be adjusted by setting appropriate tesp values for a given frequency difference (Δf). Note that Δy is a cyclic shift operation in multiples of FOV.
We also designed specialized phase-modulated multiband RF pulses (34) to provide spatial shifting in an additional direction. Given the 3D k-space trajectory with stacked flyback-EPI readouts (Fig. 3a), applying a set of multiband RF pulses with alternating phase modulations at each encoding step of EPI acquisition (Fig. 3b) provides the individual metabolite signals with different degrees of phase cycling. Consequently, the metabolite images will be shifted with respect to each other in the phase encoding (PE) direction after the Fourier transform. For example, applying 0 and π-phase cycling on the pyruvate and lactate resonances, respectively, will place both images half the FOV apart. Together with the previously discussed EPI chemical shift artifact in the blipped direction, the aliasing pattern of the lactate image can now be controlled in two separate directions (Fig. 3c). The entire acquisition strategy is summarized in the pulse sequence shown in Figure 3d.
Figure 3.
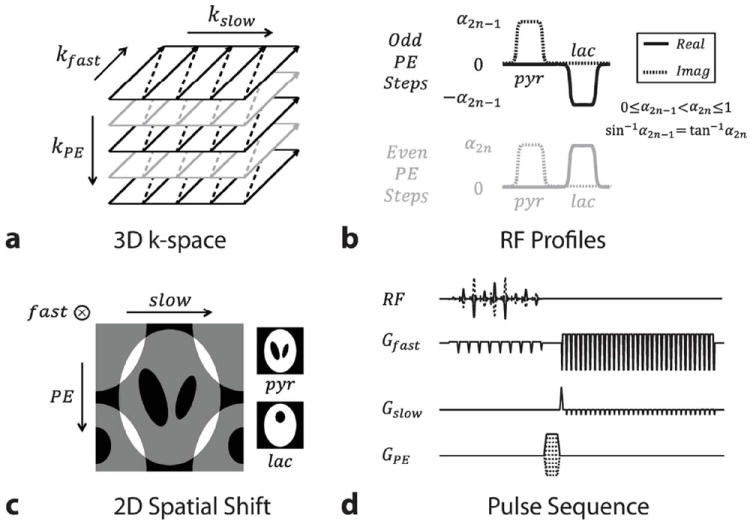
2D chemical shift displacement. (a) 3D stack-of-EPI trajectory. (b) Lactate signal is modulated in alternating fashion at each phase encoding step. A variable flip angle scheme was also implemented by sequentially increasing excitation profiles. (c) 2D spatial shifting of lactate images (⊗ mark represents the perpendicular into-plane direction). (d) Schematic of 3D pulse sequence developed.
Nonlinear Inversion Method for Chemical Shift Separation
Once multi-channel data is acquired, then virtually any parallel imaging method that essentially solves the problem stated in Eq. [2] can be adopted to separate the individual metabolite images. However, in the case of carbon imaging, estimating sensitivity profiles of carbon coils to structure the sensitivity matrix S is not a trivial task due to, for example, the low concentration of 13C in living tissues. Hence, in this study, we adopted the regularized nonlinear inversion method (31), which applies the iteratively regularized Gauss-Newton (IRGN) method to parallel imaging reconstruction estimating both image contents and coil sensitivities at the same time. In the following, the IRGN algorithm is briefly reviewed, and then, the method is applied to solve the chemical shift separation problem at hand.
Given a nonlinear operator F, the IRGN method attempts to find a solution to the problem Fx = y by linearizing the equation around an estimate xn yielding,
where J F (xn) is the Jacobian matrix of F at the point xn. Then, a suitable update value dx that satisfies the following relation is found.
To evade bad conditioning of the linearized problem, it is better to add a regularization term and find the update dx as the unique minimizer to the equation
| [8] |
The first quadratic term addresses the fidelity of the estimate to the acquired data, whereas the second term penalizes the result of the update if it deviates too far from the initial guess x0. The regularization parameter αn balances the two terms and is reduced in each Newton step by the rule αn = α0 qn with a constant value 0 < q < 1. Once the update is found, then the solution estimate is renewed to xn + 1 = xn + dx, and the process is repeated until the iteration number n reaches a preset value.
To apply the IRGN technique to solve the chemical shift separation problem, Eq. [7] is reposed into a k-space domain formulation with the nonlinear operator F defined to map the metabolite concentrations (ρpyr, ρlac) and the coil sensitivities (Si) to the measured data (y):
| [9] |
Here, F is the Fourier transform and Φlac accounts for the phase modulation applied on the lactate signal. To evaluate the quadratic optimization problem in Eq. [8], we further need the derivative of the operator F and its adjoint, which are given in the Appendix section.
Direct application of the IRGN method on Eq. [9] will, however, result in an unrealistic solution due to the fact that the problem is inherently underdetermined with the unknowns outnumbering the equations. Therefore, we incorporated two additional constraints based on a priori knowledge about the metabolite images and the coil sensitivities to reduce the degree of freedom: an object mask and smoothness constraint on coil sensitivities. Since 13C signals can only reside within an imaging subject, a binary mask representing the object support is added into the reconstruction to enforce the estimated metabolite images to have restricted extent in the image domain. Generally, the masks can be estimated based on 1H reference images that are acquired together with the 13C data. Additionally, smoothness is imposed on the estimated coil sensitivity profiles by penalizing high frequency components in k-space according to (1 + s · ∥k∥2)p, where S and p are weighting factors. Transforming Eq. [9] to a preconditioned system with the smoothness constraint is explained in Ref. 31.
SNR Considerations
The signal equation from the kth excitation of the gradient-echo type, hyperpolarized acquisition with the variable flip angle (VFA) scheme can be modeled as
where TR is the repetition time, T1 is the longitudinal relaxation parameter, N is the total number of excitations, and x = 1 … N is the spatial index. Here, we have neglected metabolic conversions. Additionally, Mt(x) denotes the flip angle compensated constant transverse magnetization, which is also determined by the initial longitudinal magnetization, the final flip angle, and the total number of excitations (N). Then, the point-spread-function (PSF) corresponding to an impulse image (Mt(1) = M and Mt (i) = 0 for i > 1) is given as
Based on the peak signal value S(1) and the fact that noise is proportional to the square root of N, the signal-to-noise ratio (SNR) can be estimated as
where [42]. In the case of simultaneous pyruvate and lactate acquisition, the total SNR is given by However, after the separation process, both the metabolite images undergo reduction in SNR as a result of g-factor related noise amplification: , . On the other hand, a sequential acquisition (e.g. pyruvate followed by lactate) will result in and , where the SNR is decreased by additional T1 decay due to the increased acquisition time. When imaging three or more metabolites, the SNR of a simultaneous acquisition will further decrease as the g-factor generally increases with the number of aliasing signals [33], while a sequential acquisition will also generally decrease as the longer acquisition will result in additional T1 decay.
METHODS
Scanning Hardware
All experiments were performed on a 3 T MRI scanner (GE Healthcare, WI, USA) equipped with 40 mT/m, 150 mT/m/ms gradients. In acquiring proton anatomical images, we used the body coil. For 13C imaging, two separate custom-built carbon coils were used for RF transmit and receive. The transmitter coil consists of a Helmholtz resonant pair in which two loops are arranged in clamshell fashion mounted on a dedicated patient cradle for volumetric transmission (35, Fig. 4a). The transmitter was dynamically detuned at the time of signal reception. The signal receiver comprises of two paddle-shaped compartments each having four surface coil elements (23, Fig. 4b). An example of the animal experiment setup using both the coils is shown in Figure 4c.
Figure 4.
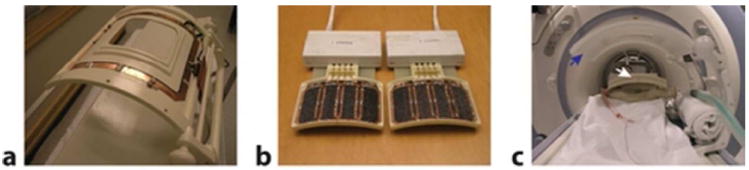
Coil setup used in experiments. (a) Clam shell RF transmitter. (b) Eight-channel receiver array. (c) Animal experimental setup. The white arrow points to the receiver array and the blue arrow the transmitter.
Image Reconstruction
We used Matlab (The Math Works, Inc.) to implement the nonlinear inversion method. All the programs were run on a Linux machine with a 3.40GHz CPU and 12 gigabytes of memory.
Hyperpolarization and Compounds
We used a HyperSense DNP system (Oxford Instruments, Abingdon, UK) operating at 3.35 T and 1.35° K to polarize the compounds used in this study. The preparation for pyruvate samples consisted of 15 M [1-13C]pyruvic acid in solution with 15 mM OX63 trityl radical along with 0.5 mM of gadolinium. Lactate samples were a mixture of 4 M [1-13C]lactate, water, dimethyl sulfoxide and 15 mM of OX63 trityl radical (36). For pyruvate and lactate co-polarization, we followed protocols described previously (37). The final 13C pyruvate and 13C lactate concentration in dissolved solution was 37.5 mM and 10 mM, respectively.
Simulation Study
Assuming concurrent acquisitions of pyruvate and shifted lactate images, we performed numerical simulation studies to investigate on the behavior of the g-factor as a function of the spatial shifts. To this end, a uniform circular phantom and coil profiles were simulated. Mimicking the given receiver array geometry, the sensitivity profiles of the eight-channel coils were calculated based on the principle of reciprocity and the Biot-Savart law in the quasi-static regime (38). Both the phantom and the sensitivities were generated in a 256 × 256 sized grid with the phantom diameter and FOV set to 10 and 12 cm, respectively. Finally, aliasing patterns that arise from the simultaneous acquisition and the corresponding g-factor maps were analytically calculated based on Eq. [6].
Pulse Sequence
We developed a 3D 13C imaging pulse sequence that consisted of a stack of flyback-EPI readout gradients and a set of multiband phase-modulated RF excitation pulses. The gradients and the pulses were designed to shift lactate images half the FOV in two different directions.
The frequency difference between the pyruvate and lactate resonances was estimated to be Δf = 390 Hz (≈ 12 ppm) at the field strength of 3 T. Based on this, a flyback-EPI gradient was designed to have a 781 Hz bandwidth (tesp = 1.28 ms) in its slow (blipped) direction with 32 echoes for phantom studies and 55 echoes for animal experiments (13). Maximum of 7.1 mm spatial resolution was achieved in the readout direction with ramp sampling and gridding under the gradient hardware limitation.
We also designed a set of 32 multiband RF pulses, allocating individual pulses to each of 32 phase encoding steps. The pulses were developed following the methods outlined in (34, 39). In summary, spectral responses of all the pulses were defined for the pyruvate, lactate, alanine, and pyruvate-hydrate resonances with a bandwidth of ± 0.5 ppm (± 16 Hz at 3 T) within a spectral window of 600 Hz. Alanine and pyruvate-hydrate signals were suppressed by maintaining 0° flip angle around their spectral bands. In the case of pyruvate and lactate, the same flip angles were assigned to both metabolites with each angle value increasing over the number of phase encodes based on the VFA scheme (40).
The final flip angle was set to 60°. Additionally, to apply π-phase cycling on the lactate signal, phase profiles on the lactate resonance were defined to be π and 0 radians at odd and even echoes, respectively. On the contrary, pyruvate phase was fixed to . This scheme would always tip pyruvate spins down to +y axis, whereas lactate spins are chopped along −x and +x axis. Another set of RF pulses without the lactate RF chopping was also implemented for the purpose of comparison. Given the magnitude and phase spectral specifications, we adopted FIR filter design method based on convex optimization to determine complex-coefficient filters that meet the requirements. Spatial selectivity for slab excitation was designed with a 12 cm slab thickness, 0.1 % in-slice ripple and 1% out-of-slice ripple.
Phantom Study
We performed three phantom studies to test the developed 3D pulse sequence. A plastic spherical container 10 cm in diameter was filled with purified water and was placed between the two coil arrays similar to the configuration shown in Figure 5a. For each experiment, we injected hyperpolarized samples into the solution in the container and waited 30 seconds before the start of data acquisition. The waiting was done to ensure the full mixing of the polarized samples. The excitation frequency was set to the arithmetic mean value of the pyruvate and lactate resonance. After each acquisition, the data has been phased to center at the pyruvate resonance.
Figure 5.
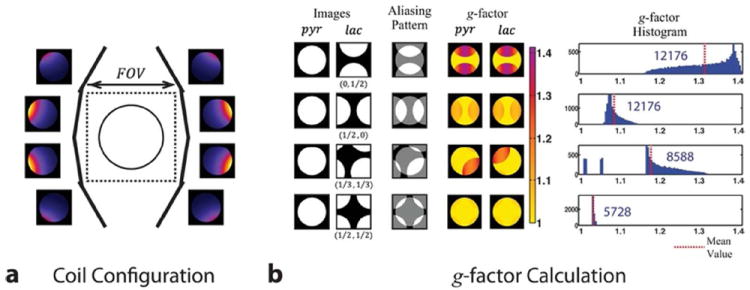
Geometry factor simulation. (a) Schematic of coil configuration with numerical phantom in the center. (b) Simulated aliasing patterns, calculated g-factors and their histograms for four cases of spatial shifting. Shifting the lactate image half the field of view in each direction resulted in the lowest g-factor values. The numbers inside the histograms represent the total number of pixels.
In the first experiment, we hyperpolarized pyruvic acid sample for an hour, dissolved it into 3 mL of neutralizing buffer and injected the solution into the phantom. Then, 13C data was acquired with the 3D pulse sequence set to play out the multiband RF pulse that applies π phase modulation on the lactate resonance. Once the data was acquired, it was Fourier transformed to the image domain. We then investigated the spatial shifting capability of the flyback-EPI gradient. For this experiment, we co-polarized pyruvate and lactate samples and acquired data using the RF pulses that did not apply the π phase modulation, which was done to limit the spatial shifting of lactate images only in the slow direction of the EPI readout. Finally, we tested the 2D spatial shifting of lactate images by applying both the flyback-EPI and phase modulated RF pulses on a pyruvate/lactate co-polarized sample.
Immediately following each 3D data acquisition, we also acquired FID spectra having spectral width of 1000 Hz and resolution of 0.5 Hz. This was done to confirm the relative concentrations and the resonance frequencies of the 13C compounds inside the phantom.
In all three 13C experiments, TR was set to 80 ms for 2.56 s of total imaging time. Axial FOV was set to 12 cm × 12 cm with 3.75 mm × 3.75 mm in-plane resolution and 7.1 mm slice thickness. The final data matrix size was 32 × 32 × 17. Additional 1H reference images were acquired using a T2-weighted fast spin echo (FSE) sequence with the same FOV in a 256 × 256 axial grid.
Images of pyruvate and lactate as well as eight channel sensitivity maps were calculated for the co-polarization data using the previously discussed nonlinear inversion method. We used values of s = 20 and p = 16 in enforcing smoothness constraint on estimated coil sensitivities and q = 1/3 for the regularization parameter. The IRGN method iterated for 6 Newton steps.
In Vivo Study
All animal studies were carried out under protocols approved by the UCSF Institutional Animal Care and Use Committee. Normal Sprague–Dawley rats were placed on a heating pad atop the array receiver on its side and anesthetized with 2–3% of isoflurane. The rat’s head and tail were positioned to the right and left respectively, when looking into the magnet bore (Figure 4).
A bolus of hyperpolarized pyruvate (2.5 mL) was injected through a tail vein catheter, over a period of 12 seconds. We waited another 20 seconds before acquiring 13C MR data. Two acquisitions were done in a given animal study: a 1° flip angle FID acquisition followed by the 3D stack-of-flyback EPI pulse sequence. The low flip angle FID experiment was done to estimate the in vivo center frequency. For the 3D sequence, the TR was set to 110 ms for 2 s of total imaging time. Axial FOV was set to 220 mm × 72 mm with 4 mm × 4 mm in-plane resolution and 7.1 mm slice thickness. The final data matrix size was 55 × 18 × 17. We used the last 18 multiband pulses out of the designed 32 pulses for the animal imaging.
RESULTS
Simulation Study
Figure 5a shows the configuration of the eight-channel paddle coil array and its simulated profiles. Aliasing patterns resulting from the concurrent acquisition of pyruvate and shifted lactate images are also shown for four sets of spatial shifting values together with the calculated g-factor maps and corresponding histograms (Fig. 5b). The simulated results show that two-dimensional shifting of the lactate image by half the FOV in each direction results in the lowest mean g-factor, which also offers minimum noise amplification in the final results of pyruvate and lactate images once they are separated from one another. This is due to the ability to better exploit the coil sensitivity variation in multiple dimensions. Therefore, the subsequent experiments focused on implementing and utilizing EPI readouts and RF pulses that apply phase modulations on lactate signal to induce FOV/2 spatial shifting.
Pulse Sequence
The multiband spectral-spatial RF pulses corresponding to the last two encoding steps with flip angles 41° and 60° are shown in Figure 6. The complex filter design method achieved a 15 ms pulse length for all the RF pulses. The result of adopting the VFA scheme is reflected in peak RF amplitudes as well as magnitude responses (|Mxy|) with 0.23 G being the maximum peak amplitude for the RF pulse in Figure 6b. Phase profiles (∠M xy) show the π-phase cycling applied on the lactate resonance.
Figure 6.
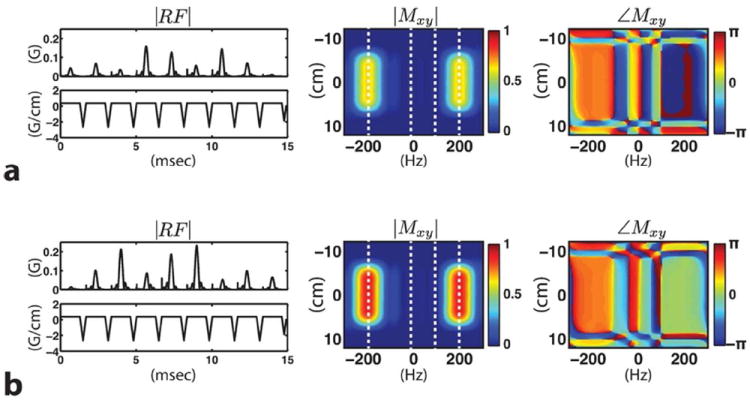
Two of the developed multiband excitation RF pulses shown (|RF|) with their corresponding magnitude (|Mxy|) and phase (∠Mxy) profiles. The RF pulse in (a) with 41° flip angle is followed by the one shown in (b) with 60° in the last two consecutive phase encoding steps. Starting from the left, the white dotted lines are placed on the resonant frequencies of pyruvate, alanine, pyruvate-hydrate and lactate. Excitation band is defined around the pyruvate and lactate resonance, whereas other active metabolites such as alanine and pyruvate-hydrate are not excited. Note the phase modulation applied on the lactate resonance.
Phantom Study
Figure 7a shows the proton image acquired with the FSE sequence for spatial reference. As shown in the figure, the spherical phantom was not filled fully for the sake of identifying orientations. Figure 7b shows the acquired 13C data. Here, we chose the center slice images for display. The top row shows square root of sum of squares (SSoS) images from each experiment, the middle row shows images from two individual channels and the FID spectra are in the last row.
Figure 7.
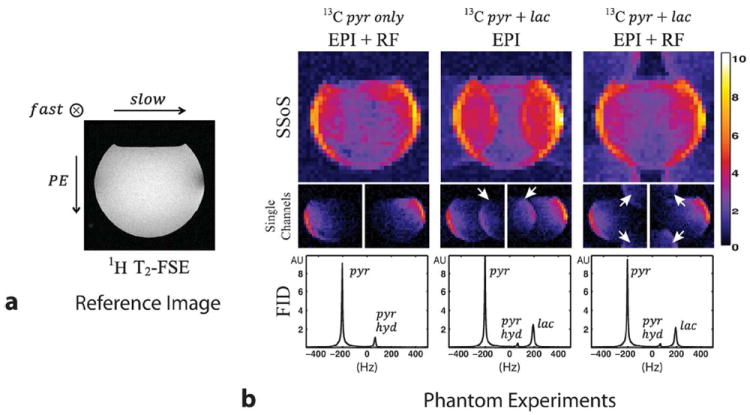
Spatial shifting of lactate image with respect to pyruvate image. (a) Reference proton image acquired with a FSE sequence. (b) Square root of sum of squared phantom images (first row), two individual channel images (middle row) and FID spectrum from the entire phantom (last row) for the case of pyruvate only polarization (first column), pyruvate and lactate co-polarization with flyback EPI only acquisition (middle column) and co-polarization adopting phase modulated RF pulses together with the flyback EPI (last column). The FID spectra show that pyruvate-hydrate signal exists inside the phantom ball in each experiment. However, chemical shift artifacts that would have resulted from the hydrate signal are suppressed by adopting the multiband RF pulses. The white arrows point to the shifted lactate images.
The FID result from the first experiment (first column), in which only the polarized pyruvate sample was injected into the phantom, shows that pyruvate-hydrate was in equilibrium with pyruvate at a ratio of approximately one-to-nine. However, chemical shift artifacts that would have originated from the hydrate signal were not seen in the phantom images. This is because the multiband RF pulses do not have excitation bands including the pyruvate-hydrate resonance. The results shown in the middle column are from the pyruvate and lactate co-polarization experiment in which only the flyback-EPI readout was adopted. As a consequence, the lactate image was shifted half the FOV only in the slow direction. The lactate signal intensity was approximately one-fourth the pyruvate signal, which is also observed from the FID spectrum. Finally, the last column shows images from the pyruvate and lactate co-polarization experiment with both the flyback-EPI and phase modulating RF pulse employed. The results clearly showed that the lactate image was shifted in two directions to reside in the four corners within the FOV.
Separated pyruvate and lactate images from the two co-polarization experiments for two different slice locations are shown in Figure 8. The estimated sensitivity profiles generally showed smooth variations over the FOV. In the case of 1D spatial shifting (Fig. 8a), however, the separated lactate images suffered severe SNR loss due to amplification of noise. On the contrary, the images from the 2D shifting case had less SNR loss as signal aliasing has been minimized.
Figure 8.
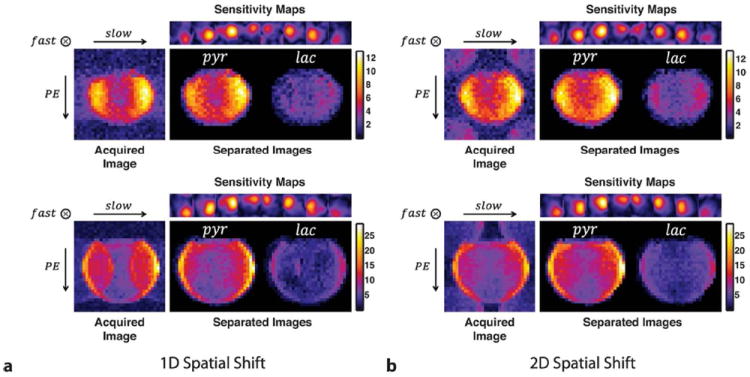
Chemical shift separation results for (a) 1D and (b) 2D spatial shifting for two different slices. Estimated coil sensitivity profiles are also shown.
In Vivo Study
Figure 9a shows a coronal anatomical image with two kidneys of the rat and Figure 9b shows the acquired 13C data that corresponds to the kidney slice. We can clearly see that most of the 13C signal is localized around the kidney and the renal artery. The FID spectrum result (Fig. 9c) shows the relative amount of metabolites produced inside the animal. Finally, estimated pyruvate and lactate images are shown in Figure 9d.
Figure 9.
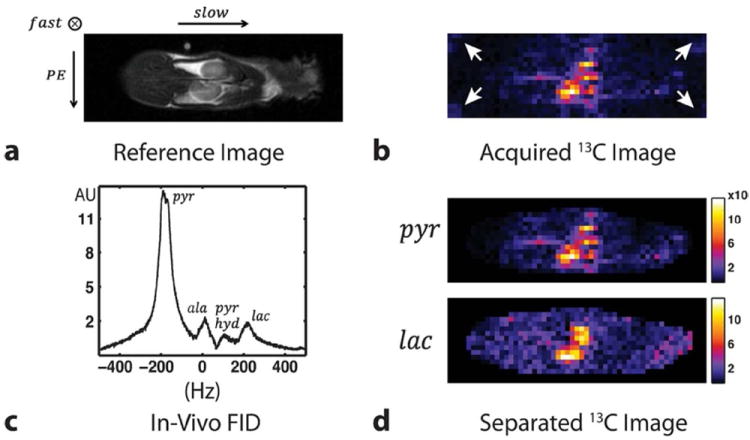
Results from in vivo rat experiment. (a) Reference proton image, (b) acquired 13C image through kidneys of the rat, (c) a FID spectrum from the entire animal and (d) separated pyruvate and lactate images. Both the pyruvate and lactate 13C signals are well localized to the kidneys. All the 13C images are combined with the square root of sum of squares method. The white arrows point to the shifted lactate images.
Discussion
In this work, we adopted the idea of using parallel imaging reconstruction to separate simultaneously acquired metabolite images. This approach offers the benefit of resolving spatial distribution information for multiple metabolites within the same time as for just one resonance with high spatial resolution and a short imaging time of a few seconds. We emphasize that careful arrangement of aliasing patterns are desired to minimize the noise amplification that would result from the separation process. For the two-metabolite case shown in this work, we shifted the images by half the FOV in two different directions. In the more general case with more than two metabolites, multiband RF pulses can be designed to apply different phase cycling on each resonance to shift images equidistance apart, which will generally result in the lowest g-factor values. An optimal echo spacing value for the EPI trajectory given a set of resonance frequencies can also be decided by performing a numerical simulation similar to the work shown earlier.
In acquiring data, we have used a prototype C-13 receiver array for both the phantom and animal experiments. While the current coil was adequate for this proof-of-concept study, a smaller phased-array coil conformed better to the shape of the animal could improve the performance of this approach. For example, the placement of the readout direction could then be aligned with the longest dimension of the imaging subject resulting in a shorter imaging time.
In incorporating the VFA scheme into the multiband RF pulse designing, we set the final flip angle value to be 60°. This would leave 10% of hyperpolarized signal at the end of the phantom experiments (32 phase encodes) and 13.5% for the animal experiment (18 phase encodes). The left over signal can then be used for other acquisitions. If a larger remaining signal is desired, the final flip angle can be adjusted appropriately.
Finally, with B0 inhomogeneity, estimating the object mask could become nontrivial because EPI images suffer geometric distortions and would not align very well with the anatomical reference images. Hence, B0 correction methods could further improve the reconstruction.
Conclusions
In this work, we developed and tested in phantoms and animals a new fast 3D acquisition scheme to acquire multiple hyperpolarized 13C metabolite images simultaneously. We also developed a specialized reconstruction method to separate the aliased images. This method was shown to provide highly accelerated hyperpolarized 13C MR images of pyruvate and lactate. Furthermore, the technique can be readily extended for other hyperpolarized agents or applications by the flexible design of readout gradient and RF pulses.
Acknowledgments
The authors thank Dr. Robert Bok, Dr. Ilwoo Park and Vickie Yi Zhang for their help in animal experiments and Lucas Carvajal for assistance with the RF coils. This study was supported in part by a Sloan Research Fellowship, GE Healthcare, NIH grants P41-EB013598, R01-EB013427, R01-EB017449, R00-EB012064, and R01-CA183071.
Appendix
For convenience, the nonlinear operator F in Eq. [7] is rewritten here.
Then, based on the product rule, the derivative of F is given by
together with its adjoint operator being
where * is the pixel-wise complex conjugation.
Footnotes
Presented in part at the 21th Annual Meeting of the ISMRM, Salt Lake City, USA 2013
References
- Golman K, Ardenkjaer-Larsen JH, Petersson JS, Mansson S, Leunbach I. Molecular imaging with endogenous substances. Proc Natl Acad Sci USA. 2003;100:10435–10439. doi: 10.1073/pnas.1733836100. [DOI] [PMC free article] [PubMed] [Google Scholar]
- Golman K, in ’t Zandt R, Thaning M. Real-time metabolic imaging. Proc Natl Acad Sci USA. 2006;103:11270–11275. doi: 10.1073/pnas.0601319103. [DOI] [PMC free article] [PubMed] [Google Scholar]
- Ardenkjaer-Larsen JH, Fridlund B, Gram A, Hansson G, Hansson L, Lerche MH, Servin R, Thaning M, Golman K. Increase in signal-to-noise ratio of >10,000 times in liquid-state NMR. Proc Natl Acad Sci USA. 2003;100:10158–10163. doi: 10.1073/pnas.1733835100. [DOI] [PMC free article] [PubMed] [Google Scholar]
- Chen AP, Albers MJ, Cunningham CH, Kohler SJ, Yen YF, Hurd RE, Tropp J, Bok R, Pauly JM, Nelson SJ, Kurhanewicz J, Vigneron DB. Hyperpolarized C-13 spectroscopic imaging of the TRAMP mouse at 3T-initial experience. Magn Reson Med. 2007;58:1099–1106. doi: 10.1002/mrm.21256. [DOI] [PubMed] [Google Scholar]
- Hu S, Balakrishnan A, Bok RA, Anderton B, Larson PE, Nelson SJ, Kurhanewicz J, Vigneron DB, Goga A. 13C-pyruvate imaging reveals alterations in glycolysis that precede c-myc-induced tumor formation and regression. Cell Metab. 2011;14:131–142. doi: 10.1016/j.cmet.2011.04.012. [DOI] [PMC free article] [PubMed] [Google Scholar]
- Kurhanewicz J, Vigneron DB, Brindle K, Chekmenev EY, Comment A, Cunningham CH, DeBerardinis RJ, Green GG, Leach MO, Rajan SS, Rizi RR, Ross BD, Warren WS, Malloy CR. Analysis of cancer metabolism by imaging hyperpolarized nuclei: prospects for translation to clinical research. Neoplasia. 2011;13:81–97. doi: 10.1593/neo.101102. [DOI] [PMC free article] [PubMed] [Google Scholar]
- Lau AZ, Chen AP, Ghugre NR, Ramanan V, Lam WW, Connelly KA, Wright GA, Cunningham CH. Rapid multislice imaging of hyperpolarized 13C pyruvate and bicarbonate in the heart. Magn Reson Med. 2010;64:1323–1331. doi: 10.1002/mrm.22525. [DOI] [PubMed] [Google Scholar]
- Schroeder MA, Lau AZ, Chen AP, Gu Y, Nagendran J, Barry J, Hu X, Dyck JR, Tyler DJ, Clarke K, Connelly KA, Wright GA, Cunningham CH. Hyperpolarized 13C magnetic resonance reveals early- and late-onset changes to in vivo pyruvate metabolism in the failing heart. Eur J Heart Fail. 2013;15:130–140. doi: 10.1093/eurjhf/hfs192. [DOI] [PMC free article] [PubMed] [Google Scholar]
- Hurd RE, Yen Y-F, Mayer D, Chen A, Wilson D, Kohler S, Bok R, Vigneron D, Kurhanewicz J, Tropp J, Spielman D, Pfefferbaum A. Metabolic imaging in the anesthetized rat brain using hyperpolarized [1-13C] pyruvate and [1-13C] ethyl pyruvate. Magn Reson Med. 2010;63:1137–1143. doi: 10.1002/mrm.22364. [DOI] [PMC free article] [PubMed] [Google Scholar]
- Park I, Bok R, Ozawa T, Phillips JJ, James CD, Vigneron DB, Ronen SM, Nelson SJ. Detection of early response to temozolomide treatment in brain tumors using hyperpolarized 13C NMR metabolic imaging. J Magn Reson Imaging. 2011;33:1284–1290. doi: 10.1002/jmri.22563. [DOI] [PMC free article] [PubMed] [Google Scholar]
- Nelson SJ, Kurhanewicz J, Vigneron DB, Larson PEZ, Harzstark AL, Ferrone M, van Criekinge M, Chang JW, Bok R, Park I, Reed G, Carvajal L, Small EJ, Munster P, Weinberg VK, Ardenkjaer-Larsen JH, Chen AP, Hurd RE, Odegardstuen L-I, Robb FJ, Tropp J, Murray JA. Metabolic imaging of patients with prostate cancer using hyperpolarized [1-13C] pyruvate. Sci Transl Med. 2013 doi: 10.1126/scitranslmed.3006070. [DOI] [PMC free article] [PubMed] [Google Scholar]
- Nelson SJ. Magnetic resonance spectroscopic imaging. IEEE Eng Med Biol. 2004;23:30–39. doi: 10.1109/memb.2004.1360406. [DOI] [PubMed] [Google Scholar]
- Cunningham CH, Vigneron DB, Chen AP, Xu D, Nelson SJ, Hurd RE, Kelley DA, Pauly JM. Design of flyback echo-planar readout gradients for magnetic resonance spectroscopic imaging. Magn Reson Med. 2005;54:1286–1289. doi: 10.1002/mrm.20663. [DOI] [PubMed] [Google Scholar]
- Cunningham CH, Chen AP, Albers MJ, Kurhanewicz J, Hurd RE, Yen Y-F, Pauly JM, Nelson SJ, Vigneron DB. Double spin-echo sequence for rapid spectroscopic imaging of hyperpolarized 13C. J Magn Reson. 2007;187:357–362. doi: 10.1016/j.jmr.2007.05.014. [DOI] [PubMed] [Google Scholar]
- Mayer D, Yen Y-F, Tropp J, Pfefferbaum A, Hurd RE, Spielman DM. Application of subsecond spiral chemical shift imaging to real-time multislice metabolic imaging of the rat in vivo after injection of hyperpolarized 13C1-pyruvate. Magn Reson Med. 2009;62:557–564. doi: 10.1002/mrm.22041. [DOI] [PMC free article] [PubMed] [Google Scholar]
- Mayer D, Levin YS, Hurd RE, Glover GH, Spielman DM. Fast metabolic imaging of systems with sparse spectra: application for hyperpolarized 13C imaging. Magn Reson Med. 2006;56:932–937. doi: 10.1002/mrm.21025. [DOI] [PubMed] [Google Scholar]
- Donoho DL. Compressed sensing. IEEE Trans Inform Theory. 2006;52:1289–1306. [Google Scholar]
- Lustig M, Donoho DL, Pauly JM. Sparse MRI: the application of compressed sensing for rapid MR imaging. Magn Reson Med. 2007;58:1182–1195. doi: 10.1002/mrm.21391. [DOI] [PubMed] [Google Scholar]
- Hu S, Lustig M, Chen AP, Crane J, Kerr A, Kelley DAC, Hurd R, Kur hanewicz J, Nelson SJ, Pauly JM, Vigneron DB. Compressed sensing for resolution enhancement of hyperpolarized 13C flyback 3D-MRSI. J Magn Reson. 2008;192:258–264. doi: 10.1016/j.jmr.2008.03.003. [DOI] [PMC free article] [PubMed] [Google Scholar]
- Hu S, Lustig M, Balakrishnan A, Larson PEZ, Bok R, Kurhanewicz J, Nelson SJ, Goga A, Pauly JM, Vigneron DB. 3D compressed sensing for highly accelerated hyperpolarized 13C MRSI with in vivo applications to transgenic mouse models of cancer. Magn Reson Med. 2010;63:312–321. doi: 10.1002/mrm.22233. [DOI] [PMC free article] [PubMed] [Google Scholar]
- Larkman DJ, Nunes RG. Parallel magnetic resonance imaging. Phys Med Biol. 2007;52:15–55. doi: 10.1088/0031-9155/52/7/R01. [DOI] [PubMed] [Google Scholar]
- Arunachalam A, Whitt D, Fish K, Giaquinto R, Piel J, Watkins R, Hancu I. Accelerated spectroscopic imaging of hyperpolarized C-13 pyruvate using SENSE parallel imaging. NMR Biomed. 2009;22:867–873. doi: 10.1002/nbm.1401. [DOI] [PubMed] [Google Scholar]
- Tropp J, Lupo JM, Chen A, Calderon P, McCune D, Grafendorfer T, Ozturk-Isik E, Larson PEZ, Hu S, Yen Y-F, Robb F, Bok R, Schulte R, Xu D, Hurd R, Vigneron D, Nelson S. Multi-channel metabolic imaging, with SENSE reconstruction, of hyperpolarized [1-13C] pyruvate in a live rat at 3.0 tesla on a clinical MR scanner. J Magn Reson. 2011;208:171–177. doi: 10.1016/j.jmr.2010.10.007. [DOI] [PMC free article] [PubMed] [Google Scholar]
- Cunningham CH, Chen AP, Lustig M, Hargreaves BA, Lupo J, Xu D, Kurhanewicz J, Hurd RE, Pauly JM, Nelson SJ, Vigneron DB. Pulse sequence for dynamic volumetric imaging of hyperpolarized metabolic products. J Magn Reson. 2008;193:139–146. doi: 10.1016/j.jmr.2008.03.012. [DOI] [PMC free article] [PubMed] [Google Scholar]
- Reed GD, Larson PEZ, von Morze C, Bok R, Lustig M, Kerr AB, Pauly JM, Kurhanewicz J, Vigneron DB. A method for simultaneous echo planar imaging of hyperpolarized 13C pyruvate and 13C lactate. J Magn Reson. 2012;217:41–47. doi: 10.1016/j.jmr.2012.02.008. [DOI] [PMC free article] [PubMed] [Google Scholar]
- Breuer FA, Blaimer M, Heidemann RM, Mueller MF, Griswold MA, Jakob PM. Controlled aliasing in parallel imaging results in higher acceleration (CAIPIRINHA) for multi-slice imaging. Magn Reson Med. 2005;53:684–691. doi: 10.1002/mrm.20401. [DOI] [PubMed] [Google Scholar]
- Breuer FA, Blaimer M, Mueller MF, Seiberlich N, Heidemann RM, Griswold MA, Jakob PM. Controlled aliasing in volumetric parallel imaging (2D CAIPIRINHA) Magn Reson Med. 2006;55:549–556. doi: 10.1002/mrm.20787. [DOI] [PubMed] [Google Scholar]
- Larkman DJ, Counsell S, Hajnal JV. Water and Fat Separation using Standard SENSE Processing. Proceedings of the 13th Annual Meeting of ISMRM; South Beach, Miami. 2005. p. 505. [Google Scholar]
- Uecker M, Lustig M. Making SENSE of Chemical Shift: Separating Species in Single-Shot EPI using Multiple Coils. Proceedings of the 13th Annual Meeting of ISMRM; South Beach, Miami. 2012. p. 2490. [Google Scholar]
- Lu L, Donnola SB, Koontz M, Griswold MA, Duerk JL, Flask CA. Lipid elimination with an echo-shifting N/2-ghost acquisition (LEENA) MRI. Magn Reson Med. 2014 doi: 10.1002/mrm.25177. [DOI] [PMC free article] [PubMed] [Google Scholar]
- Uecker M, Hohage T, Block KT, Frahm J. Image reconstruction by regularized nonlinear inversion-Joint estimation of coil sensitivities and image content. Magn Reson Med. 2008;60:674–682. doi: 10.1002/mrm.21691. [DOI] [PubMed] [Google Scholar]
- Pruessmann KP, Weiger M, Scheidegger MB, Boesiger P. SENSE: Sensitivity encoding for fast MRI. Magn Reson Med. 1999;42:952–962. [PubMed] [Google Scholar]
- Bernstein MA, King KF, Zhou XJ. Handbook of MRI pulse sequences. Elsevier Academic Press; 2004. [Google Scholar]
- Larson PEZ, Kerr AB, Chen AP, Lustig MS, Zierhut ML, Hu S, Cunningham CH, Pauly JM, Kurhanewicz J, Vigneron DB. Multiband excitation pulses for hyperpolarized 13C dynamic chemical shift imaging. J Magn Reson. 2008;194:121–127. doi: 10.1016/j.jmr.2008.06.010. [DOI] [PMC free article] [PubMed] [Google Scholar]
- Tropp J, Sugiura S. A dual-tuned probe and multiband receiver front end for X-nucleus spectroscopy with proton scout imaging in vivo. Magn Reson Med. 1989;11:405–412. doi: 10.1002/mrm.1910110315. [DOI] [PubMed] [Google Scholar]
- Chen AP, Kurhanewicz J, Bok R, Xu D, Joun D, Zhang V, Nelson SJ, Hurd RE, Vigneron DB. Feasibility of using hyperpolarized [1-13C]lactate as a substrate for in vivo metabolic 13C MRSI studies. Magn Reson Imaging. 2008;26:721–726. doi: 10.1016/j.mri.2008.01.002. [DOI] [PMC free article] [PubMed] [Google Scholar]
- Wilson DM, Keshari KR, Larson PEZ, Chan AP, Hu S, Van Criekinge Bok R, Nelson SJ, Macdonald JM, Vigneron DB, Kurhanewicz J. Multi-compound polarization by DNP allows simultaneous assessment of multiple enzymatic activities in vivo. J Magn Reson. 2010;205:141–147. doi: 10.1016/j.jmr.2010.04.012. [DOI] [PMC free article] [PubMed] [Google Scholar]
- Ohliger MA, Sodickson DK. An introduction to coil array design for parallel MRI. NMR Biomed. 2006;19:300–315. doi: 10.1002/nbm.1046. [DOI] [PubMed] [Google Scholar]
- Kerr AB, Larson PEZ, Vigneron DB, Pauly JM. Complex Multiband Spectral-Spatial RF Pulse Design for Hyperpolarized C-13 Applications. Proceedings of the 21th Annual Meeting of ISMRM; Salt Lake City. 2013. p. 2398. [Google Scholar]
- Zhao L, Mulkern R, Tseng C, Williamson D, Patz S, Kraft R, Walsworth RL, Jolesz FA, Albert MS. Gradient-echo imaging considerations for hyperpolarized 129Xe MR. J Magn Reson B. 1996;113:179–183. [PubMed] [Google Scholar]
- Haldar JP, Hernando D, Karampinos DC, Sutton BP, Georgiadis JG, Liang Z-P. Sensitivity Encoding of Chemical Shifts. Proceedings of the 16th Annual Meeting of ISMRM; Toronto. 2008. p. 1283. [Google Scholar]
- Lee RF, Johnson G, Grossman RI, Stoeckel B, Trampel R, McGuinness G. Advantages of parallel imaging in conjunction with hyperpolarized helium – A new approach to MRI of the lung. Magn Reson Med. 2006;55:1132–1141. doi: 10.1002/mrm.20855. [DOI] [PubMed] [Google Scholar]