

Abstract
Machine learning has immense potential to enhance diagnostic and intervention research in the behavioral sciences, and may be especially useful in investigations involving the highly prevalent and heterogeneous syndrome of autism spectrum disorder. However, use of machine learning in the absence of clinical domain expertise can be tenuous and lead to misinformed conclusions. To illustrate this concern, the current paper critically evaluates and attempts to reproduce results from two studies (Wall et al., 2012a; Wall et al., 2012b) that claim to drastically reduce time to diagnose autism using machine learning. Our failure to generate comparable findings to those reported by Wall and colleagues using larger and more balanced data underscores several conceptual and methodological problems associated with these studies. We conclude with proposed best-practices when using machine learning in autism research, and highlight some especially promising areas for collaborative work at the intersection of computational and behavioral science.
Keywords: Autism Diagnostic Observation Schedule, Autism Diagnostic Interview, machine learning, signal processing, autism, diagnosis
The landscape of psychological and psychiatric research is increasingly interdisciplinary, where novel insights often stem from diverse expertise. The integrative study of autism spectrum disorder (ASD) represents an exemplar for translational research of a psychiatric disorder (Amaral et al., 2011). Theoretical and empirical contributions from clinical, genetic, neuroscientific, and animal studies have the potential to not only elucidate the causes of ASD, but also to identify mechanisms for early diagnosis and individualized interventions (Dawson et al., 2002; Levitt & Campbell, 2009).
In recent years, advanced computational and engineering methodologies have been employed to meet the needs of cross-disciplinary applications in psychology and psychiatry. For example, machine learning methods have demonstrated success in areas such as bioinformatics (Baldi, 2001), affective computing (Picard, 2000), behavioral informatics (Black et al., 2013; Narayanan & Georgiou 2013), and medical diagnosis (Wei et al., 2005). Machine learning – which builds upon sophisticated mathematical learning, statistical estimation, and information theories – is of particular interest to researchers as a generally applicable computational framework for automatically discovering useful patterns in large amounts of data. A learned data representation can, for instance, provide insights into the processes that generated the data, help visualize data to assist humans in clinical decision making, and predict a target variable from a set of input features (i.e., classification). Given these appealing affordances, it is not surprising that the use of computational and engineering methodologies is rapidly evolving in the study of neurocognitive disorders (Bone et al., 2014; Chaspari et al., 2013; Hu & Steinberg, 2009; Ye et al., 2012).
One apparent utility of machine learning in autism research is to create an efficient and robust diagnostic algorithm based on human coded behaviors from diagnostic instruments such as the Autism Diagnostic Interview-Revised (ADI-R; Lord et al., 1994) and the Autism Diagnostic Observation Schedule (ADOS; Gotham et al, 2007; Lord et al., 2000). A certain degree of hand-construction by experts (supported by rigorous statistical analysis) is involved in creating these diagnostic instruments, so it is reasonable to believe that objective machine learning methods may provide more reliable performance and/or increased efficiency by reducing redundancy within an instrument. More rapid diagnostic procedures could facilitate acquisition of the very large cohorts (over 10,000 subjects; Abrahams & Geschwind, 2010) needed to reliably uncover the complex neurogenic etiology of ASD. Researchers have sought rapid categorical assessments of ASD (Constantino et al., 2007; Lee et al., 2010), although often at the cost of reduced sensitivity/specificity, or population sampling biased towards more severely impacted individuals. Machine learning seems a viable option for accelerating these diagnostic efforts by identifying essential nosological components, eliminating redundancy but maintaining accuracy. However, as we will discuss and demonstrate empirically in this paper, the task is not as simple as it may initially appear.
While powerful, machine learning is prone to misinterpretation, especially when utilized in interdisciplinary studies (not unlike other statistical techniques). The application of engineering methods and interpretation of the results they generate requires a thorough understanding of both computational and clinical content domains. It is essential that a computational researcher consider the sources and properties of the data when applying machine learning techniques; the manner in which data were elicited/collected and what purposes they are intended to serve are of paramount importance to ensure that interpretation of results are accurate, unbiased, and not overstated. Focusing solely on data processing, but ignoring context, can produce misleading results and conclusions. Conversely, the application of computational methods by researchers outside machine learning communities can be a precarious situation because there are numerous ways to misuse algorithms and misjudge their results1. As such, it is crucial that computational and behavioral researchers collaborate in these endeavors, with each community learning as much as possible about the other’s domain to relay best practices, provide context, and assist in interpreting results. This approach to inquiry is especially vital in an area with such profound impact and public health significance as mental health disorders research; if an algorithm is widely purported to improve diagnostics or aid intervention, the claim comes with tremendous social ramifications and responsibility.
The current paper identifies several subtle but important pitfalls when incorporating machine learning techniques in autism diagnostics, leading to proposed best-practices for future applications of machine learning in autism research. The impetus for this contribution stems from two published autism studies which sought to use machine learning techniques for very rapid (several minutes) assessment of ASD using the ADOS (Wall et al., 2012a) and the ADI-R (Wall et al., 2012b). In addition to critically evaluating these experimental contributions, we attempt to reproduce the findings of Wall and colleagues using a larger, more balanced corpus of ADOS and ADI-R data, while accounting for potential sources of error that we will argue, if not addressed, produce misleading and non-replicable results. We also recommend a classification performance metric called unweighted average recall that is better suited for data with unbalanced classes than the more commonly used measure of performance, accuracy. Finally, we close by briefly outlining applications of machine learning and signal processing that hold promise to advance our understanding of autism diagnosis and intervention research.
Wall et al. (2012a) Experiments and Critique
The experiments of Wall et al. (2012a) claim to shorten the observation-based coding of the ADOS in an effort to provide more time-efficient diagnoses while maintaining validity. Our critical analysis of this study begins with a brief overview of the ADOS instrument, followed by a description of the data used, their experimental claims, and our critique citing conceptual and methodological issues in the approach.2
Autism Diagnostic Observation Schedule
The ADOS is a widely used, standardized assessment for diagnosing ASD that consists of 30–45 minutes of semi-structured interaction with a trained administrator to elicit and code behaviors relating to social interaction, communication, play, and imaginative use of materials (Lord et al., 2000). The ADOS consists of four distinct Modules that vary depending on an individual’s age and verbal abilities. We focus on Module 1 in this paper, as that was the module used in the Wall et al. (2012a) study under examination. It is designed for pre-verbal children and thus is most often used for early, initial ASD diagnosis. Module 1 incorporates 29 behavioral codes and 10 subtasks/activities. The ADOS algorithms were designed in an effort to map standardized behavioral observations to an ASD diagnosis. Creators of the instrument judiciously fused their collective and extensive clinical knowledge, Diagnostic and Statistical Manual of Mental Disorders, Fourth Edition (DSM-IV; American Psychiatric Association, 2000) criteria, and statistical analytics to handcraft the algorithm (Figure 1). The resulting algorithm was tested against best-estimate clinical (BEC) diagnosis that takes into consideration all the previously mentioned sources of information. The algorithm begins with 29 ADOS codes scored on varying integer scales from 0–3, with scores of 7 or 8 reserved for behaviors not assessable during test administration. As a pre-processing step, scores of 3 are mapped to 2, and all scores of 7 and 8 are mapped to 0 (i.e., non-score-able) for validity and reliability purposes (Lord et al., 2000). Next, the most relevant and reliable codes indicative of a BEC ASD diagnosis are selected. Of the 29 Module 1 codes, 12 are utilized in the original algorithm (Lord et al., 2000) and 14 in the revised algorithms (Gotham et al., 2007). The revised algorithms3 select separate sets of 14 codes depending on the verbal proficiency of the child. The remaining steps of the ADOS algorithm are comprised of summation and thresholding to classify differences between diagnostic groups. Specifically, all modified scores from the 14 selected codes are summed to create a combined Social Affect and Restricted, Repetitive Behavior Total (SA+RRB). Finally, the SA+RRB Total is used to classify three groups using two sets of thresholds. The three ADOS diagnostic groups are: Autism, Autism Spectrum, and Non-Spectrum (or Below Cutoffs).
Figure 1.
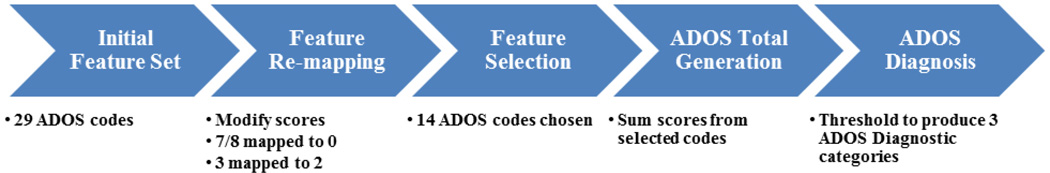
ADOS revised Module 1 algorithm (Gotham et al., 2007) block-diagram.
ADOS Data used in Wall et al. (2012a)
The training data used in Wall et al. (2012a) consisted primarily4 of ADOS Module 1 administrations from the Autism Genetics Resource Exchange (AGRE; Geschwind et al., 2001) database. The AGRE data (at that time, download meta-data unknown) contained 612 Autism subjects (M = 6.6 yr., SD = 4.1 yr.) and 11 Non-spectrum subjects (M= 4.6 yr., SD = 3.9 yr.); the central Autism Spectrum class contained in the ADOS was omitted. These numbers are post exclusion-criteria; in particular, test administrations missing 50% or more of ADOS scores and subjects not in the age range of 2–17 years were excluded.
Critical analysis of Wall et al. (2012a) ADOS experiments
Wall et al. (2012a) sought to shorten the ADOS by using machine learning techniques to automatically identify an ADOS diagnosis (outcome) using the fewest number of human expert-derived ADOS codes (features). The experimental setup is illustrated in Figure 2. From a systems’ point-of-view, this approach is an attempt at dimensionality reduction, one of the many plausible goals for computational analysis in ASD. The authors used 16 tree-based classifiers in the Weka toolkit of machine learning algorithms (Hall et al., 2009) with default parameter settings5. They found that two classifiers produced the highest accuracy, and thus selected the one that used the fewest number of codes: Alternating-Decision Tree (ADTree; Freund & Mason, 1999). Again, they omitted the central ADOS Autism Spectrum class due to insufficient sample size and instead conducted the simpler task of separating the more severe ADOS Autism cases from the ADOS Non-ASD cases. Eight codes were found to produce 100% accuracy in the training set using cross-validation. Testing on the remaining data revealed greater than 99.7% recall6 (sensitivity) classifying children with an ADOS Autism diagnosis and 94.4% recall (specificity) detecting an ADOS Non-Spectrum diagnosis in 1,000 simulated controls (97% unweighted average recall, the mean of sensitivity and specificity) – simulated controls were generated by randomly sampling scores from ADOS Non-spectrum cases in the training data.
Figure 2.

Machine learning approach to efficient ADOS diagnosis employed by Wall et al. (2012a).
While these classification results appear very promising, they need to be considered carefully within the context of how the ADOS was designed in order to be judged reliable and valid. As detailed below, the experimental setup of Wall et al. (2012a) suffers from several conceptual problems relating to the psychometric design and diagnostic principles of the ADOS, and several methodological issues relating to incorrect application of machine learning and data set limitations. Collectively, these issues bring into question inferences drawn from the results. We address the conceptual issues first, followed by the methodological issues.
Conceptual problems of Wall et al. (2012a) study
There are at least four conceptual problems with the study. First and foremost, Wall et al. (2012a) assert that a reduced set of ADOS codes – those utilized as inputs to the trained ADTree classifier – reduce the time required to determine an autism diagnosis “to minutes.” However, the ADOS must be fully administered for reliable and valid ADOS codes to be scored. More precisely, when ADOS scores were initially subjected to reliability analyses, coders were allowed to score any behavior in any subtask; meaning ADOS coding reliability is only established when administering all subtasks. Therefore, the approach by Wall et al. (2012a) may reduce ADOS codes, but it does not reduce tasks, i.e., administration time.
Second, in the absence of any established theoretical or empirical support, the authors implicitly assume incorrectly that ADOS codes are valid outside the context of a full ADOS administration. ADOS codes (input data to the machine learning algorithm) are currently only considered reliable and valid when elicited by a trained administrator using standardized materials during semi-structured social presses in the ADOS context. One of the primary assertions of Wall et al. (2012a) is that their algorithms can enable out-of-clinic screening; specifically, in-home (and thus more affordable, they claim) procedures for diagnosis. Yet, there is no empirical support that data collected from unstructured interactions by non-experts in non-standardized settings is sufficient for valid ADOS scoring with their proposed model. Validation of an instrument that operates in this scenario requires independent large-scale clinical studies.
Third, as mentioned briefly before, the study disregards the crucial middle ADOS Autism spectrum class. Only ADOS Autism (reserved for the most severe social-communicative impairments) and Non-spectrum diagnoses were used in classification, neglecting the subtlest, more heterogeneous, and most-difficult-to-identify Autism Spectrum diagnostic category. One could argue that classifying ADOS diagnosis from ADOS codes is trivial with polarized categories. Thus, the algorithm performance reported by Wall et al. (2012a) would be expected to drop significantly if this middle category were included, and we evaluate this hypothesis in our replication experiments described later in this paper.
Finally, Wall et al. (2012a) predicted ADOS diagnosis rather than BCE. As mentioned previously, BCE incorporates other measures in addition to the ADOS to achieve higher diagnostic validity, and should be considered the true “gold-standard.” Since the ADOS is one component towards a final diagnosis, any inaccuracy predicting ADOS diagnosis compounds diagnostic error. A more logical approach for Wall et al. (2012a) would have been to classify BCE from ADOS scores directly (thereby creating a new “ADOS algorithm”), especially considering their criticism of the “hand-selected” construction of the current ADOS algorithms. However, as stated previously, this still would not achieve the goal of reducing ADOS administration time.
Methodological problems of Wall et al. (2012a) study
This study also suffers from a variety of methodological issues that raise concerns about the reliability and validity of the results obtained. First, the resulting classifier was not validated on adequate data. The training data was severely imbalanced, limiting statistical power. The validation (test) data they used did not contain any “negative” instances, that is, ADOS Non-spectrum samples. Thus, the algorithm could not be validated for specificity on independent data.
To counter this data limitation, the authors simulated “test” samples using instances from the training data – the second methodological problem. Training data were used to learn feature distributions, and samples were simulated by randomly sampling scores for each code individually. Yet, this synthesized test data is merely a “noisy” version of the training data, wherein the test set is not independent.
Third, we feel that Wall et al. (2012a) should have pursued more rigorous evaluation of their results. That is, it appears that no effort was made to evaluate the reliability or validity of their results aside from peripheral reporting of accuracy on the test data. For instance, the reliability of the selected codes and resulting accuracy could have been assessed using data sub-sampling (e.g., bootstrapping). Since those analyses were not reported, questions left unanswered include: Were different subsets of codes selected within each cross-validation fold? Were the selected eight codes a unique set in achieving the reported performance? How robust are the results to variations in parameter settings?
Wall et al. (2012b) Experiments and Critique
Wall et al. (2012b) also claim to reduce time to diagnose autism using machine learning, although here they focus on behavioral-based codes from the ADI-R. In presenting our critical analysis of this study, the ADI-R is introduced briefly, followed by a description of the data used in Wall et al. (2012b), their experimental claims, and our critique, again citing conceptual and methodological issues in the approach.
Autism Diagnostic Interview – Revised
The ADI-R is a validated parent-report measure contributing to BCE diagnosis of children with autism. The interview is conducted by a trained clinician, contains 93 items, and typically takes three hours to complete. The ADI-R focuses on the areas of reciprocal social interaction; communication and language; and restricted and repetitive, stereotyped interests and behaviors. Questions in the interview provide a high degree of granularity; for example, questions in the Reciprocal Social Interaction category query specific social cues such as inappropriate facial expressions, use of other people’s bodies to communicate, and appropriateness of social response. Each ADI-R question is asked twice, once about current behavior, and once about either “most abnormal 4 to 5 years” or “ever”; the algorithm uses the latter two time periods.
The ADI-R has an associated algorithm that generates subtotal scores tapping its respective content areas; wherein each subtotal has a threshold that must be met for a diagnosis of Autism (much like the ADOS). If any cutoff is not met, the subject is diagnosed as Non-Autism. Items are given integer scores in the range 0–3, where a 0 indicates the behavior was not currently present, and a 3 indicates “extreme severity” of the coded behavior. There are also scores of 7–9 indicating non-score-able items. As with the ADOS, scores of 3 are mapped to 2, and scores of 7–9 are mapped to 0 before summation. In addition to meeting all subtotal thresholds, onset of the disorder must have been evident by 36 months of age. Separate cutoff scores exist for verbal and non-verbal subjects.
ADI-R data used in Wall et al. (2012b)
The AGRE ADI-R data was exclusively used for training in Wall et al. (2012b), however, the authors made a key decision to use the “Affected Status” diagnosis from AGRE rather than an ADI-R diagnosis. The ADI-R does not have validated algorithms for the broad autism spectrum, and thus only contains Autism and Non-Autism diagnoses. The “Affected Status” diagnosis (AGRE Pedigree Algorithms, 2013) is meant to categorize subjects based solely on the ADI-R, although these are not diagnoses “per se”; additional categories are Not Quite Autism (NQA) and Broad Spectrum (BS). AGRE states that NQA represents individuals who narrowly missed reaching ADI-R Autism criteria, and BS defines individuals who “show patterns of impairment along the spectrum of pervasive developmental disorders.” An additional class, Not-Met (NM), is reserved for individuals who do not meet any of the potential cutoffs for spectrum behavior. Affected Status diagnoses of NQA, BS, and NM compose the ADI-R Non-Autism category. The data distribution according to Affected Status diagnosis was: 891 Autism subjects (M= 8.1 yr., SD = 4.4 yr.) and 75 Not-Met subjects (M = 9.2 yr., SD = 5.5 yr.).
Critical analysis of Wall et al. (2012b) ADI-R experiments
This study sought to shorten the ADI-R diagnostic instrument through classification with ADI-R items, wherein the selected classifier ideally learns a sparse transformation (using a reduced set of items) from the ADI-R items to the ADI-R diagnosis (Autism vs. Non-Autism) – or more exactly, “Affected Status” diagnoses of Autism vs. Not-Met. This experimental setup parallels that of Wall et al. (2012a) that used the ADOS, with one major distinction: certain ADI-R items are independently score-able, and thus administration may be reducible, a point we will return to at the end of our critique.
Wall et al. (2012b) used the AGRE dataset, which consists primarily of children on the autism spectrum. Although the ADI-R diagnosis contains two categories, the authors used AGRE’s “Affected Status.” Again, Affected Status is a 4-category decision based on the ADI-R, created as an ancillary severity measure for the AGRE corpus. Affected Status divides ADI-R Non-Autism diagnosis into three sub-categories. Wall et al. (2012b) chose to exclude the two middle severity categories (NQA and BS) – thus, like Wall et al. (2012a), comparing only the least and most severe cases. The authors used 15 tree-based classifiers in the Weka toolkit (Hall et al., 2009), finding the ADTree to perform best. They found that only seven items were needed for a classifier to produce 100% recall (sensitivity) classifying children with Autism, 98.7% recall (specificity) in detecting Not-Met cases, and 99.9% accuracy (there were more Autism instances). The algorithm was tested on two other databases (Simons Simplex Collection and Boston Autism Consortium) that had a combined 1,976 Autism instances and 17 Not-Met instances, resulting in high sensitivity (99.7%) but low specificity (53%). Specifically, Wall et al. (2012b) reported that when classifying 17 ADI-R Non-Autism test subjects, 8 were incorrect (i.e., they also received ADOS Autism Spectrum diagnoses). While the reported results may seem impressive, similar conceptual and methodological issues present in Wall et al. (2012a) exist in this study that bring into question the validity and reliability of the associated claims.
Conceptual problems of Wall et al. (2012b) study
Two primary conceptual issues are present in this study. First, as mentioned before, the investigators excluded the important middle-severity class, leaving only subjects with high or low severity ASD symptoms according to the ADI-R; thus, classification with ADI-R codes becomes much simpler. We believe that inclusion of the middle severity categories will severely and negatively impact performance of this automated classifier, since those classes are the easiest to confuse when estimating diagnoses from ADI-R codes. Second, like Wall et al. (2012a), this study predicted ADI-R diagnosis rather than BCE. As previously stated, unless the machine learning diagnosis exactly matches ADI-R diagnosis, error in classifying ADI-R diagnosis will create further error in final diagnosis (decreasing the validity of the ADI-R).
Methodological problems of Wall et al. (2012b) study
We identified three primary methodological problems with this study. First, the results did not demonstrate generalizability between the datasets tested. Out of the 17 Not-Met subjects in the test set, only 9 (53%) were identified correctly, which is effectively chance performance. Additionally, the authors did not validate the algorithm on adequate data. That is, the validation (test) data contained only 17 Not-Met instances, which is less than 1% of the entire test data. This number is too small to reliably assess performance. A second methodological issue is that of simulating “test” samples using cases from the training data. As we asserted for the Wall et al. (2012a) experiment, simulating the minority class (Not-Met) using the training data does not produce an independent test set, bringing into question the validity of the recall reported on the simulated samples.
Third, the authors did not evaluate feature reliability via data subsampling (e.g., bootstrapping). Wall et al. (2012b) reported that the ADTree classifier, when training on the whole AGRE data, utilized seven items. However, the algorithm could have selected other codes in each cross-validation fold. The authors could have shown reliability of those reported seven items within their data by presenting (i) the percentage of time the codes were selected within subsamples of the data, and/or (ii) accuracy when the algorithm was limited to only those seven items in each cross-validation fold. Lastly, returning to the previous point about the ADI-R being a good candidate measure for machine learning item reduction, it is surprising that Wall et al. (2012b) did not administer the ADI-R with only a reduced set of questions and test whether the shorter version produced the same results as the full set of questions.
Methods
In addition to highlighting conceptual and methodological concerns across these two studies, we conducted, and hence report on, a set of experiments that attempt to reproduce the findings of Wall et al. (2012a) and Wall et al. (2012b) using larger and more balanced datasets. These experiments provide empirical support for certain assertions in the preceding critiques. In the following, we provide details about the experimental data used in our experiments and specify better-practice technical approaches for evaluating machine learning techniques.
Details of Diagnostic Data Used in Our Experiments
The experiments we conducted used subsets of two corpora containing ADOS and ADI-R administration scores. The first corpus is AGRE, similar to Wall et al. (2012a, 2012b); however, our subset is larger (984 vs. 623 sessions) since it was downloaded at a later date. The second corpus, which we will refer to as Balanced Independent Dataset (BID), is a combined research and clinical dataset, part of which was utilized in experiments supporting the initial generation of the ADOS and ADI-R algorithms (Gotham et al., 2007; Lord et al., 2000).
There are two major differences between the corpora we used and those used by Wall et al. (2012a, 2012b). First, the AGRE data is much more biased towards ASD subjects than the BID data. That is, there are very few non-ASD samples in the AGRE data, while the BID data is better balanced (details below). Since confidence in recall for a class with a small number of samples is low, regardless of the overall size of the data set, this more balanced dataset is preferable for machine learning experiments. Second, the BID data contains BCE, including categories of Typically-Developing (TD), Autism, Non-Autism ASD, and Non-ASD Developmental Disorder. BCE diagnosis was used to validate the ADOS and ADI-R algorithms, and thus is a useful (and arguably the more valid) target variable for machine learning experiments. Conversely, AGRE contains no explicit BCE diagnosis. However, we do not present any experiments targeting BCE in this article.
ADOS Data Used in Our Experiments
Our ADOS experiments are conducted individually on ADOS Module 1 administrations from AGRE data and BID data (additional information is provided in Appendix A1). We downloaded the AGRE data on April 6th, 2013 and applied the same exclusion criteria as Wall et al. (2012a). Our AGRE subset contained 984 subjects: 942 Autism (M = 6.8 yr., SD = 3.1 yr.), 30 Autism Spectrum (M = 5.6 yr., SD = 3.9 yr.), and 12 Non-Spectrum (M = 4.8 yr., SD = 3.1 yr.). The BID Module 1 data subset contained 1,033 subjects: 858 Autism (M = 5.2 yr., SD = 3.6 yr.), 73 Autism Spectrum (M = 3.9 yr., SD = 2.4 yr.), and 102 Non-Spectrum (M = 3.4 yr., SD = 2.0 yr.). Importantly, the BID data is more representative of the minority classes (i.e., the AGRE data had only 12 Non-Spectrum subjects compared to 102 in the BID data).
ADI-R Data Used in Our Experiments
Our ADI-R experiments are conducted on the AGRE ADI-R data downloaded on April 6th, 2013 as well as the BID ADI-R data (additional information is provided in Appendix A2). Our download of the AGRE data contained 1,169 subjects: 1,027 Autism (M = 8.9 yr., SD = 3.0 yr.), 19 NQA (M = 10.2 yr., SD = 3.0 yr.), 42 BS (M = 9.4 yr., SD = 3.5 yr.), and 81 Not-Met (M = 9.4 yr., SD = 3.1 yr.) – thus a total of 142 ADI-R Non-Autism subjects. In our experiments, we combine the latter three categories back into the original ADI-R Non-Autism diagnosis for reasons we will detail later. The BID data was more balanced, containing 680 subjects in the following categories: 462 Autism (M = 9.2 yr., SD = 3.1 yr.) and 218 Non-Autism (M = 9.4 yr., SD = 2.9 yr.). Following the procedure of Wall et al. (2012b), we exclude certain ADI-R items for classification that, for example, were scored more-often-than-not with an exception code or had hand-written answers; and we only include subjects in the age range of 5–17 years.
Technical Approach
In the following we describe the classification methodology and performance metrics employed in our experiments.
Classification Methodology
The classification experiments in Wall et al. (2012a) and Wall et al. (2012b) utilized a number of machine learning techniques7 and found that a common tree-based classifier, ADTree, performed best. Therefore, we focus our experiments on ADTree to make more direct comparisons between their findings and ours. Generally speaking, a classifier takes as input a set of features (e.g., ADOS code scores) and learns a mapping to an output (e.g., ADOS diagnosis). The ADTree classifier learns a set of rules (decisions based on feature values) from which a prediction is made, but the tree’s structure need not incorporate all features (i.e., ADOS code scores) available as input. Since the ADTree classifier does not necessarily use all features, it can be considered to perform feature selection (or reduction of the feature set). This is the approach used by Wall et al. (2012a).
In our experiments, we limit the available input features to the ADTree algorithm. For example, Wall et al. (2012a) asserted that only eight codes were needed for replication of the ADOS algorithm, so we also limit the ADTree to use only those eight codes as features. Since we are performing multiple experiments that were not conducted in Wall et al. (2012a), we cannot copy the exact tree structure and feature weights. Further, that tree was trained using the entire AGRE dataset, and we are only testing on a portion of that data. As such, we re-train the ADTree (building a new tree structure and assigning new feature weights) within each training layer of cross-validation (detailed below), but only allow the algorithm to select certain features. This retraining framework allows the proposed approach a better chance of succeeding since it is being re-configured to the characteristics of a new database. We also perform an experiment with the remaining 21 codes. Some readers may be concerned that this is an unfair comparison to the proposed eight codes since there are more degrees of freedom. However, we argue that this is not a serious concern because: (i) we use cross-validation, which is intended to prevent over-fitting; (ii) not all codes in the ADOS are equally informative of ADOS diagnosis; and (iii) most importantly, the conclusion from Wall et al. (2012a) is that the proposed eight codes can sufficiently explain the ADOS, having removed redundant information. Thus, the remaining 21 codes provide insight into the information available in the “redundant” code set.
In order to test an algorithm’s classification performance on unseen data, a method known as cross-validation (CV; Kohavi, 1995) is used. In k-fold CV, the data is partitioned into k-subsets. A portion of the data is reserved for testing (prediction) and the remaining data is used for training the model. The testing data is alternated (k times) until all data have been predicted. Wall et al. (2012a) and Wall et al. (2012b) used 10-fold CV (90% train/10% test), so we also used 10-fold CV in our experiments. The major assumption in CV is that the data samples used for training and for testing are independent. Thus, we exclude multiple evaluations from the same observation (e.g., ADOS administration) in order to reduce dependence between data folds.
Classification Performance Metric
Accuracy (percentage correct) is a poor performance metric when the distribution of samples among classes is unbalanced since it emphasizes the majority class. Take, for example, a classification between two groups, A (positive) and B (negative), where Group A accounts for 90% of the data. If a one-rule classifier is constructed that always selects the majority class (A), the accuracy becomes 90%, while the recall of classes A and B become 100% and 0%, respectively. A common technique to address this issue is to simultaneously observe measures like sensitivity (e.g., Group A recall) and specificity (e.g., class B recall); but a machine learning algorithm can optimize sensitivity and specificity simultaneously. In our experiments we use a measure called unweighted average recall (UAR; Schuller et al., 2009), which is the mean of sensitivity (recall of positive instances) and specificity (recall of negative instances)8. We prefer UAR to accuracy – which was used in Wall et al. (2012a, 2012b) – as a classification metric because it equally weights each class regardless of number of subjects that populate them, and has become a preferred metric in modern machine learning tasks with unbalanced data (Schuller et al., 2009, 2011). Baseline (chance) UAR is 1/N, where N is the number of classes. In our pedagogical example above, UAR is only 50%, which is chance performance. Appendix A3 contains additional information on statistical testing with UAR for the interested reader.
Readers may also be curious why statistical measures such as true positive rate, false positive rate, sensitivity, and specificity are not analyzed simultaneously. This is due to several factors that jointly support analyzing UAR. First, a machine learning algorithm must optimize a single objective function. This means we should optimize for a single metric (e.g., UAR or accuracy) or some combination of measures (in the form of a linear or non-linear equation). Second, analyses should primarily focus on the measure being optimized. More specifically, since our experiments effectively optimize UAR, no explicit constraints are placed on sensitivity and specificity. An optimal solution with respect to UAR may result in unbalanced sensitivity vs. specificity; however, this may be a random realization of possible models that achieve this UAR since the algorithm is only concerned with optimizing UAR. Therefore, it is not meaningful to perform independent statistical tests on other measures when optimizing for UAR. Finally, UAR is a good first indicator of the information captured by a modeling approach, wherein further experiments could be conducted depending on a researcher’s goals. For example, if a researcher wants to place more emphasis on sensitivity than specificity, the objective function can be modified as such. Nevertheless, these measures are included (along with additional discussion on their suitability for interpretation) in Appendix C.
Results
Our critical analyses of the methods and results reported in Wall et al. (2012a) and Wall et al. (2012b) reveal serious conceptual and methodological implementation issues that call into question the reliability and validity of their claims. As empirical support for our critiques, we performed a set of experiments attempting to classify ASD diagnosis using ADOS and ADI-R item scores. In the following, we describe our experiments with the ADOS and ADI-R along with results we believe to be more valid.
Our Experimental Results with ADOS Data
The experiments in this section are conducted with ADOS data in order to support our critique of Wall et al. (2012a), wherein we replicate those experiments with a larger and more balanced dataset.
Replicated experiments with ADOS Data
Based on the results of Wall et al. (2012a), we targeted the following question to guide our first experiment: Are the proposed eight codes reproducible (i.e., selected) in a larger and more balanced data set that includes the Autism Spectrum class? Through performing classification with the ADTree classifier in various data subsets, we look at the features (codes) selected by the ADTree classifier. The results (presented in Table 1) indicate that the proposed eight codes are not, in fact, unique. In particular, even our attempt at replication with the (updated) AGRE data produced very distinct results from the proposed eight codes: only 5 of the 9 selected codes in our replication (from the full 29) overlap. This finding raises concerns about designing a simplified and generalizable instrument based on a smaller set of derived codes. Additionally, little overlap was observed when we included the (previously excluded) ADOS Autism Spectrum class in the ASD group and when evaluating in the BID data. The fact that the selected codes changed considerably with even minor variations in the data suggests that there is important information in the remaining 21 codes and that the proposed eight codes do not generalize.
Table 1.
Codes used in calculating/predicting ADOS diagnosis, including: the proposed 8 codes of Wall et al. (2012a), the original and revised ADOS algorithms, and our replication with the ADTree classifier. The highlighted columns correspond to Wall’s proposed 8 codes. Code descriptions are provided in Appendix B.*
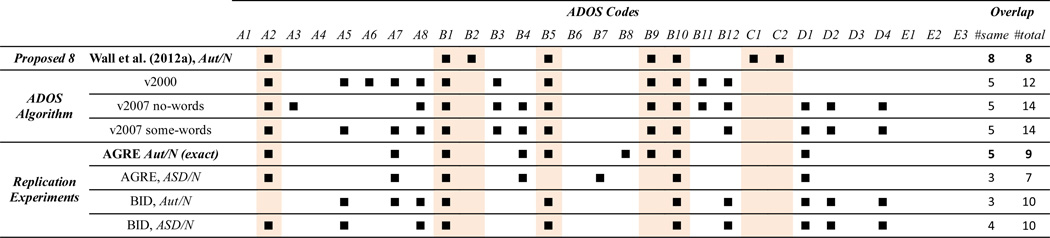 |
Diagnoses: Aut – ADOS Autism; ASD – ADOS Autism Spectrum or Autism; N – ADOS Non-Spectrum. ADOS Code Groups: A – Language and Communication; B – Social Reciprocity; C – Play; D – Restricted and Repetitive Behaviors. Note: AGRE Aut/N primarily differs from the experiment that produced the proposed 8 due to a difference in AGRE data download date.
To evaluate the information contained in the proposed eight codes more directly, we carried out classification experiments with cross-validation as in Wall et al. (2012a). Results are displayed in Figure 3. We find classification performance is 87% UAR when attempting replication (ADOS Aut/Non-ASD classification in the AGRE data with the ADTree classifier, while limiting the feature set to the proposed eight codes), which is low compared to the reported 100% accuracy (and thus 100% UAR) by Wall et al. (2012a). Additionally, the remaining 21 codes produce 95% UAR, and all 29 codes produce 96% UAR. Pair-wise statistical significance is difficult to achieve due to the small size of the ADOS Non-ASD class in AGRE and ceiling effects. Since the only difference between these two experiments appears to be minor data variation (our AGRE dataset is larger since it was downloaded at a later date and we exclude the four Non-Spectrum subjects from the Boston Autism Consortium database), these results suggest the findings in Wall et al. (2012a) are not reproducible.
Figure 3.

Replicated experiments with ADOS codes: binary classification performance (UAR; (sensitivity + specificity)/2) for various subsets of ADOS codes. Note that the ADOS algorithm achieves 100% UAR on this task by definition. Also note that statistical significance in the AGRE data requires a relatively large effect size due to the small size of the ADOS Non-ASD class. Diagnoses Aut – ADOS Autism; ASD – ADOS Autism Spectrum or Autism; N – ADOS Non-Spectrum. Feature sets: All 29 – all 29 ADOS Module 1 codes. Proposed 8 – only the 8 codes proposed in Wall et al. (2012a); Remaining 21 –uses the other 21 of 29 codes only. Significance levels: † (p<0.10); * (p<0.05); and ** (p<0.01).
Higher statistical confidence is obtained for the following results with the more balanced BID dataset. Performance of the proposed eight codes is 94% UAR, while the remaining 21 and all 29 produce 95% UAR and 99% UAR, respectively. In this case, the performance of all 29 codes is significantly higher than the proposed eight codes (p<0.05). Thus, it is clear that some independent information exists in the remaining 21 codes and that the proposed 8 do not robustly produce optimal performance across datasets. These findings point toward the power of redundancy in the ADOS coding system. Redundancy is a core design component of well-designed, reliable, and valid psychometric instruments, and has allowed the ADOS algorithm to be refined since its initial development. Further, the most differentiating features vary with developmental age and other behavioral attributes. Given the heterogeneous symptomatic display in ASD, these "lessor" features, so to speak, are likely needed to fully characterize the spectrum.
Perhaps even more critical is the issue of excluding the central ADOS Autism Spectrum class, which we suggest leads to inflated accuracies and is of little value since it does not reflect real-world clinical conditions. We validated this claim by examining the performance of this approach when including the more subtle and ambiguous ADOS Autism Spectrum samples, joining them with the ADOS Autism samples to form a new ASD group (following DSM-V standards). We observe that two-class classification performance drops significantly. The pronounced drop when selecting from all 29 codes is 14% UAR (96% to 82%; p=0.19) in the AGRE data, and 9% UAR (99% to 90%; p<0.01) in the BID data. The drop when selecting from the proposed 8 codes in the BID data is 11% UAR (94% to 83%; p<0.01). Such large drops confirm that excluding the middle class makes the approach by Wall et al. (2012a) a significantly easier task than if it were included. Lastly, in the BID data the full 29 code set significantly outperformed the proposed 8 in the ASD/Non-ASD task, yielding 90% UAR compared to 83% UAR (p<0.05).
Discussion of our experiments with ADOS Data
Taken together, our results indicate that the proposed eight codes do not produce replicable results and do not generalize across datasets in terms of code selection or classification performance. It should also be noted that given a large enough dataset, only the ADOS algorithm would achieve perfect accuracy at this task. Additionally, the critical middle severity class is shown to be more confusable, yet it was ignored in Wall et al. (2012a). The best classification performance of ASD/Non-ASD classes in BID used all 29 codes and produced 90% UAR. It is also noteworthy that, by definition, the ADOS algorithm achieves 100% UAR in this task; so a classifier that only achieves 90% UAR compounds diagnostic error. Coupled with the fact that clinician administration and family participation time is not actually reduced with the approach proposed by Wall et al. (2012a), this error in predicting ADOS diagnosis is without any benefit.
Our Experimental Results with ADI-R Data
In this section, we support our critique of Wall et al. (2012b) with experimental evidence through replicated experiments. We began this experiment by asking if the proposed seven ADI-R codes selected by Wall et al. (2012b) are reliable and optimal (generalizable) in terms of the accuracy they produce. Since our ADOS experiments demonstrated that the selected codes vary depending on the data used, we forgo those experiments with the ADI-R and instead examine classification performance (with UAR) using the ADTree classifier and 10-fold cross-validation.
As we suggested earlier, excluding more severely affected cases receiving an ADI-R Non-Autism diagnosis makes this classification problem much simpler. We validate this claim by examining performance when those with “Affected Status” classifications of NQA and BS are included in the analysis (see Table 2). In our replication experiment we find results similar to those reported by Wall et al. (2012b). In particular, using only those seven items and classifying with the two extreme categories, we reach 99% UAR in the AGRE data. However, we find that classification between “Affected Status” categories of Autism and the middle-severity categories of NQA and BS (together denoted B-ASD) leads to much lower UAR of 78% (p<0.01). Classification of the ADI-R two-class diagnosis (which includes the Not-Met group with the middle-severity categories) produces a significantly lower 89% UAR (p<0.01). These findings support our hypothesis that classification without the more-confusable, central diagnostic categories is much simpler.
Table 2.
UAR for classifying “Affected Status” and ADI-R categories using ADI-R items.*
| Items | Affected Status | AGRE | BID |
|---|---|---|---|
| All | Aut/N-M | 99 | |
| Aut/B-ASD+N-M | 88 | 87 | |
| Aut/B-ASD | 79 | ||
| Proposed 7 | Aut/N-M | 99 | |
| Aut/B-ASD+N-M | 89 | 80 | |
| Aut/B-ASD | 78 | ||
Diagnoses: Aut – ADI-R Autism; B-ASD – “Affected Status” categories of Not Quite Autism (NQA) and Broad Spectrum; Not-Met (N-M) – “Affected Status” Not-Met category. Note: B-ASD and Not-Met together comprise the ADI-R Non-Autism diagnosis.
Next we evaluate the predictive power of the proposed seven items versus all items. We observe no statistically significant differences in performance between the proposed items and the full item-set in the AGRE data (p>0.63). This could indicate that the proposed seven items captured much of the variance in the AGRE data (on which they were selected through training); however, they may not generalize to other data. When classifying ADI-R diagnosis in the BID data, performance is 80% UAR with the proposed seven items, which is significantly lower than the 87% UAR when including all items as features (p<0.01). Since the proposed seven items were significantly outperformed in this independent dataset (including the middle diagnostic categories), our hypothesis that the proposed seven items do not generalize is supported.
Discussion of our experiments with ADI Data
Our experiments provide empirical support that excluding the middle diagnostic category makes predicting ADI-R-based diagnosis from ADI-R codes a trivial task. These experiments also show that the seven codes (as inputs to the ADTree classifier) do not produce robust classification performance in an independent dataset. These findings highlight major shortcomings of the results and corresponding claims found in Wall et al. (2012b).
Discussion
Several lessons can be learned from a critical analysis of the results reported by Wall et al. (2012a, 2012b). These studies were a laudable attempt to simplify administration of a complex and time-intensive psychological diagnostic instrument using machine learning. However, these efforts underscore the importance of accounting for details at both conceptual and methodological levels when applying machine learning. The following suggestions are offered as general best-practice guidelines for translational studies at the intersection of computational science and behavioral science based on our failure to reproduce results from Wall et al. (2012a, 2012b) in larger and more balanced data sets.
First, it is essential for computational researchers to understand the underpinnings of the target domain they are working in. When engineering methods are developed in isolation and are applied in a new domain, there is great potential for errors in interpretation. For instance, knowledge about the psychometric design and implementation of the ADOS reveals that shortening its administration through reducing the number of codes in the algorithm is not a valid or feasible approach. Similarly, emerging machine learning methods should not be applied off-the-shelf by scientific and clinical researchers unless they are well-versed in the underlying assumptions that come with the algorithms. For instance, if a researcher does not take care in the manner in which they divide the data for cross-validation, classification performance can be artificially inflated. More specifically, if the same subject appears in both training and testing data, performance can increase dramatically due to dependence between samples.
Accounting for the concerns raised in this paper is an opportunity for fruitful education, training, and collaboration between clinical and computational researchers. In the age of interdisciplinary research, collaborative science needs researchers who have in-depth or at least significant working knowledge in multiple domains to both conduct and adequately peer-review reliable and valid science. Specifically, computer scientists working in autism should be well versed in the autism literature, and autism researchers using machine learning should be confident in their understanding of these methodologies. Cross-fertilization of this sort holds great potential for translational possibilities in ASD research.
Limitations
The data used in our experiments is limited because it does not equally represent certain sub-populations. Specifically, the AGRE data contains few Non-ASD subjects; and the BID data, while more balanced, is far more representative of the Autism category. An ideal database would contain thousands of samples from all diagnostic categories collected from independent clinical groups. Also, we did not test generalizability of performance across databases; but given that our assertions were supported within databases, this seemed unnecessary at this time.
Conclusions
Computational methodologies, including machine learning, are powerful tools for understanding data, but with their immense promise come potential pitfalls. Problem formulation and interpretation should be made in concert with researchers who are experts in the applied tools. This is a notable issue when conducting interdisciplinary research, where the researcher should be knowledgeable about all relevant aspects of a study in addition to possessing sufficient computational abilities. Specifically, issues in conceptual problem formation, methodological implementation, and interpretation are demonstrated in Wall et al. (2012a) and Wall et al. (2012b). In both cases, while the analytics offer tantalizing conclusions, we demonstrated empirically using larger and more balanced datasets that the authors’ claims of reducing diagnostic times while maintaining accuracy are not reproducible.
In the future, we will consider more complex computational methodologies to study multiple-annotation, multiple-code, and multiple-instrument fusion, as well as methods for longitudinal tracking of coded behavior (Audhkhasi & Narayanan, 2013). We also wish to harness advances in Behavioral Signal Processing (BSP) methodologies (e.g., Black et al., 2013; Bone et al., 2012, 2013, 2014-in-press; Narayanan & Georgiou, 2013) to create objective dimensional behavior ratings of autistic symptomatology. BSP pursues methods to quantify qualitatively-characterized behavioral constructs based on low-level observed behavioral cues, contributing to the emerging broad realm of Computational Behavioral Science (CBS; Rehg et al, 2013; Rehg, Rozga, Abowd, & Goodwin, 2014). Unlike the application of machine learning to already-coded behavioral data, this approach has the potential to augment human knowledge with objective descriptors from time-synchronized video, audio, physiological, and physical activity data capture.
Autism nosology, although investigated for 70 years, is at a critical moment in which the field requires more detailed characterization of core ASD components (social-communication, restricted/repetitive behaviors) for clinical reasons (e.g., personalized intervention) and neurobiological reasons (i.e., support finding neurobiological etiology). Researchers will need efficient, reliable, and valid quantitative, dimensional measures that can help stratify the disorder (Lord & Jones, 2012). Lai et al. (2013) generated a list of desired behavioral specifiers toward identification of subgroups in autism, offering one potential direction for bringing computational methods to bear. Collaboration between computational and behavioral scientists holds immense potential for advancing knowledge of the highly complex condition of ASD, and in so doing underscores the importance of conducting research that attains the highest standards of quality, reliability, and validity.
Acknowledgements
This work was supported by funds from NSF Award 1029035, “Computational Behavioral Science: Modeling, Analysis, and Visualization of Social and Communicative Behavior” and NIH grant P50 DC013027. The authors are grateful to Shanping Qiu for her efforts in acquiring and preparing the BID data for analysis.
Appendix A. Additional Methodological Details
A1: Additional Methodological Details for ADOS Module 1 Data Experiments
The AGRE and BID ADOS Module 1 data demographics are provided in Table A1 for the experiments shown in Table 1 and Figure 3. For the BID data, BCE diagnosis is also available, although we do not utilize it in this paper.
Table A.
Combined table of demographic information for experiments. Table A1. ADOS Module 1 data (AGRE and BID) for experiments in Table 1 and Figure 3.* Table A2. ADI-R Data (AGRE and BID) for experiments in Table 2.*
| A1. ADOS Mod. 1 | A2. ADI-R | |||
|---|---|---|---|---|
| AGRE | BID | AGRE | BID | |
| # Sessions | 984 | 1033 | 1169 | 680 |
| Mean Age (years) | 6.76 | 4.95 | 9.01 | 9.24 |
| Stdv. Age (years) | 3.11 | 3.45 | 3.02 | 3.01 |
| Fraction Female | 0.22 | 0.23 | 0.23 | 0.24 |
| ADOS: Autism | 942 | 858 | - | - |
| ADOS: Autism Spectrum | 30 | 73 | - | - |
| ADOS: Below Cutoffs | 12 | 102 | - | - |
| ADI-R: Autism | - | - | 1027 | 462 |
| ADI-R: Non-Autism | - | - | 142 | 218 |
| AffS: Autism | - | - | 1027 | - |
| AffS: Not Quite Autism | - | - | 19 | - |
| AffS: Broad Spectrum | - | - | 42 | - |
| AffS: Not-Met | - | - | 81 | - |
| BCE: Autism | - | 780 | - | 362 |
| BCE: Non-Autism ASD | - | 96 | - | 146 |
| BCE: Non-ASD DD | - | 82 | - | 165 |
| BCE: TD | - | 22 | - | 2 |
| BCE: missing | - | 53 | - | 5 |
AffS- AGRE “Affected Status”. BCE- best-estimate clinical diagnosis. DD- developmental disorder. TD- typical development
To replicate the Wall et al. (2012a) proposed 8-code selection as in Table 1, Weka’s ADTree classifier was used. In this case, the algorithm was allowed to tune itself to the given training data, but was limited to making rules using only the proposed 8 codes. Wall et al. (2012a) did not specify whether the code scores were first re-mapped as in the ADOS algorithm (e.g., 3 is mapped to 2). We chose to re-map because: (i) from the tree-diagram provided by Wall et al. (2012a) it appears the codes were re-mapped; and (ii) codes were re-mapped first in similar experiments by Wall et al. (2012b). Additionally, we noticed the selected codes did not match the proposed 8 regardless of code re-mapping or not.
Classification performance of ADOS diagnosis with the ADTree was evaluated (Figure 3). 10-fold cross-validation was used. Three variations of input feature sets are considered. (i) All 29 – all 29 codes are included, as was done in Wall et al. (2012a). (ii) Proposed 8 – only the 8 codes proposed in Wall et al. (2012a) are input. (iii) Remaining 21 –the remaining 21 of 29 codes not in the Proposed 8 are used for classification.
The performance metric is unweighted average recall (UAR), the mean of sensitivity and specificity. Many machine learning algorithms optimize for accuracy – also known as weighted average recall (WAR), since it is a weighted summation of sensitivity and specificity, dependent on the class priors – or an approximation thereof. One option for directly optimizing UAR is to balance classes through upsampling or downsampling (Rosenberg, 2012). Since the ADOS Autism class was much larger than the ADOS Non-Spectrum class, the ADOS Autism class can be downsampled or the ADOS Non-Spectrum class can be upsampled to optimize for UAR. In our experiments, we chose the latter. Upsampling was performed by adding exact copies of samples from the minority class only within the training data subset, in order to keep training and testing data independent. While other statistical methods exist for upsampling, they rely on certain assumptions about the data. For example, when randomly sampling from individual code scores to generate the entire set of scores for a simulated instance, it is possible to generate a set of scores that is very unlikely or impossible to occur in the real-world. Rather than making such assumptions, we upsampled whole observed data instances from the training data.
Class imbalance is also observed for the ADOS ASD (ADOS Autism and ADOS Autism Spectrum) versus ADOS Non-Spectrum experiments. The ADOS Autism class has many more samples in the AGRE and BID data than the ADOS Autism Spectrum class. In order to show a representative effect from the middle, more-subtle ADOS Autism Spectrum class, the ADOS Autism class was first randomly downsampled during training to be equal in size to the ADOS Autism Spectrum class. Then, the ADOS Non-Spectrum class was upsampled to be the same size as the new ADOS ASD class (as was done previously in the Autism/Non-Spectrum) experiments.
A2: Additional Methodological Details for ADI-R Data Experiments
Data demographics for the ADI-R experiments are provided in Table A2. Code remapping was performed as in Wall et al. (2012b); in particular, 3 was mapped to 2, and 7 and 8 were mapped to 0 (except for the Onset Age in Hindsight item, which has acceptable values from 0–6). 10-fold cross-validation was performed. The upsampling and downsampling for ADI-R diagnosis experiments mirrors those for ADOS diagnosis experiments described in Section A1. In particular, when performing classification with 2-groups, the minority class was upsampled. For the case of Affected Status, categories of Not Quite Autism (NQA) and Broad Spectrum (BS) were first combined into a Broad-ASD (B-ASD) category; the Affected Status category was slightly larger, so it was downsampled to the size of the B-ASD category; then, the minority ADI-R Non-Autism (B-ASD + Not-Met) class was upsampled to be of equal size to the ADI-R Autism group during training.
A3: Significance Testing for Unweighted Average Recall
UAR is increasingly popular in the machine learning literature for tasks with unbalanced data in which the recall of all classes are equally important. However, no established technique exists for computing statistical significance. Some researchers have used the binomial proportions test, as is done with accuracy, although this is not entirely valid. Accuracy is a weighted average of individual class recalls, weighted by the corresponding class prior. UAR is an unweighted average of individual recalls. Statistical tests exist for accuracy, sensitivity, and specificity; but no established test yet exists for UAR.
We propose using a slightly modified version of the exact binomial proportion test – we use the exact test since the data are not always sufficiently large for a normal approximation. Since UAR is an unweighted average of individual recalls, it is equally influenced by the recall of either class. The recall of a class with very few samples (e.g., 12) can vary much more than recall of the majority class (e.g., 942); notably, the machine learning algorithm does not typically consider class-size when optimizing for UAR. As such, the minor modification we made was to reduce the sample size N from 954 (12 + 942) to something smaller – in particular, N_eff (effective N). We set N_eff to twice the size (since there are two classes) of the minority class. In our example, N_eff is consequently 24, compared to the original N of 954. The negative implication is that some of the statistical power from the confidence in recall of the majority class is discarded; but the benefit is that the statistical power in the minority-class recall is not grossly exaggerated. Thus, this test is conservative, and is less likely to create false-positives.
Appendix B. ADOS Module 1 Behavioral Codes
Table B1.
List of the ADOS Module 1 Behavioral Codes
| Code Category | Code Label | Code Title |
|---|---|---|
| Communication | A1 | Overall Level of Non-echoed Language |
| A2 | Frequency of Vocalization Directed to Others | |
| A3 | Intonation of Vocalizations and Verbalizations | |
| A4 | Immediate Echolalia | |
| A5 | Stereotyped/Idiosyncratic Use of Words or Phrases | |
| A6 | Use of Others’ Body to Communicate | |
| A7 | Pointing | |
| A8 | Gestures | |
| Reciprocal Social Interaction | B1 | Unusual Eye Contact |
| B2 | Responsive Social Smile | |
| B3 | Facial Expressions Directed To Others | |
| B4 | Integration of Gaze and Other Behaviors During Social Overtures | |
| B5 | Shared Enjoyment in Interaction | |
| B6 | Response to Name | |
| B7 | Requesting | |
| B8 | Giving | |
| B9 | Showing | |
| B10 | Spontaneous Initiation of Joint Attention | |
| B11 | Response to Joint Attention | |
| B12 | Quality of Social Overtures | |
| Play | C1 | Functional Play with Objects |
| C2 | Imagination/Creativity | |
| Stereotyped Behaviors and Restricted Interests | D1 | Unusual Sensory Interesting in Play Material/Person |
| D2 | Hand and Finger and Other Complex Mannerisms | |
| D3 | Self-Injurious Behavior | |
| D4 | Unusually Repetitive Interests or Stereotyped Behaviors | |
| Other Abnormal Behaviors | E1 | Overactivity |
| E2 | Tantrums, Aggression, Negative or Disruptive Behavior | |
| E3 | Anxiety | |
Appendix C. Additional Performance Measures
Here we present additional performance measures from our classification experiments with the following disclaimer: individual results should not be contrasted with metrics other than UAR, the mean of sensitivity and specificity, because the machine learning algorithms only optimizes for UAR in our experiments, and thus are not concerned with measures like sensitivity and specificity individually. That is, an algorithm is only concerned with reaching a peak in UAR. The other statistical measures may be viewed as a random realization that achieves the observed UAR; thus, comparison of, for example, sensitivity between individual results may be inappropriate.
We understand that analysis of each of these measures is standard in diagnostic research. However, our experimental results stand primarily as empirical support of certain methodological flaws present in the experiments of Wall et al. (2012a, 2012b); as such, we compare results using the measure that the machine learning algorithm optimizes, UAR (technically it optimizes accuracy, but it effectively optimizes UAR since we balance classes during training.) We also note that analyzing true diagnostic validity of this approach would be further complicated by the fact that the ADOS has its own diagnostic error.
The following tables present six measures: unweighted average recall (UAR); sensitivity; specificity; positive predictive value (PPV); negative predictive value (NPV); and accuracy. Expanded results for the ADOS (c.f., Figure 3) are presented in Table C1, while expanded results for the ADI-R (c.f., Table 2) are displayed in Table C2.
Table C1.
Results for classifying ADOS categories using ADOS items.*
| Data | Diagnosis | Items | UAR | Sens. | Spec. | PPV | NPV | Acc. |
|---|---|---|---|---|---|---|---|---|
| AGRE | Aut/N | All 29 | 96 | 99 | 92 | 100 | 65 | 99 |
| Proposed 8 | 87 | 99 | 75 | 100 | 47 | 99 | ||
| Remaining 21 | 95 | 98 | 92 | 100 | 41 | 98 | ||
| ASD/N | All 29 | 82 | 88 | 75 | 95 | 56 | 86 | |
| Proposed 8 | 82 | 82 | 83 | 96 | 48 | 82 | ||
| Remaining 21 | 83 | 80 | 86 | 96 | 50 | 81 | ||
| BID | Aut/N | All 29 | 99 | 99 | 98 | 100 | 93 | 99 |
| Proposed 8 | 94 | 96 | 91 | 99 | 73 | 96 | ||
| Remaining 21 | 95 | 97 | 92 | 99 | 79 | 97 | ||
| ASD/N | All 29 | 90 | 90 | 90 | 93 | 86 | 90 | |
| Proposed 8 | 83 | 81 | 84 | 88 | 75 | 82 | ||
| Remaining 21 | 87 | 88 | 87 | 91 | 83 | 88 | ||
Diagnoses; Aut – ADOS Autism; ASD – ADOS Autism Spectrum or Autism; N – ADOS Non-Spectrum. Feature sets: All 29 – all 29 ADOS Module 1 codes. Proposed 8 – only the 8 codes proposed in Wall et al. (2012a); Remaining 21 –uses the other 21 of 29 codes only.
Table C2.
Results for classifying “Affected Status” and ADI-R categories using ADI-R items.*
| Data | Items | Affected Status | UAR | Sens. | Spec. | PPV | NPV | Acc. |
|---|---|---|---|---|---|---|---|---|
| AGRE | All | Aut/N-M | 99 | 100 | 99 | 100 | 99 | 100 |
| Aut/B-ASD+N-M | 88 | 94 | 83 | 98 | 62 | 93 | ||
| Aut/B-ASD | 79 | 90 | 69 | 98 | 29 | 89 | ||
| Proposed 7 | Aut/N-M | 99 | 100 | 99 | 100 | 94 | 99 | |
| Aut/B-ASD+N-M | 89 | 94 | 84 | 98 | 63 | 93 | ||
| Aut/B-ASD | 78 | 88 | 67 | 98 | 25 | 87 | ||
| BID | All | Aut/B-ASD+N-M | 87 | 84 | 90 | 79 | 92 | 88 |
| Proposed 7 | Aut/B-ASD+N-M | 80 | 68 | 93 | 82 | 86 | 85 | |
Diagnoses; Aut – ADI-R Autism; B-ASD – “Affected Status” categories of Not Quite Autism (NQA) and Broad Spectrum; Not-Met (N-M) – “Affected Status” Not-Met category. Note; B-ASD and Not-Met together comprise the ADI-R Non-Autism diagnosis.
Footnotes
For instance, model over-fitting can occur when training data is included in testing sets, which can inflate confidence in a result that is not likely to replicate in independent samples. Cross-validation is a common solution.
The work of Wall et al. (2012a) has been extended in Duda et al. (2014). While some methodological issues are resolved, primary conceptual issues remain.
Analyses we conducted in this paper use these revised ADOS algorithms.
Apart from 4 Non-Spectrum subjects from the Boston Autism Consortium database.
Proper application of machine learning usually entails optimizing parameter settings for a chosen classifier. The peak performance of a classifier for a given dataset cannot be achieved without this step. Since optimizing parameter settings for maximal classification performance can lead to over-fitting, an independent test set is required; often a third set called the Development set is used or another layer of cross-validation is performed. In our experiments, we use default parameter settings in order to most closely replicate the methodology employed by Wall et al. (2012a).
Recall can be used interchangeably with either sensitivity or specificity, which differ only in naming convention of the “true” class.
It is advisable to test multiple algorithmic approaches to achieve optimal accuracy; however, since this increases potential for over-fitting and consequently inflating results, an independent, held-out dataset is valuable.
Note that sensitivity and specificity only differ in the naming convention of the “true” or “positive” class, and thus the term recall applies to any class.
References
- 1.Abrahams BS, Geschwind DH. Connecting genes to brain in the autism spectrum disorders. Archives of neurology. 2010;67(4):395. doi: 10.1001/archneurol.2010.47. [DOI] [PMC free article] [PubMed] [Google Scholar]
- 2.AGRE Pedigree Algorithms. AGRE Pedigree Algorithms. 2013 Nov 27; N.p., n.d. Web. <http://research.agre.org/agrecatalog/algorithm.cfm>.
- 3.Amaral D, Dawson G, Geschwind D, editors. Autism spectrum disorders. Oxford University Press; 2011. [Google Scholar]
- 4.American Psychiatric Association. Diagnostic and statistical manual of mental disorders: DSM-5. American Psychiatric Association; 2013. [Google Scholar]
- 5.Audhkhasi K, Narayanan S. A globally-variant locally-constant model for fusion of labels from multiple diverse experts without using reference labels. IEEE Transactions on Pattern Analysis and Machine Intelligence. 2013;35(4):769–783. doi: 10.1109/TPAMI.2012.139. [DOI] [PubMed] [Google Scholar]
- 6.Baldi P. Bioinformatics: the machine learning approach. The MIT Press; 2001. [Google Scholar]
- 7.Black MP, Katsamanis A, Baucom BR, Lee CC, Lammert AC, Christensen A, Georgiou PG, Narayanan SS. Toward automating a human behavioral coding system for married couples’ interactions using speech acoustic features. Speech Communication. 2013;55(1):1–21. [Google Scholar]
- 8.Bone D, Black MP, Lee CC, Williams ME, Levitt P, Lee S, Narayanan S. Spontaneous-Speech Acoustic-Prosodic Features of Children with Autism and the Interacting Psychologist. INTERSPEECH. 2012:1043–1046. [Google Scholar]
- 9.Bone D, Lee CC, Chaspari T, Black MP, Williams ME, Lee S, Levitt P, Narayanan S. Acoustic-Prosodic, Turn-taking, and Language Cues in Child-Psychologist Interactions for Varying Social Demand. INTERSPEECH. 2013:2400–2404. [Google Scholar]
- 10.Bone D, Black MP, Lee CC, Williams ME, Levitt P, Lee S, Narayanan S. The Psychologist as an Interlocutor in Autism Spectrum Disorder Assessment: Insights from a Study of Spontaneous Prosody. Journal of Speech, Language, and Hearing Research. 2014 doi: 10.1044/2014_JSLHR-S-13-0062. in press. [DOI] [PMC free article] [PubMed] [Google Scholar]
- 11.Chaspari T, Bone D, Gibson J, Lee CC, Narayanan S. Using physiology and language cues for modeling verbal response latencies of children with ASD. Acoustics, Speech and Signal Processing (ICASSP), 2013 IEEE International Conference on. 2013:3702–3706. [Google Scholar]
- 12.Constantino JN, LaVesser PD, Zhang Y, Abbacchi AM, Gray T, Todd RD. Rapid quantitative assessment of autistic social impairment by classroom teachers. Journal of the American Academy of Child & Adolescent Psychiatry. 2007;46(12):1668–1676. doi: 10.1097/chi.0b013e318157cb23. [DOI] [PubMed] [Google Scholar]
- 13.Dawson G, Webb S, Schellenberg GD, Dager S, Friedman S, Aylward E, Richards T. Defining the broader phenotype of autism: Genetic, brain, and behavioral perspectives. Development and psychopathology. 2002;14(3):581–611. doi: 10.1017/s0954579402003103. [DOI] [PubMed] [Google Scholar]
- 14.Duda M, Kosmicki JA, Wall DP. Testing the accuracy of an observation-based classifier for rapid detection of autism risk. Translational psychiatry. 2014;4(8):e424. doi: 10.1038/tp.2014.65. [DOI] [PMC free article] [PubMed] [Google Scholar]
- 15.Freund Y, Mason L. The Alternating Decision Tree Learning Algorithm. ICML. 1999 Jun;99:124–133. [Google Scholar]
- 16.Geschwind DH, Sowinski J, Lord C, Iversen P, Shestack J, Jones P, Ducat L, Spence SJ. The Autism Genetic Resource Exchange: A resource for the study of autism and related neuropsychiatric conditions. American journal of human genetics. 2001;69(2):463. doi: 10.1086/321292. [DOI] [PMC free article] [PubMed] [Google Scholar]
- 17.Gotham K, Risi S, Pickles A, Lord C. The Autism Diagnostic Observation Schedule: revised algorithms for improved diagnostic validity. Journal of autism and developmental disorders. 2007;37(4):613–627. doi: 10.1007/s10803-006-0280-1. [DOI] [PubMed] [Google Scholar]
- 18.Hall M, Frank E, Holmes G, Pfahringer B, Reutemann P, Witten IH. The WEKA data mining software: an update. ACM SIGKDD Explorations Newsletter. 2009;11(1):10–18. [Google Scholar]
- 19.Hu VW, Steinberg ME. Novel clustering of items from the Autism Diagnostic Interview–Revised to define phenotypes within autism spectrum disorders. Autism Research. 2009;2(2):67–77. doi: 10.1002/aur.72. [DOI] [PMC free article] [PubMed] [Google Scholar]
- 20.Kohavi R. A Study of Cross-Validation and Bootstrap for Accuracy Estimation and Model Selection. IJCAI. 1995 Aug;14(2):1137–1145. [Google Scholar]
- 21.Lai MC, Lombardo MV, Chakrabarti B, Baron-Cohen S. Subgrouping the Autism “Spectrum”: Reflections on DSM-5. PLoS Biology. 2013;11(4) doi: 10.1371/journal.pbio.1001544. [DOI] [PMC free article] [PubMed] [Google Scholar]
- 22.Lee H, Marvin AR, Watson T, Piggot J, Law JK, Law PA, Constantino JN, Nelson SF. Accuracy of phenotyping of autistic children based on internet implemented parent report. American Journal of Medical Genetics Part B: Neuropsychiatric Genetics. 2010;153(6):1119–1126. doi: 10.1002/ajmg.b.31103. [DOI] [PMC free article] [PubMed] [Google Scholar]
- 23.Levitt P, Campbell DB. The genetic and neurobiologic compass points toward common signaling dysfunctions in autism spectrum disorders. The Journal of clinical investigation. 2009;119(4):747. doi: 10.1172/JCI37934. [DOI] [PMC free article] [PubMed] [Google Scholar]
- 24.Lord C, Jones RM. Annual Research Review: Re–thinking the classification of autism spectrum disorders. Journal of Child Psychology and Psychiatry. 2012;53(5):490–509. doi: 10.1111/j.1469-7610.2012.02547.x. [DOI] [PMC free article] [PubMed] [Google Scholar]
- 25.Lord C, Risi S, Lambrecht L, Cook EH, Jr, Leventhal BL, DiLavore PC, Pickles A, Rutter M. The Autism Diagnostic Observation Schedule—Generic: A standard measure of social and communication deficits associated with the spectrum of autism. Journal of autism and developmental disorders. 2000;30(3):205–223. [PubMed] [Google Scholar]
- 26.Lord C, Rutter M, Le Couteur A. Autism Diagnostic Interview-Revised: a revised version of a diagnostic interview for caregivers of individuals with possible pervasive developmental disorders. Journal of autism and developmental disorders. 1994;24(5):659–685. doi: 10.1007/BF02172145. [DOI] [PubMed] [Google Scholar]
- 27.Narayanan S, Georgiou PG. Behavioral signal processing: Deriving human behavioral informatics from speech and language. Proceedings of the IEEE. 2013;101(5):1203–1233. doi: 10.1109/JPROC.2012.2236291. [DOI] [PMC free article] [PubMed] [Google Scholar]
- 28.Picard RW. Affective computing. MIT press; 2000. [Google Scholar]
- 29.Rehg JM, Abowd GD, Rozga A, Romero M, Clements MA, Sclaroff S, Ye Z. Computer Vision and Pattern Recognition (CVPR), 2013 IEEE Conference on. IEEE; Jun, 2013. Decoding children's social behavior; pp. 3414–3421. [Google Scholar]
- 30.Rehg JM, Rozga A, Abowd GD, Goodwin MS. Behavioral Imaging and Autism. Pervasive Computing, IEEE. 2014;13(2):84–87. [Google Scholar]
- 31.Rosenberg A. Classifying Skewed Data: Importance Weighting to Optimize Average Recall. INTERSPEECH. 2012:2242–2245. [Google Scholar]
- 32.Schuller B, Steidl S, Batliner A. The INTERSPEECH 2009 emotion challenge. INTERSPEECH. 2009 Sep;:312–315. [Google Scholar]
- 33.Schuller B, Steidl S, Batliner A, Schiel F, Krajewski J. The INTERSPEECH 2011 Speaker State Challenge. INTERSPEECH. 2011 Aug;:3201–3204. [Google Scholar]
- 34.Wall DP, Kosmicki JA, DeLuca T, Harstad EB, Fusaro VA. Use of Machine Learning to Shorten Observation-based Screening and Diagnosis of Autism. Translational Psychiatry. 2012a;2(4):e100. doi: 10.1038/tp.2012.10. [DOI] [PMC free article] [PubMed] [Google Scholar]
- 35.Wall DP, Dally R, Luyster R, Jung JY, DeLuca TF. Use of Artificial Intelligence to Shorten the Behavioral Diagnosis of Autism. PloS one. 2012b;7(8) doi: 10.1371/journal.pone.0043855. [DOI] [PMC free article] [PubMed] [Google Scholar]
- 36.Wei L, Yang Y, Nishikawa RM, Jiang Y. A study on several machine learning methods for classification of malignant and benign clustered microcalcifications. Medical Imaging, IEEE Transactions on. 2005;24(3):371–380. doi: 10.1109/tmi.2004.842457. [DOI] [PubMed] [Google Scholar]
- 37.Ye Z, Li Y, Fathi A, Han Y, Rozga A, Abowd GD, Rehg JM. Detecting eye contact using wearable eye-tracking glasses; Proceedings of the 2012 ACM Conference on Ubiquitous Computing; ACM; 2012. Sep, pp. 699–704. [Google Scholar]