

Abstract
OBJECTIVE
To identify patient factors and health care utilization patterns associated with dose escalation during the first year of long-term opioid therapy for chronic pain
DESIGN
Retrospective cohort study using electronic health record data
SETTING
University health system
SUBJECTS
Opioid naïve adults with musculoskeletal pain who received a new outpatient opioid prescription between July 1, 2011 and June 30, 2012 and stayed on opioids for one year
METHODS
Mixed-effects regression was used to estimate patients’ rate of opioid dose escalation. Demographics, clinical characteristics, and healthcare utilization for patients with and without dose escalation were compared.
RESULTS
Twenty-three (9%) of 246 patients in the final cohort experienced dose escalation (defined as an increase in mean daily opioid dose of ≥30 mg morphine equivalents over 1 year). Compared to patients without dose escalation, patients with escalation had higher rates of substance use diagnoses (17% versus 1%, P = 0.01) and more total outpatient encounters (51 versus 35, P = 0.002) over 1 year. Differences in outpatient encounters were largely due to more non face-to-face encounters (e.g., telephone calls, emails) among patients with dose escalation. Differences in age, race, concurrent benzodiazepine use, and mental health diagnoses between patients with and without dose escalation were not statistically significant. Primary care clinicians prescribed 89% of opioid prescriptions.
CONCLUSIONS
Dose escalation during the first year of long-term opioid therapy is associated with higher rates of substance use disorders and more frequent outpatient encounters, especially non face-to-face encounters.
Keywords: opioid analgesics, chronic pain, musculoskeletal pain, substance use disorders, dose escalation, health care utilization
INTRODUCTION
A substantial expansion in the prescription of long-term opioids to treat chronic pain over the past decade has coincided with a sharp increase in opioid-related overdoses and deaths. Deaths related to prescription opioids are now more common than deaths related to heroin and cocaine combined.(1–3) Evidence from several large observational studies indicates that patients prescribed high-dose opioids (defined as >100 mg morphine or equivalent (mgME) per day) are at significantly greater risk of opioid-related overdose or death compared to patients prescribed lower doses.(4–8) High-dose opioid use is also a risk factor for clinically significant opioid abuse or dependence.(9) Five to 10% of patients on long-term opioids are prescribed high-dose opioids; however, these patients account for more than half of the total morphine equivalents prescribed for chronic pain.(10, 11)
Opioid naïve patients generally cannot tolerate high-dose opioids without substantial side effects, so nearly all patients on high-dose opioids originally start on low doses and then escalate the amount consumed over time. Yet little is known about how opioid doses change during the first year of long-term opioid therapy or about the factors associated with these changes. Analyzing the rate of opioid dose escalation during the first year of long-term opioid use is a key step in understanding the development of high-dose opioid use. Identifying factors associated with dose escalation can help clinicians to identify at-risk patients and so work to prevent this phenomenon.
In this study, we analyzed data from the electronic health record of a large university health system to identify factors associated with dose escalation during the first year of long-term opioid therapy for chronic musculoskeletal pain. We characterized patients’ rate of dose escalation through analysis of outpatient prescriptions and then compared demographics, clinical characteristics, and healthcare utilization patterns for patients with and without dose escalation. We hypothesized that factors previously found to be associated with high-dose opioid use (i.e., younger age, white race, mental health or substance use diagnoses, concurrent use of benzodiazepines) would be associated with dose escalation,(10–12) and that patients with opioid dose escalation would have more office visits and total outpatient encounters during their first year of opioid therapy.(12, 13) We focused on outpatient prescriptions because the majority of long-term opioids are prescribed in this setting.(14) The study was approved by the University of California (UC) Davis Institutional Review Board.
METHODS
Cohort identification and data collection
We extracted data from the electronic health record of the UC Davis Health System, a university health system comprising multiple primary care and specialty clinics in northern California with >800,000 outpatient clinic visits annually.(15) The study cohort comprised all opioid naïve patients ≥18 years’ old with musculoskeletal pain who received a new opioid prescription between July 1, 2011 and June 30, 2012 and who stayed on opioids for one year. ICD-9 codes adapted from prior studies were used to identify patients with musculoskeletal pain.(16, 17) A complete list of ICD-9 codes is available online in Appendix 1. We did not include intravenous or liquid opioid formulations or opioid-decongestant combinations (e.g., phenylephrine-codeine) that are not typically used for outpatient treatment of chronic pain. We also excluded patients who had a primary outpatient diagnosis of cancer or palliative care.
For this study we defined opioid naïve as having no documented opioid prescription in the 1 year prior to starting long-term opioids. To restrict our study to opioid naïve patients, we identified each patient’s first or “incident” outpatient opioid prescription between July 1, 2011 and June 30, 2012 and then excluded patients who had any opioid prescriptions in the one year prior to that prescription. We abstracted opioid prescription data for one year following each included patient’s incident prescription. Figure 1 summarizes the process for cohort identification and data collection.
Figure 1. Cohort identification and data collection.
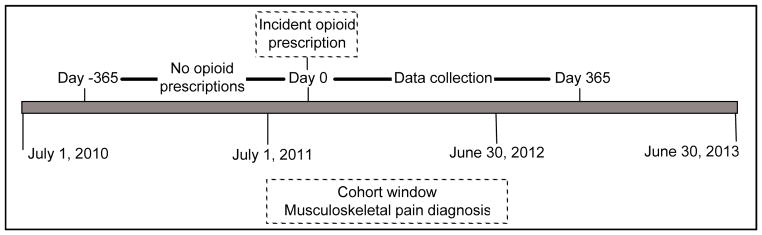
Patients in the current study were adult patients who had ≥1 outpatient opioid prescription and ≥1 ICD-9 code indicating musculoskeletal pain between July 1, 2011 and June 30, 2012. We excluded patients with any outpatient opioid prescriptions in the 1 year before their first or incident prescription in the cohort window. Data were collected for 1 year after the incident prescription. Our final cohort comprised patients with 1 opioid prescription in each quarter after their incident prescription. Dates were converted to days since each patient’s incident prescription.
One year of chronic opioid use was defined to include patients who received at least one opioid prescription in each of 4 calendar quarters after their incident prescription. The vast majority of long-term opioid prescriptions are for a 30-day supply and U.S. Drug Enforcement Administration (DEA) regulations do not permit prescriptions of Schedule II controlled substances for more than a 90-day supply.(18) Hence, patients on opioids for chronic pain should receive at least one prescription per quarter. This approach excluded patients who received single or intermittent opioid prescriptions for acute pain. To verify that patients were opioid naïve, the first author and a research assistant manually reviewed the electronic health records of all patients in our final cohort and excluded patients who had evidence of receiving outpatient opioid prescriptions (including prescriptions from outside the health system) within one year of their incident prescription.
In addition to detailed information on opioid prescriptions, the following data were abstracted from the electronic health record for the one-year period following each patient’s incident prescription: demographics, outpatient pain scores; detailed data about outpatient encounters (including ICD-9 codes); dates of emergency department visits and hospital admissions; whether the patient had any laboratory results for urine drug screens; and whether the patient received any benzodiazepine prescriptions. Calendar dates were converted into days since each patient’s incident prescription (range 0–365).
Calculating daily opioid dose
Patients’ average daily opioid dose for each quarter was determined by converting all opioids to morphine equivalents (mgME) using well-established conversion ratios,(19) calculating the total opioid dose prescribed during each quarter, and dividing this total by the number of days in each quarter (i.e., 91 or 92). This approach did not require assumptions about how long prescriptions were meant to last or how patients actually took medications.(20) Most prescriptions in our data were for Schedule III opioids and were prescribed to be taken “as needed;” therefore, prescription instructions were not useful for calculating patient’s daily opioid dose. For Schedule III opioid prescriptions that included refills, an assumption was made that patients consumed refills at 30-day intervals for up to 5 refills, the maximum allowed by DEA regulations.(18)
When patients had two similar opioid prescriptions on the same day, we reviewed the electronic health record to avoid counting duplicate prescriptions. Our study focused on outpatient prescriptions, so we omitted opioid prescriptions on dates that corresponded to a hospital admission or an emergency department visit. Emergency department prescriptions were excluded because most prescriptions from this setting had missing prescription data. Excluding these visits is unlikely to influence the results because emergency physicians typically prescribe very small quantities of opioids as a “bridge dose” until patients can see their regular physicians.(21)
Health care utilization variables
For each patient, the following was calculated: number of emergency department visits, hospital admissions and total outpatient encounters; number of encounters by type (i.e., office visits, nursing visits, telephone visits, refill requests, orders-only encounters, or patient email); and number of encounters and office visits at primary care clinics. To identify encounters at primary care clinics, two physicians independently classified all clinics in our data as either primary care or non-primary care. Disagreements were resolved by the first author.
Clinical variables
ICD-9 codes from the year after each patient’s incident prescription were used to generate binary indicator variables for several different medical conditions. We used the Agency for Healthcare Research and Quality single-level clinical classification scheme (22) as a starting point for developing a list of codes to define each condition except for low back pain (for which we used a list from a prior study (17)). Variables were generated for common pain diagnoses (headache, back pain, low back pain, neck pain, osteoarthritis, and abdominal pain), mental health diagnoses that have been reported to be associated with chronic pain and high-dose opioid use (mood disorder, anxiety disorder, substance use disorder, and any mental health disorder), and chronic medical conditions not thought to be associated with opioid dose escalation (hypertension, diabetes mellitus, and chronic obstructive pulmonary disease (COPD)/asthma). For example, a patient was considered to have a substance use disorder if any one of the 135 ICD-9 codes used to define substance use disorder was associated with any outpatient encounter during the 1 year after that patient’s incident opioid prescription. A complete list of the ICD-9 codes used to define each variable is available online in Appendix 2.
Prescriber variable
Prescribers in our data set were dichotomized as primary or non-primary care clinicians based on whether the majority of that clinician’s encounters took place in primary care or non-primary care clinics.
Statistical analysis
Mixed-effects regression analysis was used to model longitudinal change in patients’ opioid dose during the year after their incident prescription.(23) The dependent variable was daily opioid dose (measured in mgME) for each quarter. The model, which was fitted with SAS PROC Mixed (SAS/STAT version 9.3, Cary, NC), included fixed effects for time (measured in days since the incident prescription) and random effects for patient-specific initial dose (intercept) and rate of change (slope). This approach yields regression coefficients with clinically meaningful units and subject-specific estimates of rates of dose change that account for random variation more efficiently than rates using raw data.(24) Patients were divided into a “stable” group and an “escalating” group based on their estimated slopes, a classification method that has been used in other areas of healthcare research.(25) A slope equivalent to a total increase in daily opioid dose of 30 mgME over a 1-year period (i.e., a slope of 0.082 mgME per day per day) was selected as the cutoff value to separate the two groups because this cutoff represents a large relative increase based on the the initial doses recommended for opioid naïve patients. For example, the VA/Department of Defense and Canadian chronic pain guidelines recommend initial daily opioid dose ranges of 30–45 mgME and 20–60 mgME, respectively.(26, 27) An increase of 30 mgME, therefore, represents a 50–150% increase over these recommended initial daily doses. An increase of 30 mgME is also likely to be significant from an epidemiological perspective. For example, a prior study found that the mean daily opioid dose for opioid naive veterans during their first year of long-term opioid therapy was 26.4 mgME with a standard deviation of 22.1.(14)
After classifying patients, we compared the demographics, opioid prescription characteristics, health care utilization, and clinical characteristics between groups. We used the Wilcoxon two-sample test for continuous variables, which were typically not normally distributed, and Fisher’s exact test for categorical or dichotomous variables. Appropriate mixed-effects regression models for non-normal data, accounting for the nesting of prescriptions within patients, were used to compare opioid prescription characteristics. Finally, to evaluate whether primary care or non-primary care clinicians were more likely to prescribe opioids to patients in the escalating group, we performed a binomial regression with clinician type (primary care versus non-primary care) as the independent variable and the proportion of prescriptions for each clinician written to patients in the escalating group as the dependent variable.
Due to the small number of patients with dose escalation in our final sample, we did not carry out multivariable comparisons between the stable and escalating patient groups. In addition, we performed formal statistical tests only for those patient-level variables (mentioned in the introduction) for which we had a priori hypotheses based on prior literature. Holm’s step-down approach (28) was used to account for multiple comparisons between patient groups. This procedure is more powerful than the simple Bonferroni adjustment and guarantees to control the family-wise error rate under all types of dependence among P-values.
RESULTS
Using our selection algorithm, we identified 4,761 adult patients with at least one diagnosis associated with musculoskeletal pain, one opioid prescription between July 1, 2011 and June 30, 2012, and no opioid prescriptions in the year before the incident prescription. Of these patients, 388 had at least one opioid prescription in each of the four quarters following their incident prescriptions. After manual record review, 246 of these patients (63.4%) met our definition of opioid naïve. The majority of patients excluded during manual review were receiving opioid prescriptions from outside the university health system. The remaining analyses relate only to these 246 opioid naïve patients and the 2,942 opioid prescriptions they received.
Based on the results of our mixed-effects regression analysis, the mean estimated slope in our sample was 0.019 (SD 0.07, range −0.152 – 0.658). Twenty-three patients had a predicted total increase in daily opioid dose of ≥30 mgME over the 1-year period and so were included them in the “escalating” group. The remaining 223 patients comprised the “stable” group. Table 1 shows demographics for these groups. Compared to patients in the stable group, patients in the escalating group were on average 5 years younger and were slightly more likely to be white; however, these differences did not reach statistical significance.
Table 1.
Patient demographics by group
| Escalating (n = 23) | Stable (n = 223) | P-valuea | Adjusted P-valueb | |
|---|---|---|---|---|
| Age, mean (sd) | 48.3 (17.7) | 53.4 (16.8) | 0.14 | 0.48 |
| Sex, n (%) | ||||
| Male | 9 (39%) | 105 (47%) | ||
| Female | 14 (61%) | 118 (53%) | ||
| Hispanicc, n (%) | 4 (17%) | 20 (9%) | ||
| Raced, n (%) | 0.61 | 0.61 | ||
| Caucasian | 19 (83%) | 148 (77%) | ||
| African-American | 1 (4%) | 15 (8%) | ||
| Asian | 0 (0%) | 9 (5%) | ||
| Native Hawaiian / Pacific Islander | 0 (0%) | 3 (2%) | ||
| Other | 3 (13%) | 18 (9%) | ||
Groups were compared using the Wilcoxon two-sample test for age and Fisher’s exact test for race. The P-value for race indicates comparison of white versus non-white patients.
Adjusted for multiple comparisons using Holm’s step-down procedure
Data are missing for 4 patients
Data are missing for 30 patients
Table 2 compares the opioid prescriptions for patients in the two groups. Hydrocodone comprised 74% and 87% of all prescriptions in the stable and escalating groups, respectively. After accounting for clustering of prescriptions within patients, the distribution of opioid types differed significantly between groups. Prescriptions for codeine were slightly more common in the stable group (8% compared to 3% in the escalating group) while prescriptions for oxycodone were much less common (4% compared to 17% in the escalating group). Prescriptions for fentanyl, methadone, and hydromorphone comprised fewer than 1% of prescriptions in the stable group and 6% of prescriptions in the escalating group. Prescriptions for Schedule II and long-acting opioids were also significantly less common in the stable group compared to the escalating group.
Table 2.
Characteristics of opioid prescriptions by patient group
| Escalating (n = 394) | Stable (n = 2548) | P-valuea | |
|---|---|---|---|
| Opioid type, n (%) | <.001 | ||
| Hydrocodone | 290 (74%) | 2226 (87%) | |
| Codeine | 12 (3%) | 208 (8%) | |
| Oxycodone | 68 (17%) | 103 (4%) | |
| Fentanyl | 5 (1%) | 10 (0%) | |
| Methadone | 13 (3%) | 1 (0%) | |
| Hydromorphone | 6 (2%) | 0 (0%) | |
| Classificationb, n (%) | <.001 | ||
| Schedule II | 92 (23%) | 114 (4%) | |
| Schedule III | 302 (77%) | 2434 (96%) | |
| Formulation, n (%) | .02 | ||
| Short acting | 365 (93%) | 2522 (99%) | |
| Long acting | 29 (7%) | 26 (1%) | |
| Median daily opioid dosec, (IQR) | |||
| Quarter 1 | 19.8 (7.4 – 45.1) | 9.2 (4.9 – 17.6) | |
| Quarter 2 | 37.1 (11.0 – 41.8) | 8.2 (4.9 – 17.3) | |
| Quarter 3 | 52.7 (36.3 – 84.4) | 9.9 (4.9– 19.8) | |
| Quarter 4 | 64.8 (55.2 – 118.7) | 9.9 (4.4 – 19.8) | |
IQR = interquartile range
Groups were compared using mixed effects regression models for non-normal data to account for prescriptions being clustered within patients.
Hydrocodone-acetaminophen was classified as a Schedule III medication during this study; it was re-classified as a Schedule II medication on October 6, 2014.
Measured in milligrams of morphine equivalents per day
Table 3 compares health care utilization for the two groups. During the year after their incident prescription, patients in the escalating group had an average of 16 additional outpatient encounters, a significantly higher number than patients in the stable group (P = 0.02). Specifically, patients in the escalating group had an average of 3 additional office visits, 5 additional telephone encounters, and 4 additional email encounters compared to patients in the stable group. On average, patients in the escalating group had 1 additional primary care office visit and a total of 8 more primary care encounters than patients in the stable group. Hospital admissions and emergency department visits were relatively uncommon for both groups.
Table 3.
Healthcare utilization by group
| Escalating (n = 23) | Stable (n = 223) | P-valuea | Adjusted P-valueb | |
|---|---|---|---|---|
| Outpatient encounters, c mean (sd) | 51.1 (20.3) | 35.5 (21.3) | < 0.001 | 0.002 |
| Office visits | 14.1 (7.1) | 11.0 (7.5) | 0.03 | 0.16 |
| Telephone encounters | 14.0 (11.5) | 8.6 (7.3) | ||
| Refill requestsd | 9.3 (5.7) | 9.4 (6.8) | ||
| Email encounters | 7.3 (7.9) | 3.2 (6.6) | ||
| Outpatient orderse | 4.4 (5.7) | 2.0 (2.9) | ||
| Nurse / ancillary staff encounter | 1.1 (2.3) | 0.9 (0.8) | ||
| Primary care encounters, mean (sd) | 31.7 (16.9) | 23.2 (13.1) | ||
| Primary care office visits, mean (sd) | 6.3 (4.1) | 5.3 (3.4) | ||
| Hospital admissions, mean (sd) | 0.6 (1.0) | 0.3 (0.7) | ||
| Emergency department visits, mean (sd) | 0.2 (0.5) | 0.2 (0.5) |
Groups were compared using Wilcoxon two-sample test.
Adjusted for multiple comparisons using Holm’s step-down procedure
Outpatient encounters includes all encounter types listed as well as home visits (n=60) and unclassified (n=4) encounters.
The majority of refill requests are requests from pharmacies; a minority are patient telephone calls.
These encounters are orders without any accompanying clinical documentation.
Table 4 shows clinical characteristics for each group. The proportion of patients with at least one benzodiazepine prescription was higher in the escalating group (52% compared to 36% in the stable group), but this difference did not reach statistical significance. The proportion of patients with hypertension, diabetes, and COPD/asthma was similar for the two groups, while the proportion of patients with back pain and low back pain was 16 and 18% higher in the escalating group, respectively. The proportions of patients with any mental health diagnosis and with substance use disorder were both substantially higher in the escalating group compared to the stable group. However, only the difference for substance use disorder reached statistical significance.
Table 4.
Clinical characteristics by group
| Escalating (n = 23) | Stable (n = 223) | P-valuea | Adjusted P-valueb | |
|---|---|---|---|---|
| Pain severity, c mean (sd) | 4.3 (1.7) | 3.9 (2.3) | ||
| Any benzodiazepine prescription, n (%) | 12 (52%) | 81 (36%) | 0.18 | 0.48 |
| Any outpatient urine drug screen, n (%) | 1 (4%) | 4 (2%) | ||
| Diagnoses, n (%) | ||||
| Hypertension | 5 (22%) | 53 (24%) | ||
| Diabetes mellitus | 4 (17%) | 40 (18%) | ||
| COPD/asthma | 2 (9%) | 20 (9%) | ||
| Back pain (general) | 14 (61%) | 100 (45%) | ||
| Low back pain | 13 (57%) | 88 (39%) | ||
| Osteoarthritis | 4 (17%) | 35 (16%) | ||
| Abdominal pain | 3 (13%) | 22 (10%) | ||
| Neck Pain | 5 (22%) | 33 (15%) | ||
| Headache | 1 (4%) | 18 (8%) | ||
| Any mental health diagnosis | 9 (39%) | 50 (22%) | 0.12 | 0.48 |
| Mood disorder | 5 (22%) | 24 (11%) | ||
| Anxiety disorder | 4 (17%) | 22 (10%) | ||
| Substance use disorder | 4 (17%) | 3 (1%) | 0.002 | 0.01 |
Groups were compared using Fisher’s exact test.
Adjusted for multiple comparisons using Holm’s step-down procedure
Measured on a 0–10 numeric rating scale (8 observations missing in the stable group)
Eighty-nine percent of all prescriptions in our sample were written by primary care clinicians. We found no significant difference between primary care and non-primary care clinicians regarding the proportion of prescriptions written to patients in the escalating group (P = 0.13).
DISCUSSION
In this study we characterized the change in daily opioid dose for patients during their first year of chronic opioid therapy for chronic pain. We identified 246 opioid naïve patients who stayed on long-term opioid therapy for at least a year; only 23 (9%) of these patients experienced an escalation in their daily opioid dose (defined as an increase of ≥30 mgME) over the year. Our hypothesis that patient characteristics associated with high versus lower-dose opioid therapy would also be associated with dose escalation was supported only for substance use disorders. The finding that patients with substance use disorders are significantly more likely to undergo dose escalation is consistent with prior research showing that patients with these diagnoses are at increased risk for both high-dose opioid use and opioid abuse.(9, 11, 14, 29) The most likely explanation for our negative findings relating to patient age, race, mental health disorders, and concurrent benzodiazepine use is that our study was underpowered to detect differences between groups due to the small size of the escalating group. The fact that the differences in clinical characteristics between the two groups were nearly always in the hypothesized direction provides some support for this interpretation. In addition, point estimates represented clinically meaningful differences for several variables.
We did find support for our hypothesis that patients with opioid dose escalation would have more outpatient encounters than patients without escalation. The difference in office visits (i.e., 3 additional office visits per year in the escalating group) is comparable to differences found in a prior study.(12) The large difference in total encounters (i.e., 16 additional encounters per year in the escalating group) was unexpected and, to our knowledge, has not been previously documented. One possible explanation for this finding is that patients in the escalating group contacted clinics more often because they experienced greater pain or were less satisfied with their pain management. However, average pain scores in the two groups differed by <1 point. Our results were also consistent with prior studies showing that primary care clinicians prescribe the majority of long-term opioids.(14)
It has not been previously shown that patients who experience opioid dose escalation during their first year of long-term opioid therapy have greater healthcare utilization and higher rates of substance use disorders. Some dose escalation during the first year of long-term opioid therapy likely represents appropriate dose adjustment. However, initial dose adjustments usually take place early in the course of opioid therapy; our results are unlikely to be effected by adjustments during the first 90 days of therapy because we calculated daily opioid dose by quarter. On the other hand, several aspects of our results suggest that patients in the escalating group are at high risk for opioid misuse and abuse. More than one-quarter of the patients in the escalating group were already getting more than 100 mgME/day within a year of their incident prescription (Table 2) and so these patients were already above the threshold associated with increased overdose risk (30) and opioid abuse.(9) In addition, the original clinical descriptions of opioid abuse among patients with chronic non-cancer pain reported that patients who developed opioid abuse typically showed aberrant opioid-related behaviors early in the course of therapy.(31, 32) Among patients with a prior substance use diagnosis, both dose escalation and frequent telephone calls during the first 3 months of therapy were associated with a subsequent clinical diagnoses of opioid abuse.(31) A recent primary care study also found that frequent telephone calls were associated with the development of clinically recognized opioid misuse.(33) The higher number of non face-to-face encounters (including both telephone and email encounters) among patients in the escalating group thus suggests that these patients are at increased risk of developing opioid abuse. Overall, our results are consistent with the phenomenon of “adverse selection,” the observation that high-risk patients are more likely to be prescribed high-risk opioid regimens.(29) Our results indicate that adverse selection may be seen within the first year of opioid therapy.
Our results corroborate existing clinical recommendations that clinicians should exercise additional care before starting or escalating long-term opioid therapy among patients with substance use disorders.(30) In addition, our study suggests that among patients started on long-term opioid use, frequent email and telephone calls outside of scheduled office visits are risk factors for opioid dose escalation. Future studies are needed to investigate whether opioids prescribed through telephone or email interactions (rather than during office visits) play a role in opioid dose escalation, prescription opioid abuse, or opioid-related overdoses. Of course, dose escalation also depends on factors that are not readily measured with electronic health record data such as clinician prescribing styles,(34) variations in patient physiology,(35) and patient socio-economic and insurance status.(36, 37)
Our study has several limitations. As previously discussed, it had limited statistical power to detect differences between patient groups; however, our study addressed a relatively understudied topic (i.e., dose escalation early in long-term opioid therapy) and our descriptive results suggest hypotheses that can be tested in future studies. Our findings relate only to opioid naïve patients with musculoskeletal pain who stay on opioids for at least one year and so do not generalize to patients on short-term or intermittent opioid therapy. In addition, our study used opioid prescription data from one university health system (rather than a prescription monitoring program or pharmacy records) so our data do not include prescriptions from outside that health system or paper prescriptions that were not recorded in the electronic health record. This limitation is most relevant to Schedule II opioids because California law requires that they be prescribed on paper rather than electronically.(38) Our results are thus likely to underestimate the degree of dose escalation because Schedule II opioid use was significantly more common in the escalating group and has been associated with high-dose opioid use in prior studies.(11) We sought to minimize the risk that confounding due to unrecorded prescriptions influenced our findings by restricting our analysis to patients with documented opioid prescriptions at least once every quarter and by manually confirming that patients were opioid naïve. Finally, our study did not directly address whether opioid dose escalation in the first year is associated with further escalation in subsequent years. However, the proportion of patients with dose escalation in our study (9%) is consistent with epidemiologic data showing that 5–10% of patients on long-term opioids progress to high-dose opioids.(2, 4, 5)
In summary, we found that opioid dose escalation during the first year of new long-term opioid therapy was associated with higher rates of substance use disorders and more frequent outpatient encounters, especially non face-to-face encounters. Many patients with early dose escalation are also likely at risk for subsequent transition to high-dose therapy. Clinicians may be able to identify these at-risk patients early in the course of therapy and so take steps to minimize the incidence of high-dose opioid therapy.
Supplementary Material
Acknowledgments
This study was funded by a grant from the UC Davis Center for Healthcare Policy and Research. Dr. Henry is supported by a KL2 award from NCATS (UL1TR000002 / KL2TR000134). We are grateful to Christopher Bautista, MD and Althea Crichlow, MS for assistance with record review and to Patrick S. Romano, MD MPH for advice on ICD-9 codes. Extraction of electronic health record data was performed by the UC Davis CTSC Biomedical informatics group.
Footnotes
DISCLOSURES/CONFLICTS OF INTEREST: Dr. Henry has received support from an educational grant from the ER/LA Opioid Analgesics REMS Program Companies. Drs. Wilsey, Melnikow, and Iosif have no conflicts of interest to disclose.
References
- 1.Hall AJ, Logan JE, Toblin RL, et al. Patterns of abuse among unintentional pharmaceutical overdose fatalities. JAMA. 2008;300:2613–20. doi: 10.1001/jama.2008.802. [DOI] [PubMed] [Google Scholar]
- 2.Centers for Disease Control and Prevention. Prescription Drug Overdoses - A U.S. Epidemic. MMWR Morbidity and Mortality Weekly Report. 2012;61:10–3. [PubMed] [Google Scholar]
- 3.Centers for Disease Control and Prevention. [Accessed July 8 2014];Unintentional drug poisoning in the United States. 2010 Jul; Available from: http://www.cdc.gov/homeandrecreationalsafety/pdf/poison-issue-brief.pdf.
- 4.Dunn KM, Saunders KW, Rutter CM, et al. Opioid prescriptions for chronic pain and overdose: a cohort study. Annals of Internal Medicine. 2010;152:85–92. doi: 10.1059/0003-4819-152-2-201001190-00006. [DOI] [PMC free article] [PubMed] [Google Scholar]
- 5.Bohnert AS, Valenstein M, Bair MJ, et al. Association between opioid prescribing patterns and opioid overdose-related deaths. JAMA. 2011;305:1315–21. doi: 10.1001/jama.2011.370. [DOI] [PubMed] [Google Scholar]
- 6.Baumblatt JA, Wiedeman C, Dunn JR, Schaffner W, Paulozzi LJ, Jones TF. High-Risk Use by Patients Prescribed Opioids for Pain and Its Role in Overdose Deaths. JAMA internal medicine. 2014 doi: 10.1001/jamainternmed.2013.12711. [DOI] [PubMed] [Google Scholar]
- 7.Seal KH, Shi Y, Cohen G, et al. Association of Mental Health Disorders With Prescription Opioids and High-Risk Opioid Use in US Veterans of Iraq and Afghanistan. Jama-J Am Med Assoc. 2012;307:940–7. doi: 10.1001/jama.2012.234. [DOI] [PubMed] [Google Scholar]
- 8.Gomes T, Mamdani MM, Dhalla IA, Paterson JM, Juurlink DN. Opioid dose and drug-related mortality in patients with nonmalignant pain. Arch Intern Med. 2011;171:686–91. doi: 10.1001/archinternmed.2011.117. [DOI] [PubMed] [Google Scholar]
- 9.Edlund MJ, Martin BC, Fan MY, Devries A, Braden JB, Sullivan MD. Risks for opioid abuse and dependence among recipients of chronic opioid therapy: results from the TROUP study. Drug Alcohol Depend. 2010;112:90–8. doi: 10.1016/j.drugalcdep.2010.05.017. [DOI] [PMC free article] [PubMed] [Google Scholar]
- 10.Edlund MJ, Martin BC, Fan MY, Braden JB, Devries A, Sullivan MD. An analysis of heavy utilizers of opioids for chronic noncancer pain in the TROUP study. J Pain Symptom Manage. 2010;40:279–89. doi: 10.1016/j.jpainsymman.2010.01.012. [DOI] [PMC free article] [PubMed] [Google Scholar]
- 11.Morasco BJ, Duckart JP, Carr TP, Deyo RA, Dobscha SK. Clinical characteristics of veterans prescribed high doses of opioid medications for chronic non-cancer pain. Pain. 2010;151:625–32. doi: 10.1016/j.pain.2010.08.002. [DOI] [PMC free article] [PubMed] [Google Scholar]
- 12.Kobus AM, Smith DH, Morasco BJ, et al. Correlates of higher-dose opioid medication use for low back pain in primary care. J Pain. 2012;13:1131–8. doi: 10.1016/j.jpain.2012.09.003. [DOI] [PMC free article] [PubMed] [Google Scholar]
- 13.Morasco BJ, Cavanagh R, Gritzner S, Dobscha SK. Care management practices for chronic pain in veterans prescribed high doses of opioid medications. Fam Pract. 2013 doi: 10.1093/fampra/cmt038. [DOI] [PMC free article] [PubMed] [Google Scholar]
- 14.Dobscha S, Morasco B, Duckart J, Macey T, Deyo R. Correlates of Prescription Opioid Initiation and Long-term Opioid Use in Veterans With Persistent Pain. Clin J Pain. 2013;29:102–8. doi: 10.1097/AJP.0b013e3182490bdb. [DOI] [PMC free article] [PubMed] [Google Scholar]
- 15. [Accessed June 16 2014];UC Davis Health System Facts and Figures. Available from: http://www.ucdmc.ucdavis.edu/leadership/facts_figures.html.
- 16.Sullivan MD, Edlund MJ, Fan MY, Devries A, Brennan Braden J, Martin BC. Trends in use of opioids for non-cancer pain conditions 2000–2005 in commercial and Medicaid insurance plans: the TROUP study. Pain. 2008;138:440–9. doi: 10.1016/j.pain.2008.04.027. [DOI] [PMC free article] [PubMed] [Google Scholar]
- 17.Deyo RA, Smith DH, Johnson ES, et al. Opioids for back pain patients: primary care prescribing patterns and use of services. J Am Board Fam Med. 2011;24:717–27. doi: 10.3122/jabfm.2011.06.100232. [DOI] [PMC free article] [PubMed] [Google Scholar]
- 18.U.S. Department of Justice Drug Enforcement Administration. [Accessed June 10 2014];Issuance of multiple prescriptions for schedule II controlled substances. Available from: http://www.deadiversion.usdoj.gov/faq/
- 19.von Korff M, Saunders K, Thomas Ray G, et al. De facto long-term opioid therapy for noncancer pain. Clin J Pain. 2008;24:521–7. doi: 10.1097/AJP.0b013e318169d03b. [DOI] [PMC free article] [PubMed] [Google Scholar]
- 20.Cifuentes M, Webster B, Genevay S, Pransky G. The course of opioid prescribing for a new episode of disabling low back pain: opioid features and dose escalation. Pain. 2010;151:22–9. doi: 10.1016/j.pain.2010.04.012. [DOI] [PubMed] [Google Scholar]
- 21.Wilsey BL, Fishman SM, Crandall M, Casamalhuapa C, Bertakis KD. A qualitative study of the barriers to chronic pain management in the ED. The American journal of emergency medicine. 2008;26:255–63. doi: 10.1016/j.ajem.2007.05.005. [DOI] [PubMed] [Google Scholar]
- 22.Agency for Healthcare Research and Quality. [Accessed May 27 2014];Clinical Classifications Software for ICD-9-CM. Available from: http://www.hcup-us.ahrq.gov/toolssoftware/ccs/ccs.jsp.
- 23.Laird NM, Ware JH. Random-effects models for longitudinal data. Biometrics. 1982;38:963–74. [PubMed] [Google Scholar]
- 24.Hayward RA, Heisler M, Adams J, Dudley RA, Hofer TP. Overestimating outcome rates: statistical estimation when reliability is suboptimal. Health Serv Res. 2007;42:1718–38. doi: 10.1111/j.1475-6773.2006.00661.x. [DOI] [PMC free article] [PubMed] [Google Scholar]
- 25.Yu L, Boyle PA, Leurgans S, Schneider JA, Bennett DA. Disentangling the effects of age and APOE on neuropathology and late life cognitive decline. Neurobiol Aging. 2014;35:819–26. doi: 10.1016/j.neurobiolaging.2013.10.074. [DOI] [PMC free article] [PubMed] [Google Scholar]
- 26.VA/DoD clinical practice guidelines. [Accessed June 11, 2014];Opioid therapy for chronic pain. 2010 Available from: http://www.healthquality.va.gov/
- 27.National Opioid Use Guideline Group. [Accessed June 12, 2014];Canadian guideline for safe and effective use of opioids for chronic non-cancer pain. 2010 Available from: http://nationalpaincentre.mcmaster.ca/opioid/
- 28.Holm S. A Simple Sequentially Rejective Multiple Test Procedure. Scand J Stat. 1979;6:65–70. [Google Scholar]
- 29.Sullivan MD. Who gets high-dose opioid therapy for chronic non-cancer pain? Pain. 2010;151:567–8. doi: 10.1016/j.pain.2010.08.036. [DOI] [PubMed] [Google Scholar]
- 30.Nuckols TK, Anderson L, Popescu I, et al. Opioid Prescribing: A Systematic Review and Critical Appraisal of Guidelines for Chronic Pain. Ann Intern Med. 2014;160:38–47. doi: 10.7326/0003-4819-160-1-201401070-00732. [DOI] [PMC free article] [PubMed] [Google Scholar]
- 31.Dunbar SA, Katz NP. Chronic opioid therapy for nonmalignant pain in patients with a history of substance abuse: report of 20 cases. J Pain Symptom Manage. 1996;11:163–71. doi: 10.1016/0885-3924(95)00165-4. [DOI] [PubMed] [Google Scholar]
- 32.Portenoy RK, Foley KM. Chronic use of opioid analgesics in non-malignant pain: report of 38 cases. Pain. 1986;25:171–86. doi: 10.1016/0304-3959(86)90091-6. [DOI] [PubMed] [Google Scholar]
- 33.Cheatle MD, O’Brien CP, Mathai K, Hansen M, Grasso M, Yi P. Aberrant behaviors in a primary care-based cohort of patients with chronic pain identified as misusing prescription opioids. Journal of opioid management. 2013;9:315–24. doi: 10.5055/jom.2013.0174. [DOI] [PubMed] [Google Scholar]
- 34.Bergman AA, Matthias MS, Coffing JM, Krebs EE. Contrasting Tensions Between Patients and PCPs in Chronic Pain Management: A Qualitative Study. Pain Med. 2013 doi: 10.1111/pme.12172. in press. [DOI] [PubMed] [Google Scholar]
- 35.Hutchinson MR, Bland ST, Johnson KW, Rice KC, Maier SF, Watkins LR. Opioid-induced glial activation: mechanisms of activation and implications for opioid analgesia, dependence, and reward. The Scientific World Journal. 2007;7:98–111. doi: 10.1100/tsw.2007.230. [DOI] [PMC free article] [PubMed] [Google Scholar]
- 36.Centers for Disease Control and Prevention. Overdose deaths involving prescription opioids among Medicaid enrollees - Washington, 2004–2007. MMWR Morb Mortal Wkly Rep. 2009;58:1171–5. [PubMed] [Google Scholar]
- 37.Franklin GM, Mai J, Wickizer T, Turner JA, Fulton-Kehoe D, Grant L. Opioid dosing trends and mortality in Washington State workers’ compensation, 1996–2002. Am J Ind Med. 2005;48:91–9. doi: 10.1002/ajim.20191. [DOI] [PubMed] [Google Scholar]
- 38.California Board of Pharmacy. [Accessed June 10 2014];Prescribing and dispensing controlled substance prescription forms. Available from: http://www.pharmacy.ca.gov/consumers/prescribe_dispense.shtml#sb151.
Associated Data
This section collects any data citations, data availability statements, or supplementary materials included in this article.